Structural Changes and Their Ianetics in
Hydrogen-Containing Palladium Systems
By V.
M. Avdjukhina, A.
A. Katsnelson and G. P. RevkevichDepartment of Solid State Physics, Moscow State University, 117234 Moscow, Russia
Non-trivial structural changes and phase transformation kinetics have been found to occur in palladium-hydrogen and palladium-metal-hydrogen systems during relaxation processes as hydrogen is released. In the palladium-hydrogen system these changes take place in stages: an incubation period, a period of fast degassing, a period of stabilisation, and a post-stabilisation period. In palladium-metal-hydrogen systems the structural changes and phase transformations are non-monotonous (oscillating or stochastic). Time dependent kinetics have been observed over periods of up to tens of thousands of hours. An hypothesis based upon non-equilibrium thermodynamics and hydrogen interaction factors between matrix defects and atoms in the palladium systems is proposed to explain the phenomena.
The unique ability of palladium (Pd) to absorb large quantities of hydrogen (H) was discovered about 130 years ago by Thomas Graham (1). The solution of H in Pd has a considerable effect on
the physical properties of the Pd (2,3); for exam- ple, the Pd-H alloy is diamagnetic and super- conducting, although Pd itself is strongly paramag- netic. These differences are connected with the atomic and electronic structural changes which occur when H dissolves in Pd. Only atomic struc-
tural characteristics will be considered here. Solid solutions of H in Pd correspond to 01-
phase regions if the atomic ratio of HPd, nH/npd,
is less than 0.024.03, and to P-phase regions if the nH/npd ratio is greater than
-
0.60. When the ratio lies between these values, a mixture of both phas- es is present. In both the 01- and P-phases, the Pd atoms form a f.c.c. structure, with H atoms occu- pying octahedral interstitial sites. The distance between Pd atoms in the P-phase is-
3 per cent greater than in the a-phase, which is why thea
HP
phase transition process is accompanied by defect generation. The structural changes talung place in Pd-H during saturation with hydrogen and during degassing have become the subject of sys-tematic research. The changes occurring in the lattice and in the defect structure during the 01
+
P
phase transition up toP
saturation, and during courses ofP
+
degassing are of particular inter-est. These processes and their kinetics have been examined in our research (4-12).
Stnkmg data obtained during our work show the important roles that the formation of defect structure (at saturation) and its transformation (during degassmg) play. Thus the nature of the hydrogen effects on the structural changes in Pd-H solutions and on the kinetics is significant. The mutual disorder in the distribution of Pd and other metal atoms is an additional source of defect structure formation. The most striking effects may be expected in solutions where the metal is very different to Pd - in terms of its affinity to hydro- gen. Some new characteristics of the structural changes that appear when Pd systems are saturat- ed with hydrogen can also be expected. Our results confirm that these structural changes are non-
Characteristics of the structural changes in Pd and some Pd-M alloys at saturation and during degassing will be considered here. X-ray tech- niques described elsewhere were used (1621).
trivial (13-21).
Samples
and
Methods of Investigation
Samples of Pd alloys were prepared by arc melt- ing from highly pure (99.98Yo) elements in
an argon atmosphere using a titanium getter, fol- lowed by annealing (for 24 h) at 900°C at a pressure of lo* mm Hg to reach a homogenised
n
-
1 5-
;;
0 0 .- 0 5 4
I
TIME, minutes
1
3
I
.
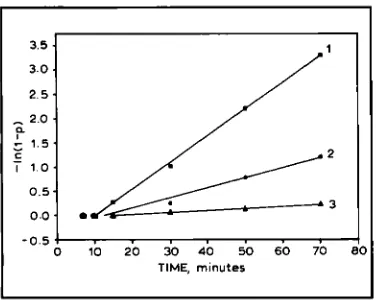
Fig. I The logarithmic dependence of the Pphase
concentration ( p ) in Pd on the hydrogen saturation time.
The lines relate to regions or ‘blocks’ (hkl blocks) of coherent scattering with crystallographic planes. The initial incubation periods for the three blocks can be seen before the lines begin.
Line 1 is for ( 1 0 0 ) blocks Line 2 is for (311) blocks Line 3 is for ( I 10) blocks
state. After homogenisation, the samples were cut (using an electric spark method) into discs, 16-18 mm in diameter and 0.2-5 mm thick. These were then ground and polished with diamond paste to a mirror-like condition. The X-ray diffraction maxi- ma of these samples were wider than for non-deformed samples. The grinding and polish-
ing had created a deformed surface layer to a depth of > 10 pm (greater than the X-ray penetration depth (4 to 5 pm)). Samples were hydrogenated electrolytically ( 7 4 0 minutes at a current density of 2 5 8 0 mA cm-’) in a bath of aqueous NaF solution (~?J’o) at room temperature. The sample under investigation was made into an cathode, the anode was a Pt plate. Degassing was performed in
air at room temperature. In some samples anneal- ing removed the effects of the deformation. Hydrogen saturation was attained after one sequence or after repeated cycles of ‘saturation- degassing’ (cycling).
Peculiarities of Phase
Transformations in
Pd-H
Plots of the dependence of the P-phase con- centration p(t) in Pd on saturation times at low current density (2.5 mA cm”) show a logarithmic dependence between the In(1 - p) function and the
time, see Figure 1 (7). Lines 1, 2 and 3 relate to
regions or ‘blocks’ of coherent scattering ((hh’) blocks) which have crystallographic planes with
(loo),
(311) and (110) indices, respectively, parallelto the external surfaces of the sample.
The experimental points lie on straight lines that do not pass through the coordinates (0,O). The dependence of the P-phase concentration on time is:
P(4
=’
-*[-
rtt-
fdl
where y represents the logarithmic rate of P-phase
growth and to represents the duration of the incu- bation period. Both y and t o depend on the crystallographic orientation of the ‘block‘ planes with respect to the external surface. The factor is a maximum for the (100) blocks and a minimum for the (110) blocks, while to is a minimum for (100) blocks and a maximum for (110) blocks. The dependence on orientation is considered to be greater for y than for to.
In addition, to and y depend upon the current density,j. A s j increases up to 25 mA cm-’, the incubation period to decreases almost 40 times for the (100) block while y increases by one order of magnitude. These findings can be explained by the kinetic theory of first-order phase transformation
(7). According to this theory, the
P
+
a
phase transformation can take place when the decrease in internal energy (due to a-phase formation) is greater than the amount of energy needed to make boundaries between the new phase and the old one, to generate defects and to increase the elastic energy of the matrix. (Elastic tension will appear because of differences in the specific volumes of the phases).During the
a
+
p
transformation, the effective pressure resulting from the saturating hydrogen, (defined by the charging current density in the elec- trolyte bath) becomes part of a ‘thermodynamic stimulus’. The ‘embryos’ of the new phase at thea
+
P
transformation are in plate form. Due to the increasing number of ‘embryos’ there is an energy loss linked to the elastic tension in the ma&, this energy loss is anisotropic. The elastic energy asso- ciated with the appearance of the ‘embryo’ phases reaches a minimum when their surfaces are parallelto the crystallographic (100) plane.
The defect structure affects both the ‘thermo- dynamic stimulus’ and the phase transformation kinetics. Phase transformations occur by a sponta- neous movement of the boundary between the
a-
and P-phases (22). In fact, the rate of increase of the @phase concentration depends on the height of the energy barriers which have to be crossed during migration of the a-crystal boundary (as a - phase transforms into P-phase) (12). The defects, which lead to irregularly distributed energy barriers of different heights, hamper movement and also decrease the
a
+
P
transformation rate. The ener-gy of the interphase boundary migration reaches a
minimum when the ‘embryo’ surface is parallel to the (100) crystallographic plane.
The factors specified above explain the exis- tence of the ‘incubation’ period and its anisotropy. The value of to decreases as j increases, while to
increases as the defect concentration increases and there is stronger anisotropy with the rate of new phase growth.
Research to understand the factors involved in the structural changes duting the
p
+
a transfor-
mations was performed on annealed samples aftera single saturation and deformation, and on
annealed samples saturated with hydrogen by repeated cycling.
Annealed
Samples
with
aS
w
e
Saturation
For a single saturation annealed sample, the
P
+
a
phase transformation (j = 40 mA cn-*,tSat = 15 min) began immediately after hydrogen saturation. During the first 25 hours the P-phase content decreased 30 times (6). The first 5 hours was the incubation period in the deformed sample. During the next 25 hours the P-phase concentra- tion decreased 2.5 times and during the next 150 hours the P-phase decreased by up to 30 per cent of its original value.
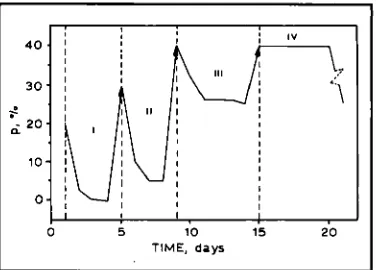
The changes in P-phase concentration in an annealed sample during saturation cycling are shown in Figures 2 and 3 (11). In Figure 2 the incubation period is missing for the first three cycles. The degassing rate decreases as the number of cycles increases. The incubation period appears after the fourth saturation.
-?
r i
I1
I”
I 4 0 .I
II I
I
l o -
0 -
I I
I I
I I I
I
I I II I
0 5 10 15
I
20
TIME, days
Fig. 2 Dependence of the /%phase concentrution on time for cycles I, 11, 111 and IV The arrows show that p changes at hydrogen saturation. In IV thejlut area of the initial incubation period can be seen
100, 1
60
I
a 4 0
I ,
. .
,.
,.
. J20 4 0 60 80 100 120 140 160 TIME, thousand hours
Fig. 3 Dependence of the /%phase concentration on time a f e r the ninth hydrogen saturation for the
(100) and (311) blocks. The incubation period is omitted
but the other stages of degassing: the fast decrease in
p
concentration, stabilisution, and post-stabilisation withoscillations in the /%phase concentration, can be seen
Figure 3 shows the dependence of the P-phase concentration, p(t), on time after nine saturations. Immediately after the ninth saturation the value of p(t) was 80 per cent; this value had been constant over a period of 4000 hours. The P-phase concen- tration then decreased over 46,OOO hours. After this time the P-phase concentration remained constant for 50,000 hours, and then began to change again,
with oscillating behaviour. The
p
+
a
process thus appears to have a ‘stage-like’ character.Unlike the 01
+
p
process, theP
+
a
trans- formation occurs spontaneously in air, although the initial stage is hampered by the defect structurethat is already present. Further progress is influ- enced by the generation of new defects and then
.- E A n
c
.- E
w
e
P>r
r - 1 . 2
- 1.6
-
2.04 7
0 10 20 30 40
TIME, days
0.4
0
31;
-0.45 -0.8
-1.2
-
1.60 0
50 60 70 80 90
TIME, days
by transformations that follow defect generation in the defect structure. An incubation period was noticed after a single saturation only in a deformed sample, but was noted in annealed samples after the fourth saturation. After nine saturations the incubation period became much longer following mechanical treatment of the surface because by then the dislocation density had been increased.
Decreases in p(t) during the next stage of degassing show exponential characteristics only when the defect concentration is not large. Increases
in defect concentration, and the resulting creation of complexes (vacancy complexes, dislocation walls) lead to the appearance of lugher and wider energy barriers in that region. Decreases in p(t) can be described by a power dependence or even by a log- arithmic function dependence on t, as postulated in
(12). Any kind of time dependence (power or loga- rithmic) relates to a transition to another kind of defect. The transition to the next stage where p(t) stops changmg rmght correspond to specific trans-
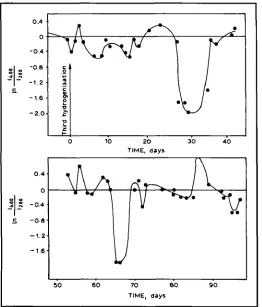
Fig. 4 The dependence .f ln(14,x/t2~w) on the relaxation time for Pd-11.3 at.% W alloy afrer the third hydrogen saturation
formations in the defect struc- ture. One of the characteristics of the transformation is the growth of blocks in the (x-
phase, which occur because regions of the dislocation wall migrate to block boundaries (11). As this process can occur
in different parts of a sample at
different rates, an additional
irregularity appears in the system in the distribution of energy barriers in the a-phase crystals. This leads to additional hampering of the interphase bound- aries, which stops p(t) decreasing. After the growth of the blocks is completed the 'hampering factor' of boundary migration should disappear.
The accumulation of defects and hydrogen at
the boundaries of the block regions can lead to an opposing process. This causes p(t) to change
(oscillating character) and thus produce the next
stage of relaxation. The character of the structural changes that take place at hydrogen saturation and subsequent degassing seem to be closely related to the transformations simultaneously occurring in the defect structure.
Structural Changes in Pd-M-H
Alloys and Their Time Dependence
The unusual kinetics found for the structural changes caused by transformations in the defect structure encouraged us to look at the kinetics of
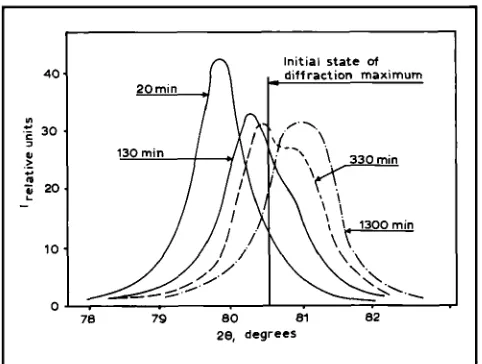
Fig. 5 Profiles of the X-ray diffraction maximum for Pd-8 at.% Er alloy, at 20, 130, 330 and 1300 minutes after
saturation with hydrogen n Initial state diffraction maximum of
78 79 00 81 82
28, degrees
structural change in Pd-M-H alloys. Kinetic aspects of these structural changes have been examined in Pd alloys with tungsten, W, (13-14),
samarium (15), erbium, Er, (16-21), and in more detail on annealed Pd-W (11.3 at.% W) and deformed Pd-Er (8 at.% Er). The alloyhg ele- ments are characterised by their degree of affinity to hydrogen. Tungsten has a lower affinity for hydrogen than Pd, while Er has a %her affinity. In the equilibrium diagrams for these alloys, there is no P-phase region for a Pd-W alloy containing 11.3 at.% W, in fact, the Pd-11.3 at% W alloy is characterised by regions rich in W (2-3 nm in size) (23), and by superfluous concentrations of vacan- cies (24). Pd-Er alloys (8 at.% Er) are also dose to the solubility boundary.
Palladium-Tungsten Alloys
The dependence of the intensities, In(b/Izo~),
on time in Pd-W doys is shown in Figure 4 after the third saturation (Im and Izm are the normalised intensities of the X-ray diffraction maxima for 400
and 200, respectively) (1S14). The dependence seems to be quasi-periodic as its character shows that two types of oscillations may be occurring in the system. The first oscillation is connected to the structural changes which cause the quasi-periodic changes in the function. During the ini-
tial stage, this oscillation has a period of
-
7 days. The second oscillation is connected to sa~ctural changes characterised by abrupt short-term broad-ening of the diffraction maxima and decreases in their upper regions which occur every 4 to 5 weeks (the broadened diffraction maxima
tvmgs'
expand so far that correct measurement is impossible). Quasi-periodic oscillations of the first type change to stochastic oscillations after transition through a second-type structural change.The decrease in the I n ( I ~ / I ~ ) function for the
first process can be caused by the appearance of defect regions of size 2-3 nm (25) and specific vol- ume. Increases in the In(Im/Izm) function can be associated either with solutions of these regions or with the approach of their specific volumes to that of the matrix (defect disappearance). The width of oscillation of the difftaction maxima may be con- nected with the appearance and subsequent disintegration of dislocation loops of size 5 1 0 nm
(25).
The appearance of oscillation in the structural change after hydrogen saturation of the system indicates that hydrogen-rich clusters have been formed in the Pd matrix. The specific volume of these dusters is larger than that of the ma& and thus the dusters are not thermodynamically stable under normal conditions. For a 'non-contradicto-
if model of this phenomenon it can be supposed
that stability will increase if the number of defects decreases - because superfluous vacancies diffuse into the hydrogen-enriched dusters. A lack of vacancies arising during this process in W-rich regions will be stimulated by contra-directed
Pkztinum Metals Ra., 2002, 46, (4) 173
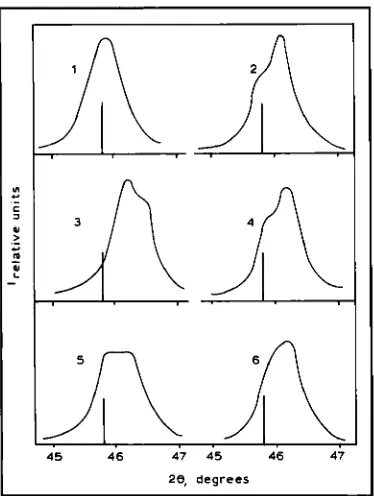
45 46 47 45 46 47
2e, degrees
Fig. 6 Profiles of X-ray diffraction muxima for Pd-8 at.% Er alloy at various times after hydrogen saturation: ( I ) 1.5 hours, (2) 7 hours.
( 3 ) 25 hours, ( 4 ) 48 hours, (51 I20 hours, ( 6 ) 4200 hours
vacancy diffusion; this will result in oscillation of the moving vacancies and will lead to first-type structural oscillation. After a few cycles, the vacan- cy concentration in the Pd-rich regions becomes
so large that it would seem more advantageous to
form large vacancy dislocation loops during the intermediate period (although these loops would be unstable). The loops disintegrate soon after they form, and then the process of defect cluster for- mation and disappearance begins again. This
model is, of course, an hypothesis and requires more direct proof. Nevertheless, it does describe the experimental data and may be used as the basis for a stricter model of the observed phenomena.
Palladium-Erbium AUoy
The initial state in deformed Pd-8 at.% Er alloy (caused by grinding and polishing) is characterised by an essentially non-homogeneous distribution of the constituents and by a strong stretching tension (acting outwards to the surface) that acts perpen- dicularly to the surface. After hydrogen saturation the tension changes to compression. Maximum
compression was reached two days after hydrogen saturation. After eight days the value of the com- pression had decreased by 25 per cent; then it remained practically constant for the next 1.5 years
After hydrogen saturation the profile of the X-
ray diffraction maxima becomes doublets, see Figure 5. This indicates that two phases develop that essentially differ from each other by the peri- od of the lattice. The time dependence of the maximum profile has oscillating character, see Figure 6. Computer analysis of the profiles allowed us to determine the time dependencies of differ- ences in Er concentrations in corresponding phases and specific parts of these phases. The data in Figure 7 indicate that irregular oscillations (sto- chastic) in the indicated characteristics have been occurring for 1.5 years. The oscillations occur in the initial stage of degassing when there is 10-20 per cent of H in the system and also in the later stages when the concentration of H is not more than 1 per cent (1S20). The data are explained (17-18).
04 I
1.5 10 1 0 0 1000 10000 TIME, hours
Fig 7 The dependence cfthe concentration of specific parts of corresponding Er-rich phases in Pd-8 at.% Er alloy on time, after hydrogen saturation
with a model which takes into account the micro- scopic theory of alloys and a synergy model.
The lattice compression found in the alloy afier hydrogen saturation can be caused by transforma- tion of the defect-metal (DM) complexes present in the alloy before saturation into hydrogen- defect-metal (HDM) complexes because the hydrogen-defect bond in Pd has hgher energy (26). Thus, the HDM complexes have low specif- ic volume. As Er has a hgh affinity to hydrogen, these complexes attract Er atoms and trap them. They play a dual role, keeping the system in a non- equilibrium state and allowing the appearance of ascendmg diffusion. According to synergy consid- erations, non-equilibrium conditions in the system permit oscillations connected to self-organisation of the defect-structural states to appear (27). A competition between ascendmg diffusion and gra- dient diffusion provides a mechanism which allows any possible oscillations to be realised.
The various diffusion fluxes caused by the com- petition in the two-phase system with the Er traps can cause oscillations in the phase transformation kinetics. The stochastic nature of these oscillations may be related to differences in relaxation times of the different oscillation processes.
Conclusions
Structural changes peculiar to the hydrogen- containing systems Pd-H and Pd-M-H, where M is a metal having a different affinity for hydrogen to Pd, have been considered. Non-trivial kinetics for the
p
-+
CL transformation in Pd-H have been found. The most important feature is the altemat- ing stages in the P-phase concentration which may or may not occur. This phenomenon is related to the influence of the origmal defect structure on the transformation kinetics during thep
+
CL phase transformation. The second important feature in the CL Hp
transformation is the strong depen- dence of the associated p(t) function on the orientation of the (hM) blocks relative to the exter- nal surface. This is caused by the elastic energy dependence resulting from the orientation of the plate formations.In Pd-M-H systems the kinetics of the structur- al changes have oscillating character related to the
defect subsystems caused by the non-homoge- neous distributions of the metal and the associated non-homogeneous hydrogen distribution. Hydrogen is captured by regions that have a hgh bondmg energy for hydrogen and this keeps the system in a non-equilibrium state. This can lead to several diffusion fluxes where ascendmg and gra- dient diffusions compete.
Such ‘static’ instability can transform the dynamics to dynamics similar to those of Benard cells (27). Accordmg to alloy structure considera- tions, the oscillating character of the structural changes can have different characteristics, indud- ing an alternating appearance and, in Pd-W-H, the disappearance of the defect regions. In Pd-Er-H the structural changes may also have the form of stochastic phase transformations.
The long-term oscillating structural changes in hydrogen-containing alloys correlate with changes in strength characteristics, for example, those in rolled steel (28). Further investigations of the observed phenomenon will be to find Pd alloys in which it occurs and to examine its nature and any practical applications. Alloys Pd-Mo-H and Pd- Ta-H alloys are now being studied.
Acknowledgement
This work has been supported by the Russian Fund of
Fundamental Research, under grants Nos. 99-02-16135 and 02- 02-16537.
References
T. Graham, Phil. Trans. Rcy. Soc., 1866,156,399 P. V. Gel’d, R A. Rjabov and L. P. Mokhracheva, “Hydrogen and Physical Properties of Metals and Alloys: Transition Metal Hydrides”, Nauka, Moscow, 1985
“Hydrogen in Metals I”, eds. G. Alefeld and J. Volkl, Springer-Verlag, Berlq 1978
A. A. Katsnelson, G . P. Revkevich, S. V. Sveshnikov et a l , Metakj$aa, 1985,7, (2), 66
G. P. Revkwich, S. V. Sveshnikov and A. A. Katsnelson, I?. W Z o v , Fiz, 1988,31, (5), 102 G. P. Revkevich, A. I. Olemskoi, A. A. Katsnelson and V. M. Khristov, Met&j$a, 1990,12, (3), 71
G. P. Revkevich, A. I. Olemskoi, A. A. Katsnelson and M. A. Knjazeva, M O J ~ W Univ. P l y . BnL, 1992, G. P. Revkwich, A. I.’ Olemskoi, A A. Katsnelson and M. A. Knjazeva, P ~ J . Met. Met., 1993,76, (l), 101 A. A. Katsnelson, M. A. Knjazeva, A. I. Olemskoi and G. P. Revkevich, S n ~ Invest., 1998,13,1443 33, (2), 74
P/acinrcm Metah Rev., 2002,46, (4) 175
1 2
3
4
5
6
7
8
10
11
12
13
14
15
16
17
18
19
20
21
A. A. Katsnelson, M. A. Knjazeva, A. I. Olemskoi and G. P. Revkevich, Plys. Solid Stute, 1997,39,
0,
1275
A. A. Katsnelson, M. A. Knjazeva, A. I. Olemskoi and G. P. Rwkevich, Mosmw Uniu. Plys. BwU, 1997, 38, (6),46
A. A. Katsnelson, M. A. Knjazeva and A. I. Olemskoi, P l y . Solid Stute, 1999,41, (9), 1621 A. A. Katsnelson, A. I. Olemskoi, G. P. Revkevich and I. V. Suhorukova, Mosmw Uniu. P l y . Bwll., 1994, 35, (3). 68
A. A. Katsnelson, A. I. Olemskoi, G. P. Revkevich and I. V. Suhorukova, Ply&-U@kbi, 1995,165, (3), 331 A. A. Katsnelson, G. P. Revkevich and V. M. Avdjukhina, Mosmw Uniu. Ply. BwU., 1997,38, (3), 68 V. M. Avdjukhina, A. A. Katsnelson and G. P. Revkevich, Sw$ Invest., 1999,14, (2), 30
V. M. Avdjukhina, A. A. Katsnelson, N. A. Prokofjev and G. P. Revkevich, Mosmw Uniu. Phys. BwU, 1998,39, (2), 71
V. M. Avdjukhina, A. A. Katsnelson and G. P. Revkevich, Ctyst. Rtp., 1999,44, (l), 49
V. M. Avdjukhina, A. A. Katsnelson and G. P. Revkevich, Momw Uniu. Pbs. BwU, 1999, 40, (5), 44 V. M. Avdjukhina, L. Dabrowskii, A. A. Katsnelson, J. Suvalskii, G. P. Revkevich and V. M. Khristov,
P l y . SolidState, 1999,41, (9), 1532
V. M. Avdjukhina, A. A. Katsnelson, D. A. Olemskoi, A. I. Olemskoi and G. P. Revkevich, P l y .
Met. Met., 1999, 88, (6), 576
22 H. C. Jamieson, G. C. Weatherly and F. D.
Manchester,J. LwCommon. Met., 1976, 50, (l), 85
23 S. A. Alimov and A. A. Katsnelson, P l y . Met. Met.,
1966,22,468
24 A. A. Katsnelson and A. I. Olemskoi, “Microscopic Theory of Non-homogeneous Structures”, Mir Publishers, Moscow, AIP, New Y o 4 1990
25 M. A. Krivoglaz, “Diffraction of X-Rays and Neutrons by Non-Ideal Crystals”, Naukova Dumka, Kiev, 1983
26 S. M. Myers, M. J. Baskes, H. K. Birnbaum et ul, Rev. Mod Pkys., 1992, 64, (2), 559
27 I. Pngogjne, “From Being to Becoming Time and Complexity in the Physical Sciences”, W. H. Freeman and Co., San Francisco, 1980
28 V. M. Piskovets, T. K. Sergeeva, Yu. A. Bashnin and 0. V. Nosochenko, SteeI, 1994,(7), 60
The Authors
Valentina M. Avdjukhina is an Associate Professor of Physics at Moscow State University. Her interests include X-ray diffraction crystallography, non-equilibrium systems, metal-hydrogen alloys and platinum metals.
Albert A. Katsnelson is a Professor of Physics at Moscow State University. His interests include X-ray diffraction crystallography, non-equilibrium systems, metal-hydrogen alloys, the electronic theory of condensed matter, synergetics and platinum metals.
Galina P. Revkevich is a Senior Scientist at Moscow State University. Her interests are X-ray diffraction crystallography, non- equilibrium systems, metal-hydrogen alloys and platinum metals.
Polymer-Supported Rhodium Catalysts Soluble
in
SC-CO?
In organic syntheses utilising homogeneous cat- alysts, the catalysts are dissolved in a suitable solvent which also acts as the reaction medium. These solvents are often toxic organic liquids, so
there is a growing need to replace them with envi- ronmentally benign solvents, such as water or supercritical carbon dioxide (sc-COZ). At present, the majority of organic syntheses are solvent-sensi- tive and most homogeneous catalysts are not soluble in either water or SC-CO~.
Separating and recovering the homogeneous catalysts at the end of the reaction is also a major problem. To overcome this, increasing attention is being directed at developing polymer-supported ligands for complexing with homogeneous metal catalysts for straightforward membrane separation. Researchers at Texas A & M University, U.S.A.,
The polymer was prepared by polymerisation of the monomer lH,lH,2H,2H-heptadecafluorode-
cyl acrylate (zonyl TAN) and N-acrylosuccinimide (NASI); zonyl TAN increases the solubility in sc- COZ while NASI provides attachment sites for the catalyst. N H ~ ( C H ~ ) ~ P P ~ Z (DPPA) was then used to exchange the NASI groups in the polymer. Finally, this was reacted with pulCl(COD)]z to obtain the sc-COZ soluble, polymer-supported Rh catalyst. As the polymer is a very large molecule it was easily separated by a membrane.
Catalyst hydrogenation activity was evaluated using 1 -0ctene and cyclohexene at different molar ratios of substrate:% and different temperatures. Most reactions were performed at 173.4 bar pres- sure for 12 hours. Conversion of I-octene to n-octane was nearly 100%. Conversion of cyclo- have now succeeded in developing a homogeneous
catalyst that is soluble in sc-COZ solvent (2. K. Lopez-Castillo, R Flores, I. Kani, J. P. Fackler and A. Akgerman, Ind Eng. G e m . Res., 2002, 41, (13), 3075-3080). They did this by attaching a homoge- neous rhodium (Rh) catalyst to the backbone of a
fluoroacrylate copolymer. catalyst is reproducible.
hexene increased
4
t
h
temperature: at 368 and 393 K, the maximum conversions were 39 and 51%,respectively. For this hydrogenation, the catalyst was Rh(TAN15DPPA)Cl with a