Transformation F rom Ag ricu lture to Non Agr icultural Employment in India Dr. Dara Singh, Assistant Professor, Department of Economics,
Kurukshetra University Kurukshetra, Haryana,
ABSTRACT: The case study has been conducted to analyse the changing structure of rural production and employment in the last two decades and its implications on rural
labour market. The rural labour market has gone under profound structural changes,
where the labour is moving from agriculture sector to non agriculture activities. At
present non farm sector has no longer remained a residual sector. But as per the data
collected in 2010 , they display that non farm sector has become the hub of rural
development and tran sformation and it is contributing 65% to the rural Net Domestic
Product. Simultaneously it has been observed that there is great decline labour force
in the agriculture sector, the decline in fema le labour work force is much higher than
male work force.
KEYWORDS: agriculture, employment, labour, rural, India
INTRODUCT ION: The key changes took place are as higher gr owth in non farm se cto r especially in infrastr ucture a nd cons tr uctio n with impr oved transp orta tion ,
communica tion , differen tial wage ra tes, improved litera cy ra te and government
programmes. This is very important tran sfo rmation of rural labo ur from agriculture
to non agricul ture sector and migration fr o m rural areas to cities especially of male
workfor ce, which led to tightening of the la bour marke t. Due to the tr ansfo rmation
from agriculture to n on farm se ctor, i t ca used great wan t of lab our fo rce to the
increasing agriculture prod uction in Indi a. Labour marke t also o bserved some
stru ctur al cha nges as disa ppearan ce of b on ded labour and contr actual arra ngement
of rur al labou r. Although casual lab our has been visual ized as predominan t
increasingly shifting fr om daily wage to co n tractual wo rk with in creasing ba rgaining
power o f lab our.
During the case s tudy many policy relate d changes have been realized in the
research which require to be implemented as development o f labour saving
programme, especially for women and youth , strengthening rural -urba n co nnectivity,
social pr ote ction to migrant labo ur a nd capa city b uilding programmes f or skill
enhancemen t.
Earlier or pre independen ce even after a long time of independence
agriculture h ad been considered a s the ba ckbone of the coun try and more than 70%
populatio n was e ngaged in agricultural a ctiv ities. In the p ost independe nce e ra many
changes took place in the con cerned sector. The share of agriculture in the GDP
dropped drama tically from 41% to 1 4% be tween the period 1 972 to 2 01 1, on other
hand the s hare of ter tiary increase d from 3 5% to 5 8%. It was witnessed tha t with in
the rural labour mark et tha t significant str uctural transf ormation was taking place
and rural labo ur is migrating to ci ties for em ployment in non agricultur al sector. Non
agricultural activities accoun t for almost 65 % of the rural net d omestic p rodu ct, in
200 9-1 0, while in 1 98 0-8 1 it was mere 37 %. To day this se ctor emerge as a main
driver of rural development a nd tra nsforma tion. In the con cerne d research paper the
objective of the research is to find ou t the changes in the rural lab our marke t with
particular refere nce to rur al no n fa rm emplo yment an d ru ral transf ormation in India.
It has been o bserved tha t the de cline in fem ale workfor ce is mu ch higher tha n
the male workforce in agriculture. For the female population the labour f orce
participa tion ra te during the period fr om 1 993- 94 to 2 009 -10 declined fr om 33% to
26.10 , and d uring the same period the decli ng rate of male workfor ce was 55.3% to
54.7%, in the male workf orce marginal de cline observed during mentio ned period.
For the female declining rate de cline in labour workfo rce was due to the enrolment
of girls in education and increase in real wages of rural male workforce are the
factors which may be termed as the m ajor reason for the decline of female
workfor ce.
During 199 3-94 the share of r ural n on -farm employment was quite subs tan tial.
This increase in the con cerned sector was due to higher growth in the non -farm
differential wage rates , improved literacy rate and governmen t pr ogrammes. The
foremost factor of this ch ange was con str uctio n se cto r in whi ch employmen t has
increased 12% per year especially during 19 99 -2 00 0 and 200 9-1 0, which boos ted the
rural – urba n migration f or temporary and in this perio d higher migration of m ale
workshop was ob servation for higher wages. For female workf orce this period was
also not so go od in compariso n male coun terpar ts. Bu t the reason of w orry is the
dramatically decline in the ra te of gro wth of employment in manu facturing,
community , socia l and other services. Duri ng the period from 199 3 -9 4 and 20 09- 10
the sh are of manufa cturing in ru ral no n far m employment de clined from 32% to 22%
and that of the services mentione d ab ove declined fr om 25% to 15%. Earlier this
secto r ha s bee n considered as job genera tin g sector.
In the rural employmen t s tru ctu re the a nother no tewor thy dimension o f
changes is occupa tional s hifting among dif ferent s ocial gro ups. In 198 3 -8 4 the SC
workers who were depe ndent on Rural n on -f arm employment their total number was
20%, w hile 2009 -10 this n umber increase d and it be came 3 6% and agriculture
dependen ce of SC has become less even w hen compared to OBC 6 7.9% a nd Othe r
65.3%. However in case of the ST incre ase in Rural non - farm employment is a t a
lower pace fr om 13% to 20%. Fur ther the s hare of cons tru ctio n in total employment
profile of S.C. increased from 5.1% in 19 93 - 94 and 1 5.8% in 20 09 - 10 and in the case
of all o ther social gr oup co nstr uction co nstitu tes a much lower share in their
Table 1. Changes in the Industrial Distribution of Gross Domestic Product in India (at 2004-05 prices) (%).
Sector / Industry 1972-73 1983-84 1993-94 2004-05 2011-12
(1) (2) (3) (4) (5) (6)
Agricultural and Allied Activities
41.1 35.5 28.4 19.0 14.1
Primary Sector 41.1 35.5 28.4 19.0 14.1
Mining and quarrying 2.3 2.9 3.3 2.9 2.1
Manufacturing 13.3 14.8 14.6 15.3 15.7
Electricity, gas and water supply
1.1 1.6 2.2 2.1 1.9
Construction 7.6 6.6 6.6 7.7 7.9
Secondary Sector 24.4 25.8 26.8 27.9 27.5
Trade, hotels, and restaurants
10.5 11.8 12.6 16.1 16.9
Transport, storage and communication
4.0 5.6 5.5 8.4 10.6
Financing, real estate and business services
7.9 9.1 13.3 14.7 18.1
Community, Social and personal services
12.1 12.2 13.5 13.8 12.8
Tertiary Sector 34.5 38.7 44.8 53.0 58.4
Non-agriculture 58.9 64.5 71.6 81.0 85.9
Total 100.0 100.0 100.0 100.0 100.0
Source: Institute for Human Development (2014). India Labor and Employment Report 2014: Workers in
the Era of Globalization, Academic Foundation, New Delhi.
Table shows the 41.1%, 35.5% and 14.1% contribution of agriculture sector in the GDP of India in
1972-73, 1983-84 and 2011-12 respectively. It is reaveled from the table 24.4%, 25.8% and 27.5% contribution
of secondary sector in the GDP of India in 1972-73, 1983-84 and 2011-12 respectively. Table also shows
the 34.5%, 38.7% and 58.4% contribution of tertiary sector in the GDP of India in 1972-73, 1983-84 and
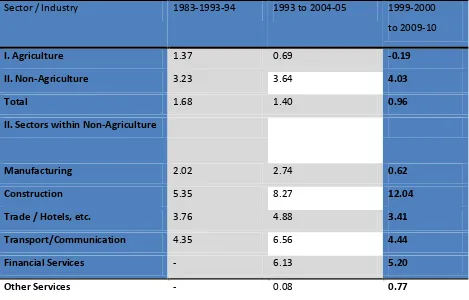
Table 2 Sectoral Growth Rates of Rural Employment (%).
Sector / Industry 1983-1993-94 1993 to 2004-05 1999-2000
to 2009-10
I. Agriculture 1.37 0.69 -0.19
II. Non-Agriculture 3.23 3.64 4.03
Total 1.68 1.40 0.96
II. Sectors within Non-Agriculture
Manufacturing 2.02 2.74 0.62
Construction 5.35 8.27 12.04
Trade / Hotels, etc. 3.76 4.88 3.41
Transport/Communication 4.35 6.56 4.44
Financial Services - 6.13 5.20
Other Services - 0.08 0.77
Source : NSSO Employment and Unemployment Surveys : 38th Round (1983), 50th Round (1993-94), 61th
Round (2004-05) and 66th Round (2009-10).
Table shows sectoral growth rates of rural employment (%). It is reaveled from the table the growth
rate of employment have been 1.37%, 0.69 and -0.19% in agriculture in 1983-1993, 1993-2004 and
2000-2010 respectively. Table shows that the growth rate of the rural employment has been 3.23%,
3.64% and 4.03% in non-agriculture sector in the 1983-1993, 1993-2004 and 2002-10 respectively.
Today is the time o f globalizatio n, wherein discussion of opp ortunities a nd the r ole
of Rural no n- farm a ctivities is on prio rity. Here the app re ciation are coupled with
upgrading of te chnol ogy, improvement in la bour pr odu ctivity and expa nding market
openings.
Finally, on the basis of empirical stu dy, so me policy inte rventions have been
suggested as strong policy supp ort towards infrastr ucture , trans por t, storage, cre dit,
and market to a ddress non farm diversificati on. There is permanan t need for creatio n
ensure the safe ty and so cial prote ction of migrant labour. S imultaneously time
capa city b uilding programmes fo r skill espe cially for females is required in or der to
enhance their skills.
In India for the few decade s rural non farm e mployment has been growing with
fast speed as a source of ru ral employment, and it is also expected tha t for few more
decades it will remaining great sour ce of rural employment. Thus it has become
necessary to a nalyse all its dimensions elab orately as the natu re of cha nges in rural
employment, str ucture variety of emerging activities, sh ift in plural activities,
specialization feature, levels of pro ductivity, earnings a nd s ustaina bility.
In rural areas of developing coun tries like India the farm size is small and
con tinues to shrink due to demograp hic pre ssure where wide range of activ ities are
of casu al and season al. In short it may be s tated tha t single source o f income is no t
References
Chand, R., PA Lakshmi Prasanna and Arana Singh (2011), “Farm size and productivity:
Understanding the strengths of smallholders and improving their livelihoods”, Economic and
Political Weekly, Vol.46, Nos. 26 and 27.
Chadha GK. 1993. Non-Farm Employment for Rural Households in India: Evidence and Prognosis.
The Indian Journal of Labour Economics, 36(3):296-327.
Jayaranjan J. 2013. A Study on the Rural Non-farm Employment in Tamil Nadu (Mimeo).
Chennai, India: Institute of Development Alternatives.
Lipton, M. (2006), “Can Small Farmers Survive, Prosper, or be the Key Channel to cut Mass
Poverty”, Journal of Agricultural and Development Economics, Vol 3, No.l, 2006, pp58-85
Rao, CH, Hanumatha (2005), Agriculture, Food security, Poverty and Environment” Oxford
University Press, New Delhi
Rao, NC and Dev, S.Mahendra (2010), Biotechnology in Indian Agriculture: Potential,
Performance and Concerns, Academic Foundation, New Delhi
Reardon, T and B. Minten (2011), “The Quiet Revolution in India’s Food Supply Chains”, IFPRI
Discussion Paper 01115, August 2011.
Reardon , T and B. Minten (2011), “Surprised by Supermarkets: Diffusion of Modern Food Retail
in India” Journal of Agribusiness in Developing and Emerging Economies 1 (2).
Sundaram, K. (2001), "Employment and Poverty in 1990s, Further Results from NSS 55th Round,
Employment-unemployment survey, 1999-00", Economic and Political Weekly, 11 August,