Article
1
Multi-Scale Computational Simulation of
2
Amorphous Silicates. Structural, Dielectric and
3
Vibrational Spectroscopic Properties
4
José Ángel Martínez-González 1,2, Javier Navarro-Ruiz 1,3 and Albert Rimola 1,*
5
1 Departament de Química, Universitat Autònoma de Barcelona, 08193 Bellaterra, Republic of Catalonia,
6
Spain; [email protected]; [email protected]
7
2 School of Biosystems and Food Engineering & School of Chemical & Bioprocess Engineering, University
8
College Dublin, Belfield, Dublin, Ireland
9
3 Institute of Chemical Research of Catalonia (ICIQ), Av. Països Catalans, 16, E-43007 Tarragona, Republic of
10
Catalonia, Spain
11
* Correspondence: [email protected]; Tel.: +34-935-812-164
12
13
Abstract: Silicates are among the most abundant and important inorganic materials, not only in the
14
Earth’s crust but also in the interstellar medium in the form of micro-/nano-particles or embedded
15
in the matrices of comets, meteorites and other asteroidal bodies. Although the crystalline phases of
16
silicates are indeed present in Nature, amorphous forms are also highly abundant. Here we report
17
a theoretical investigation of the structural, dielectric and vibrational properties of the amorphous
18
bulk for forsterite (Mg2SiO4) as a silicate test case by a combined approach of classical molecular
19
dynamics (MD) simulations for structure evolution, and periodic quantum mechanical DFT
20
calculations for electronic structure analysis. Using classical MD based on an empirical partial
21
charge rigid ionic model within a melt-quenching scheme at different temperatures performed
22
with the GULP 4.0 code amorphous bulk structures for Mg2SiO4 were generated using as initial
23
guess the crystalline phase. This has been done for bulks with three different unit cell sizes
24
adopting a super-cell approach; i.e., 1×1×2, 2×1×2 and 2×2×2. The radial distribution functions
25
indicated a good degree of amorphisation of the structures. Periodic B3LYP-geometry
26
optimizations performed with the CRYSTAL14 code on the generated amorphous systems were
27
used to analyze their structure, to calculate their high frequency dielectric constants (ε∞), and to
28
simulate the IR, Raman and reflectance spectra, which were compared with the experimental and
29
theoretical crystalline Mg2SiO4. The most significant changes of the physico-chemical properties of
30
the amorphous systems compared to the crystalline ones are presented and discussed (e.g., larger
31
deviations in the bond distances and angles, broadening of the IR bands, etc.), which are consistent
32
with their disordered nature. It is also shown that by increasing the unit cell size the bulk structures
33
present larger degree of amorphisation.
34
Keywords: DFT; periodic simulations; amorphous minerals, physico-chemical properties,
35
super-cell
36
37
1. Introduction
38
Amorphous materials are disordered solid state systems that present a lack of long-range order
39
and are thermodynamically less stable than their corresponding crystalline phases. However,
40
despite the high degree of randomness of long-range structure, they possess a more regularity in
41
their short-range structure, especially in the distribution of closest neighbors around each of the
42
component units. As a consequence of lattice distortion, amorphous materials typically have
43
different properties from their crystalline counterparts. This is the case, for instance, of silica [1].
44
Whereas crystalline silica manifests toxic effects in interaction with cellular systems [2–5],
45
amorphous silica particles show high levels of biocompatibility [6], thus allowing them to be used in
46
bioglass-based implants [7] and as drug delivery systems [8]. In other cases, because of the different
47
physico-chemical properties between the crystalline and the amorphous partners, the amorphous
48
phases are preferable to be used in semiconductor devices, such as the case of HfO2 and ZrO2 and
49
their alloys [9–11].
50
The understanding and the prediction of the physico-chemical properties of non-crystalline
51
solids rely on the proper description of their structure at the atomic level. Experimental techniques
52
with this purpose are X-ray and neutron diffraction, which are directly sensitive to the structure, and
53
also vibrational-related spectroscopies such as infrared (IR) and Raman, in which detailed structural
54
information can be achieved. However, an atomic-level understanding of amorphous materials
55
derived from these experimental methods has far remained elusive, in part because of the limited
56
capabilities of the instrumentation for direct characterization. For instance, crystalline silicates
57
exhibit a wealth of narrow IR bands [12,13], whereas for amorphous silicates these bands result in a
58
significant broadening and blending due to the wide range of bond lengths and angles characteristic
59
of the amorphous nature [14–16], Thus, deriving detailed structural information by means of these
60
experimental techniques is a daunting task. A complimentary tool to obtain atomistic details of the
61
structure of amorphous systems and its relationships with their physico-chemical features such as
62
spectral signatures is the theoretical modeling approach. However, at variance with the crystalline
63
systems, theoretical studies of the structure of amorphous materials are quite limited, probably
64
because of the difficulty in generating realistic and reliable structural models with the available
65
theoretical methods [17,18], Among the different strategies to generate bulk amorphous structures,
66
the melt and quench scheme has successfully been used to simulate different amorphous oxides
67
[11,18–26], This scheme consists of performing molecular dynamics (MD) simulations taking the
68
crystalline bulks as initial guess and submitting them in a series of heating/cooling cycles. The
69
heating at high temperatures followed by a rapid cooling allows sampling the large configurational
70
spaces and ensures a good degree of amorphization of the initial crystalline systems. However,
71
simulation of amorphous structures typically requires systems with more than 100 atoms.
72
Accordingly, despite the enormous growth in computational power, generating highly disordered
73
materials adopting the melt and quench scheme approach by means of first-principles MD
74
simulations are often prohibitively expensive, so the simulation timescales are limited to several
75
picoseconds, which are relatively short to evolve into the amorphous structures. As an alternative,
76
classical force field MD simulations are computationally less expensive, thus allowing larger
77
timescales up to several hundred picoseconds. By contrast, these classical MD simulations require
78
accurate and reliable interatomic potentials, since the results are biased by the employed force fields.
79
Proceeding this way, first-principles calculations onto the generated structural models are
80
subsequently mandatory if electronic structure and spectroscopic properties are desired.
81
In this work, we combine classical MD simulations adopting the melt and quench scheme, for
82
structural model generation, and DFT-based quantum mechanical (QM) calculations, for electronic
83
structure analysis, to theoretically study the structural, electronic and spectroscopic properties of
84
different amorphous silicate systems. Detailed analysis of the amorphous structures is carried out,
85
including the coordination number and the radial distribution function of the systems. Geometry
86
relaxations followed by calculation of the vibrational modes of the amorphous structural models
87
serve to simulate the corresponding IR, Raman and reflectance spectra at the B3LYP density
88
functional method by means of the periodic CRYSTAL14 ab-initio code [27], which in turn are
89
compared with the corresponding crystalline systems and the available experimental data.
90
Silicate-based materials constitute at ca. 95 percent of the rocks of the Earth’s crust. Silicates form a
91
class of inorganic materials with a large diversity in chemical composition and structural properties,
92
in which the Si atoms are invariably tetrahedrally coordinated by four O atoms forming the
93
orthosilicate [SiO4]4– building block. The different silicate structures are produced by linking the
94
corners of the individual [SiO4]4– units with various levels of complexity. The negative net electrical
95
charge is compensated by metal cations. The wide presence of silicates is not only limited to the
Earth’s crust; they are also main components of the solid matter present in the Universe forming part
97
in interstellar, circumstellar and interplanetary dust particles, comets, and meteorites [28–30]. The
98
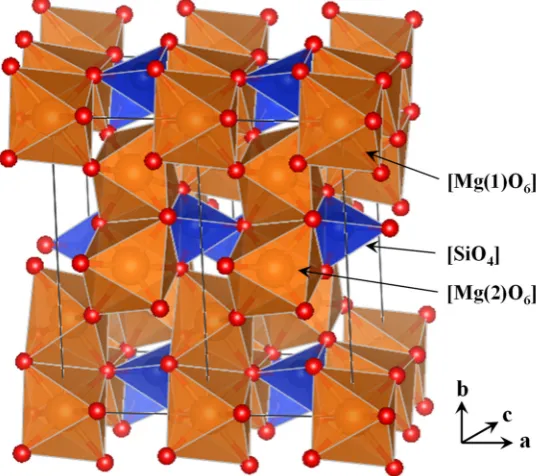
most astrophysically important silicate groups are olivines and pyroxenes, with the preponderance
99
of Mg2+ and Fe2+ as countercations since they appear with the highest cosmic abundance. Olivines are
100
characterized to have the [SiO4]4– tetrahedra linked by Mg2+ and Fe2+ and general formula
101
Mg2xFe(2−2x)SiO4 (x = 0 – 1), with the two end members named forsterite (Mg2SiO4) and fayalite
102
(Fe2SiO4), whereas pyroxenes are formed by single chains of [SiO4]4– intercalated by the divalent
103
dications and have general formula MgxFe(1−x)SiO3 (x = 0 – 1) with the two end members named
104
enstatite (MgSiO3) and ferrosilite (FeSiO3). At variance with the terrestrial silicates, cosmic silicates
105
are mainly found in an amorphous state [28,31], probably due to their exposure to various processes
106
during their life-cycle such as incidence cosmic rays and UV radiation, thermal shocks, or
107
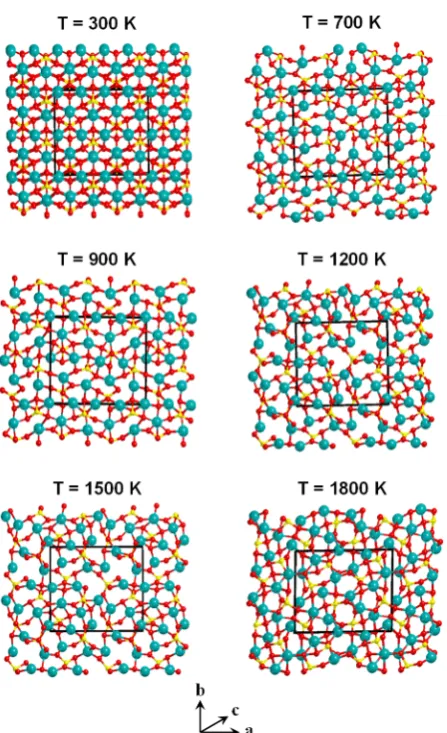
sputtering/shattering effects. Cosmic silicates play a significant role in the chemical evolution
108
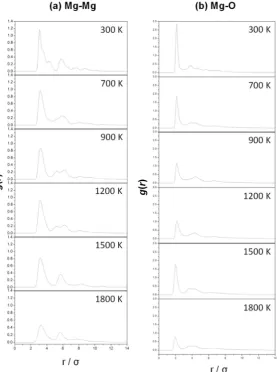
occurring in space as they provide the surfaces where important chemical reactions can take place,
109
like the formation of H2 [32] and H2O [33,34]. This work focuses on the theoretical modelling and
110
electronic structure study of amorphous Mg2SiO4. By matching the ab-initio results with the
111
observational and experimental data, relationships between the molecular structure of dust and its
112
physico-chemical features are elucidated.
113
2. Computational Methods
114
2.1. Classical Molecular Dynamics (MD) Simulations
115
The procedure to generate the amorphous silicate models is inspired with that done for
116
simulate bioglasses [18,21,25]. All models were generated by means of classical molecular dynamics
117
simulations using the atomistic Born model of solids [35] implemented in the General Utility Lattice
118
(GULP) program [36]. This model represents all ions as point charges interacting through Coulomb
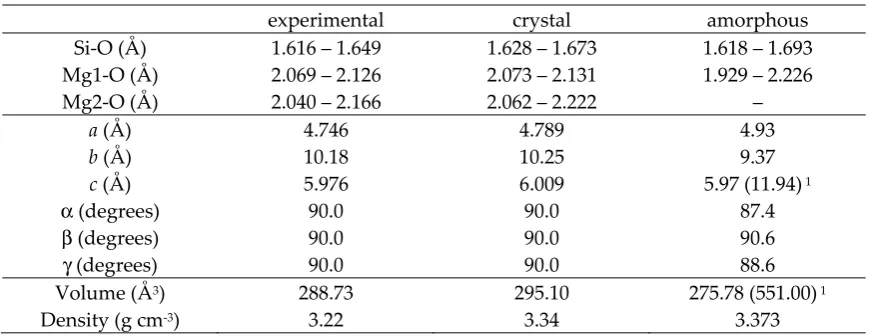
119
forces. Pairwise Buckingham potentials were used to represent Pauli-repulsion and dispersion
120
interactions, and the polarization of oxygen was represented by the shell model. All the interatomic
121
potential parameters used in this work are shown in Table 1, which were derived from these
122
references [37–39]. Moreover, the bulk structure of the crystalline Mg2SiO4 system calculated with
123
GULP using these parameters is in very good agreement with the experimental one (see Figure S1
124
and Table S1 in supplementary material, SM). The classical molecular dynamics (MD) simulations
125
were performed in the (N,V,T) canonical ensemble using the leapfrog Verlet algorithm with a 1 fs
126
integration time step. The temperature control was achieved through velocity rescaling.
127
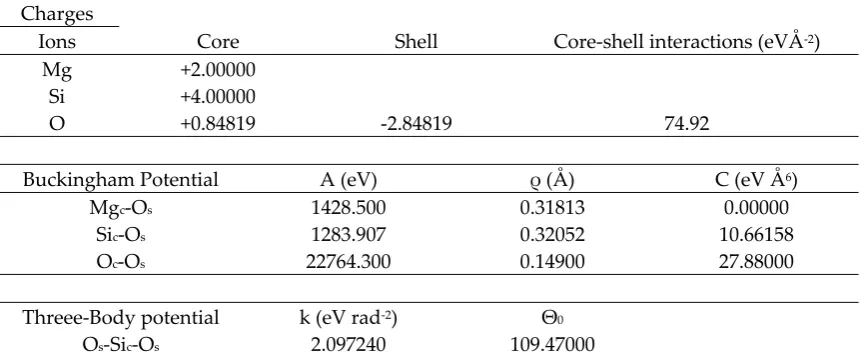
Table 1. Classical potential parameters used in this study.
128
Charges
Ions Core Shell Core-shell interactions (eVÅ-2)
Mg +2.00000 Si +4.00000
O +0.84819 -2.84819 74.92
Buckingham Potential A (eV) ρ (Å) C (eV Å6)
Mgc-Os 1428.500 0.31813 0.00000
Sic-Os 1283.907 0.32052 10.66158
Oc-Os 22764.300 0.14900 27.88000
Threee-Body potential k (eV rad-2) Θ0
Os-Sic-Os 2.097240 109.47000
129
1) Nose-Hoover thermostat. A total of 17 different final temperatures were considered, between
130
400K and 2000K, separated by 100 K each. It is worth mentioning that higher temperatures than
131
dynamic of the melting. However, we found that MD simulations at these temperatures (e.g.,
133
2500 K) the system was not stable because the interatomic potential parameters fail. After the
134
heating process, classical MD simulations at the (N,V,T) ensemble, at the given temperature,
135
were performed, which consisted of a 100 ps equilibration phase and a 200 ps production phase.
136
2) Cooling phase: After the production phase of the previous step, the resulting systems were
137
subjected to MD simulations where the temperature was decreased by 0.005 K every time-step to
138
reach the temperature of 300K. At this temperature, the systems were equilibrated during 50 ps.
139
3) Second Thermal/Production: The structures obtained after the cooling simulations were then
140
heated again to the temperature chosen in the first step. Then, MD simulations with an
141
equilibration phase of 100 ps and a production phase of 200 ps production were performed.
142
2.2. Quantum Mechanical (QM) Calculations
143
The resulting amorphous structures generated by the classical MD simulations were then
144
optimized by means of periodic quantum mechanical calculations. All these calculations were
145
performed with the periodic ab initio CRYSTAL14 code [27]. This code implements the
146
Hartree−Fock and Kohn−Sham self-consistent field method based on localized Gaussian Type
147
Orbitals (GTO) for periodic systems.
148
The multielectron wave function is described by linear combination of crystalline orbitals,
149
which in turn are expanded in terms of GTO basis sets. Specifically, oxygen, magnesium, silicon, and
150
iron were described by (8s)-(411sp)-(1d), (8s)-(511sp)-(1d), (8s)-(6311sp)-(1d), and (8s)-(64111sp)-(1d)
151
contractions, respectively. All the SCF calculations and geometry optimizations were performed
152
with the B3LYP [40,41] density functional method. Geometry optimizations have been performed in
153
P1 group symmetry (no symmetry), in order to ensure the maximum degrees of freedom during the
154
optimization. Both lattice constants and internal coordinates have been simultaneously optimized
155
within the same run, using analytical gradients and upgrading the numerical Hessian with the
156
Broyden−Fletcher−Goldfarb−Shanno (BFGS) algorithm [42]. These methods were already used in
157
previous works focused on the crystalline forsterite [43–45] and fayalite bulk properties [46].
158
Default values of the tolerances that control the Coulomb (6 6) and exchange (6 6 16) series have
159
been adopted. This means that when the overlap between two atomic orbitals is smaller than 10−6
160
(for Coulomb) and 10−16 (for exchange) the integral is either approximated or disregarded. The
161
Hamiltonian matrix has been diagonalized in 63 reciprocal lattice points (k points) to sample the
162
Brillouin zone, corresponding to a shrinking factor of 5 [47]. Open-shell calculations were based on
163
an unrestricted formalism.
164
Phonon frequencies of the considered systems have been calculated as the eigenvalues obtained
165
by diagonalizing the mass-weighted Hessian matrix at Γ point (point k = 0 in the first Brillouin zone,
166
called the central zone). The mass-weighted Hessian matrix was obtained by numerical
167
differentiation (central-difference formula) of the analytical first energy derivatives, calculated at
168
geometries obtained by displacing, in turn, each of the 3N equilibrium nuclear coordinates by a
169
small amount, u = 0.003 Å. We refer to this work [48] for a complete discussion of the computational
170
conditions and other numerical aspects concerning the calculation of the vibrational frequencies at
171
the Γ point. The value of the infrared intensity for each normal mode was also computed via the
172
dipole moment variation along the normal mode adopting the set of localized Wannier functions
173
[49–51], whereas Raman intensities were calculated analytically through the coupled-perturbed
174
Hartree-Fock (CPHF) scheme implemented in CRYSTAL [52,53] and successfully performed for
175
different crystalline minerals [54–62]. Reflectance spectra (R(ν)) of the silicate systems were
176
simulated by combining different ingredients available in the code: i) calculation of the vibrational
177
modes, their corresponding intensities, and separation of the transverse and longitudinal optical (TO
178
and LO, respectively) modes [48, 63], ii) calculation of the high frequency dielectric tensor (ε∞) (ref.
179
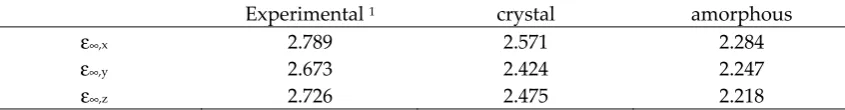
[58−61]) contributing to the frequency-dependent complex dielectric function (ε(ν)) [52,53,64,65], and
180
iii) calculation of the mass-weighted effective mode Born charges [66–68]. Reflectance spectra of
181
several crystalline mineral systems have successfully been simulated [44–46, 69–71].
3. Results and Discussion
183
This section is organized as follows. The first part addresses the generation of an amorphous
184
structure of forsterite (Mg2SiO4) bulk by means of classical MD simulations and subsequently
185
optimized at a quantum chemical level. A structural analysis of the optimized structure is presented
186
and investigations on its dielectric and vibrational properties by calculating the high frequency
187
dielectric constants and simulating the infrared, Raman and reflectance spectra are shown, which in
188
turn are compared with the experimental and theoretical crystalline Mg2SiO4 data. The second part is
189
focused on the influence of the unit cell size of the amorphous Mg2SiO4 bulk on the structural,
190
dielectric and vibrational properties.
191
3.1. The Amorphous 1×1×2 Super-Cell Mg2SiO4 System
192
As mentioned in Computational Methods, the initial guess to generate the amorphous Mg2SiO4
193
bulk structure (hereafter referred to as Fo) was the Mg2SiO4 crystalline system. The bulk crystal
194
structure of Mg2SiO4 consists of distorted SiO4 tetrahedra and MgO6 octahedra, in which the
195
tetrahedra and octahedra share the vertices (see Figure 1). Half of the available octahedral voids are
196
occupied by the divalent cations. This crystal system has two symmetry-independent Mg atoms,
197
named Mg1 and Mg2. The Mg1-centered octahedra share edges forming rods parallel to the
198
crystallographic c axis, and the Mg2 octahedra are laterally linked to these rods through the
199
corresponding edges (shown in Figure 1).
200
201
Figure 1. View (along the c crystallographic axis) of the crystal structure of forsterite. The two
202
symmetry-independent Mg atoms are indicated according to the octahedral units [Mg(1)O6] and
203
[Mg(2)O6] (in brown). The tetrahedral [SiO4] unit blocks (in blue) are also indicated. O atoms are in
204
red.
205
Classical MD simulations at different temperatures adopting the procedure described in
206
Computational Methods were executed to amorphize the structure of crystalline Mg2SiO4. As the
207
unit cell is relatively small (Pbnm space symmetry with lattice parameters of a = 4.79 Å, b = 10.19 Å,
208
and c = 5.85 Å), in this part, a larger unit cell has been adopted by doubling the c lattice parameter to
209
favor an easier amorphization of the structure (hereafter referred to as 1×1×2). In the next section, a
210
detailed analysis of the effect of the unit cell size in the physico-chemical properties of the
211
amorphous structures is presented. Figure 2 shows the resulting structures at the end of the classical
212
MD simulations run at the different temperatures. As one can see, the initial crystallinity becomes
lost when increasing the temperatures. Figure 3 shows the pair-correlation functions, g(r), for the Mg
214
atoms with either the neighboring Mg atoms (a, Mg-Mg) or the O atoms (b, Mg-O) derived from the
215
classical MD simulations at T = 300, 700, 900, 1200, 1500, and 1800 K. At 300 K, the g(r) functions
216
present a first sharp peak, followed by a subset of lower well-defined peaks, in agreement with the
217
crystalline nature of Fo at this temperature. The first peak is representative of the Mg-Mg and Mg-O
218
lengths of the first shell, while the others represent the distribution of the Mg-Mg and Mg-O
219
distances of the outer shells. An increase of the temperature produces a broader profile of g(r), in
220
which the first peak loses significantly the intensity while the others overlap each other up to a point
221
where at high temperatures only two broad peaks are appreciable. These changes clearly indicate
222
that a progressive loss of crystallinity occurs upon temperature increase.
223
224
Figure 2. Structures obtained by classical molecular dynamics (MD) simulations. For all simulations,
225
the initial guess structure was the crystal system. It was initially heated up to the given temperature
226
Figure 3. Mg-Mg (a) and Mg-O (b) pair correlation functions derived from the MD simulations ate
228
the different temperatures.
229
As the structure generated at T = 1800 K is the most disordered one, this was chosen to study at
230
the DFT level the structural and vibrational properties. Figure 4 shows the initial (crystalline) and
231
the final (amorphous) structures optimized at the B3LYP theory level. It is also worth mentioning
232
that those structures generated between 400 and 1600 K collapsed onto the crystal system upon
233
optimization, whereas those between 1700 and 2000 K remained as amorphous structures. Table 2
234
shows the B3LYP-optimized lattice parameters and the range of the calculated Mg-O and Si-O bond
235
lengths of amorphous Fo, as well as the volume and the density. For comparison, Table 2 also
236
presents the same parameters for Fo crystal (experimental and calculated). In addition to the
237
systematic larger values provided by the calculated values for the crystal system, results indicate
238
that the range of values of the amorphous system is larger than the crystal ones. This is indicative
239
that the B3LYP-optimized amorphous Fo presents a larger distribution of bond lengths characteristic
240
of the amorphous materials. It is worth mentioning that due to the disorganization of the internal
241
atomic positions in the amorphous Fo, classifying the Mg atoms in Mg1 and Mg2 is not possible. The
242
cell parameters of the amorphous Fo experiencing more variation compared to the crystalline values
243
are a and b; i.e., the former is about 0.2 Å larger while the later 0.8 Å shorter. Calculated lattice angles
244
are also somewhat different, which essentially deviate of the ideal 90 degrees. Because of the
245
significant shortening of the b cell parameter, the volume of the amorphous Fo is smaller than the
246
crystal volumes. The fact that the density of the crystalline systems is higher than the amorphous
247
one is also indicative of the amorphisation of the system. Indeed, bearing in mind that amorphous
materials are characterized by a random structure and poor order giving rise to the presence of
249
porous, the density of amorphous materials is lower than the crystalline analogues.
250
251
Figure 4. B3LYP-optimized structures of the bulk structure of Mg2SiO4 in the crystal form (left) and in
252
an amorphous form generated by classical MD simulations at T = 1800 K. Unit cells are shown in
253
black.
254
Table 2. Cell parameters and bond distance ranges of the Mg2SiO4 bulk structures: experimental
255
values of the crystal system and B3LYP-optimized values of the crystal and amorphous systems.
256
Calculated volume and densities derived from the B3LYP-optimized geometries are also shown.
257
experimental crystal amorphous Si-O (Å) 1.616 – 1.649 1.628 – 1.673 1.618 – 1.693
Mg1-O (Å) 2.069 – 2.126 2.073 – 2.131 1.929 – 2.226 Mg2-O (Å) 2.040 – 2.166 2.062 – 2.222 –
a (Å) 4.746 4.789 4.93
b (Å) 10.18 10.25 9.37
c (Å) 5.976 6.009 5.97 (11.94) 1 α (degrees) 90.0 90.0 87.4
β (degrees) 90.0 90.0 90.6
γ (degrees) 90.0 90.0 88.6
Volume (Å3) 288.73 295.10 275.78 (551.00) 1
Density (g cm-3) 3.22 3.34 3.373 1 Because of the enlargement of the unit cell along the c axis (see text), for a proper comparison, bare values were
258
derived from the actual calculated values (values in parenthesis).
259
In order to understand the nature of the amorphisation of the silicate material, we examined the
260
deviation of the internal O-Si-O and O-Mg-O angles of the optimized system with respect to the
261
ideal values (reported in Table 3). These values reveal that the O-Mg-O angle presents the largest
262
deviation (≈ 15.3 %) and therefore the distortion of these angles contributes significantly to the
263
amorphous nature. However, the deviation of the O-Si-O angle is not contemptible (≈ 6.5 %) so the
264
distortion of these angles also contributes by some amount to the internal atomic disorder.
265
The high frequency dielectric constants (ε∞) were also calculated using the CPKS scheme
266
implemented in the CRYSTAL code. Results are shown in Table 4, in which the ε∞ values along the x,
267
y and z direction of the amorphous Fo are compared with the experimental and calculated ones for
268
Fo crystal. For the crystal systems ε∞ is notably symmetric, the values slightly differing as a function
269
of the direction; i.e., both experimental [72] and calculated values give ε∞,x as the largest value
270
whereas the shortest on ε∞,y, with a difference of 0.12 – 0.15 units. In contrast, for amorphous Fo, the
271
difference between the largest and the smallest ε∞ values, which now correspond to ε∞,x and ε∞,z,
272
respectively, is a meager 0.07 units. This is consistent with the disordered nature of amorphous Fo,
273
since the direction-dependency of ε∞ usual in crystalline systems is partially lost.
Table 3. Mean values and the corresponding average deviations (with respect to the ideal value) of
275
the O-Si-O and O-Mg-O angles of the optimized amorphous 1×1×2, 2×1×2 and 2×2×2 Mg2SiO4
276
systems.
277
Angle (degrees)
Ideal value
Mean value ± standard deviation [average deviation]
1×1×2 2×1×2 2×2×2 O-Si-O 110.0 109.5 ± 7.2
[6.53 %]
108.9 ± 12.4 [11.3 %]
104.9 ± 12.8 [11.6 %] O-Mg-O 90.0 94.7 ± 13.8
[15.3 %]
100.9 ± 22.1 [24.6 %]
104.1 ± 16.5 [18.3 %]
Table 4. High frequency dielectric constants (ε∞) for the Mg2SiO4 bulk structures along the x, y and z
278
directions: experimental values of the crystal system and B3LYP-optimized values of the crystal
279
and amorphous systems.
280
Experimental 1 crystal amorphous
ε∞,x 2.789 2.571 2.284
ε∞,y 2.673 2.424 2.247
ε∞,z 2.726 2.475 2.218
1 From ref. [72]
281
Crystalline Fo has an orthorhombic structure. It presents 28 atoms in the unit cell (six
282
symmetry-independent atoms), which give rise to four formula units per cell. Their symmetry
283
decomposition corresponds to Γtotal = 11Ag + 11B1g + 7B2g + 7B3g + 10Au + 10B1u + 14B2u + 14B3u, in which
284
the three B1u, B2u and B3u correspond to rigid transitions and the remaining modes are vibrations that
285
can be classified as: 35 IR active modes (9B1u + 13B2u + 13B3u), 36 Raman active modes (11Ag + 11B1g +
286
7B2g + 7B3g), and 10Au inactive modes. In previous works, mode classification and band assignments
287
of crystaline Fo have exhaustively been discussed by means of infrared, Raman, and reflectance
288
spectroscopic measurements [13, 73−80]. In this part, we focus our attention on the most important
289
changes due to the amorphisation of the crystal system. Figure 5 shows the B3LYP-simulated IR
290
spectrum of amorphous Fo (a), where for comparison, the B3LYP-simulated (b) and the
291
experimental (c) IR spectra for the crystal systems are also shown. The simulated spectra were
292
broadened by Lorentzian functions with a typical width δν = 20 cm-1, which is comparable with the
293
bandwidth of the experimental IR spectrum. For crystal Fo, the experimental and theoretical
294
vibrational IR and Raman spectra compare fairly well. In the IR case, both spectra present a wealth
295
of narrow bands in agreement with their crystalline nature. As already described by some of us and
296
by other colleagues, B3LYP frequencies reproduce very well the experimental IR values (for more
297
details see ref. [43,81]). Figure 6 shows the B3LYP-simulated Raman spectrum of amorphous (a) and
298
crystal (b) Fo and Table 5 reports the calculated Raman active frequencies (classified by their
299
symmetry) with the corresponding intensity of the crystalline system, which are compared with
300
those measured experimentally (including frequency deviations). In the Raman case, B3LYP
301
reproduces quite well the experimental Raman data, with a mean average deviation of 24.9 – 34.6
302
cm-1 and a largest deviation of 81 – 82 cm-1. Remarkably, for the calculated two most intense Raman
303
peaks (i.e., at 848 and 883 cm-1) the deviations compared to the corresponding experimental values
304
Figure 5. B3LYP-simulated IR spectra of the amorphous (a) and crystalline forsterite (b). The
306
experimental spectrum of the crystalline forsterite is also included (c).
307
Table 5. Active Raman frequencies (ν, in cm-1) calculated in this work and their comparison with the
309
experimental data. The shifts between the calculated and the experimental values (Δν) are also
310
provided.
311
N This work Ref. [77] Ref. [75] Ref. [74] Ref. [73]
ν I (%) ν Δν ν Δν ν Δν ν Δν Ag 1 212 0.05 184 28 183 29 183 29 183 29
2 261 0.08 227 34 226 35 227 34 227 34 3 351 0.11 304 47 304 47 305 46 305 46 4 367 1.20 329 38 329 38 329 38 329 38 5 391 0.78 339 52 332 59 340 51 340 51 6 474 0.62 421 53 422 52 424 50 424 50 7 608 12.4 544 64 545 63 546 62 545 63 8 675 22.2 608 67 608 67 609 66 609 66 9 848 81.1 824 24 824 24 826 22 826 22 10 883 100 856 27 856 27 856 27 856 27 11 999 20.6 966 33 965 34 966 33 966 33 B1g 12 253 0.00 - - 220 33 224 29 197 56
13 294 0.06 - - 274 20 260 34 265 29 14 361 1.05 316 45 318 43 318 43 317 44 15 417 1.68 - - 351 66 - - - - 16 420 0.38 - - 383 37 418 2 418 2 17 489 2.21 434 55 434 55 434 55 434 55 18 658 1.39 588 70 582 76 585 73 583 75 19 713 0.43 - - 632 81 632 81 632 81 20 869 1.28 838 31 838 31 839 30 839 30 21 897 3.37 866 31 866 31 866 31 866 31 22 1012 0.37 - - 975 37 976 36 976 36 B2g 23 - - - 175 - 142 - - -
24 229 0.01 243 -14 242 -13 244 -15 244 -15 25 343 0.17 - - 323 20 324 19 324 19 26 365 0.08 - - 365 0 368 -3 365 0
27 431 2.93 - - - 407 24 28 463 0.69 434 29 439 24 441 22 438 25 29 665 14.3 588 77 586 79 588 77 585 80 30 956 6.98 882 74 881 75 884 72 881 75 B3g 31 203 0.00 243 -40 - - 226 -23 - -
32 296 0.00 - - 286 10 272 24 - - 33 - 316 - 315 - 318 - 314 - 34 369 0.31 373 -4 374 -5 376 -7 374 -5 35 413 1.35 409 4 410 3 412 1 406 7 36 - - - 435 - - - 466 - 37 514 3.34 - - - 484 30 38 670 2.82 588 82 592 78 595 75 591 79 39 908 5.14 920 -12 920 -12 922 -14 920 -12
312
More interesting are the differences between the B3LYP-simulated crystalline and amorphous
313
IR and Raman spectra. Crystal Fo presents a set of well-defined bands, in which the total active
314
vibrations are not fully visualized in the form of bands because some are either overlapped with
315
contiguous bands or present very low intensities. The spectra of amorphous Fo are clearly different;
316
that is, they are based on single broad bands. In particular, the IR and Raman spectra of amorphous
317
Fo present three and two well-defined zones, respectively: for IR, one band between 1000 – 800 cm-1,
318
800 cm-1 and between 700 – 400 cm-1. These regions correspond essentially to the Si-O stretching and
320
O-Si-O bending vibrations, respectively. However, vibrations associated with rotations of the SiO4
321
tetrahedra and translations of Mg2+ also contribute in the low region of the lower bands. The
322
significant broadening and blending of the IR bands presented by amorphous Fo compared to the
323
crystal systems is due to the wider and more diverse distribution of bond lengths and angles given
324
in the former system, which is typical in amorphous materials. In fact, the hyperfine structure of the
325
IR spectra of amorphous Fo (built by bands consisting of single lines) present a great number of
326
active vibrational bands that, upon imposing band width, overlap each other rendering
327
squat-shaped bands. The presence of more active vibrational bands compared to the crystal system
328
is mainly due to the lack of symmetry in amorphous Fo. This produces that some vibrations that are
329
inactive in the crystal system by selection rules are active in the amorphous one. Moreover, the cell
330
enlargement produces that equivalent vibrations by the translational symmetry in the minimal unit
331
cell are different in the super cell, giving rise to the apparition of new vibrational bands.
332
Astronomical IR and Raman measurements of cosmic silicates revealed that they are mainly in an
333
amorphous state. The recorded spectra generally present two single broad bands at about 1000 cm-1
334
and 550 cm-1 associated with the Si-O stretching and O-Si-O bending vibrations, respectively [28].
335
Our simulated vibrational results of the amorphous Fo are thus in line with the astronomical IR and
336
Raman spectral features.
337
As anticipated in Computational Methods, the reflectance spectrum of a given 3D-periodic
338
system can be simulated with the CRYSTAL code. An important ingredient for the construction of
339
the reflectance curves is ε∞, whose values are discussed above. The B3LYP-simulated reflectance
340
spectra of Fo, both crystalline and amorphous, are shown in Figure 7. The reflectivity is separated
341
according to the three crystallographic axes (a, b and c), which for the crystal system are coincident
342
with the vibration symmetry (B3u, B2u and B1u, respectively). The topology of the simulated reflection
343
curves of crystalline Fo perfectly matches with the experimental ones. A detailed analysis of the
344
effect of different fitting procedures to properly reproduce the experimental reflectance spectra is
345
provided in ref. [45]. The B3LYP-simulated reflectance spectra of amorphous Fo is significantly
346
different. The broad reflectance curves of the crystalline system are sharper and present more bands.
347
This is, in line to what is mentioned above, due to the more number of active vibrational modes in
348
the amorphous systems.
349
350
Figure 7. B3LYP-simulated Raman spectra of the crystalline and amorphous forsterite along the a, b
351
3.2. Unit Cell Size Effects in the Amorphisation of the Mg2SiO4 System
353
This section reports the results related to the physico-chemical properties of amorphous
354
Mg2SiO4 adopting different super-cell sizes; namely, 1×1×2, 2×1×2 and 2×2×2. The procedure to
355
amorphize the corresponding crystalline systems was the same to that presented in the previous
356
section; that is, classical MD simulations at 1800 K followed by B3LYP optimization of the resulting
357
geometry to carry out the theoretical analysis. For all super-cell systems the Mg-Mg and Mg-O g(r)
358
pair correlation functions are similar, showing several broad but distinguishable bands representing
359
the different Mg-Mg and Mg-O shells (see Figure S2 of SM). The similarity between the band widths
360
of the different super-cell systems indicate that for all cases the amorphisation was definitely
361
achieved.
362
The B3LYP-optimized structures of the different super-cell systems are shown in Figure 8, both
363
in their atomistic and polyhedral forms. Table 6 presents the B3LYP-calculated lattice parameters,
364
the range of the calculated Mg-O and Si-O bond lengths, the volume and the density of the bulk
365
materials. In Table 3, the mean values and the associated deviations of the internal O-Si-O and
366
O-Mg-O angles compared to the ideal values are also reported for the 2×1×2 and 2×2×2 systems. By
367
visual inspection of the images of Figure 8, one can identify that the larger the super-cell size, the
368
more distorted the tetrahedral SiO4 and octahedral MgO6 building blocks. This larger distortion is
369
also reflected by the mean values and the average deviations of the internal angles. In the 2×1×2 and
370
2×2×2 super-cell systems they are larger than in the 1×1×2 one. In addition to this, a careful visual
371
inspection of the atomistic structure of the amorphous systems, we realized that some “rare”
372
structural motifs are present in the 2×1×2 and 2×2×2 systems, which are absent in the 1×1×2 one. In
373
particular: i) pentacoordinated Si atoms (SiO5 adopting a trigonal pyramid-like geometry), ii)
374
pentacoordinated Mg atoms (MgO5 adopting either square-pyramid- or trigonal pyramid-like
375
geometries), and iii) tetracoordinated Mg atoms (MgO4 adopting highly distorted tetrahedral
376
geometries). These motifs are more common in the 2×2×2 super-cell systems than in the 2×1×2 one.
377
The presence of these structural motifs is indicative that the degree of amorphisation is higher in
378
these systems.
379
The calculated densities are reported in Table 6 and indicate that they decrease when the sizes
380
of the super-cell increase; i.e., 3.373 g cm-3 (1×1×2) > 3.214 g cm-3 (2×1×2) > 3.172 g cm-3 (2×2×2). This is
381
consistent with the fact that the larger the super-cell size, the larger the amorphous nature of the
382
system. Indeed, by increasing the size of the super-cell, the structures can sport more defects and
383
more porosity and consequently the density is lower. The calculated ε∞ constants along the x, y and z
384
directions (reported in Table 7) points out in the same direction. An increment of the super-cell size
385
leads to a less dependency along the direction of the ε∞ values as a consequence of the larger degree
386
of disorder, which is equal along the three directions.
387
In relation to the vibrational properties, Figure 9 shows the simulated IR (a), Raman (b) and
388
reflectance spectra (c). As mentioned above, the 1×1×2 system presents three and two well-defined
389
broad IR and Raman bands, respectively. In contrast, the IR spectrum of the 2×2×2 system presents
390
two largely broad bands; that is, the two bands in the low-frequency region of the 1×1×2 system
391
overlap in the 2×2×2 system. Similar changes occur in the Raman spectrum, the two regions present
392
in the 1×1×2 system become fused in the 2×2×2 system. The IR and Raman spectra of the 2×1×2
393
system present intermediate profiles between those of the 1×1×2 and the 2×2×2 systems. That is, the
394
different frequency regions clearly identified in the 1×1×2 system are still identifiable but more
395
diffusely. A similar transition in the topology of the reflectance spectra can be observed from the
396
1×1×2, 2×1×2 to the 2×2×2 systems. In this case, an increase of the unit cell size leads to spectra that
397
present sharper and more bands due to the major number of independent active bands. All these
398
changes in the topology of the vibrational-related spectra clearly indicate that there is a progressive
399
increase of the amorphous nature from the 1×1×2 to the 2×2×2 super-cell systems.
Figure 8. B3LYP-optimized structures of the bulk structures of Mg2SiO4 adopting the 1×1×2, 2×1×2
401
and 2×2×2 super-cells generated by classical MD simulations at T = 1800 K, both in the atomistic
402
Table 7. Calculated high frequency dielectric constants (ε∞) for the B3LYP-optimized 1×1×2, 2×1×2
404
and 2×2×2 Mg2SiO4 bulk structures along the x, y and z directions.
405
1×1×2 2×1×2 2×2×2
ε∞,x 2.284 2.153 2.148
ε∞,y 2.247 2.161 2.135
ε∞,z 2.218 2.168 2.132
406
Figure 9. B3LYP-simulated Infrared (A) Raman (B) and Reflectance along the a, b and c directions (C)
407
4. Conclusions
409
By combining classical MD simulations with periodic DFT calculations, a detailed theoretical
410
study on the structural, dielectric and vibrational properties of Mg2SiO4 as a silicate test case has
411
been presented. The amorphous structures for Mg2SiO4 have been generated using classical MD
412
simulations at different temperatures within a melt and quench scheme tacking as the initial guess
413
structure the crystalline phase. Periodic B3LYP calculations have been carried out to optimize the
414
geometries of the generated structure and calculate their high frequency dielectric constants and
415
simulate the IR, Raman and reflectance spectra. The most interesting points emerging from this
416
work are:
417
• The Mg-Mg and Mg-O pair correlation functions g(r) derived from the classical MD simulations
418
indicate that an increase of the temperature produces broader profiles of g(r) indicating a
419
progressive loss of crystallinity with temperature.
420
• B3LYP-optimized geometries of the amorphous bulk systems present larger distributions of
421
bond lengths and angles than the crystal analogues due to the significant disorganization of the
422
internal atomic positions. Consequently, the tetrahedral SiO4 and octahedral MgO6 motifs
423
become largely distorted, which is characteristic of the amorphous materials. Calculated
424
densities of the amorphous bulks are lower than the crystalline one due to the presence of
425
internal cavities produced during the amorphisation process.
426
• Calculated high frequency dielectric constants along the x, y and z directions (ε∞,x, ε∞,y and ε∞,z),
427
while in the crystalline Mg2SiO4 they are clearly different in agreement with the direction
428
dependency caused by the inherently crystallinity of the system, in the amorphous phases they
429
are more similar, showing a convergence between the calculated ε∞,x, ε∞,y and ε∞,z values.
430
Accordingly, ε∞ values do not depend on a particular direction because the system is likewise
431
disordered in all the directions.
432
• While the IR and Raman spectra of the crystalline phase present well-defined narrow bands, the
433
spectra of the amorphous-analogues, due to the wider and more diverse distribution of lengths
434
and angles, are dominated by broader bands caused by multiple bands overlapping. The
435
simulated spectra agree fairly well with those recorded for Mg2SiO4 in astrophysical
436
environments. For the reflectance spectra, the broad reflectance curves of the crystalline system
437
change by sharper and more bands for the amorphous systems, due to the presence of more
438
number and active modes.
439
• In relation to the effect of the unit cell size, results provide clear evidence that an increase of the
440
unit cell size infers a larger degree of amorphisation due to the presence of more internal
441
degrees of freedom to be disordered.
442
Our results indicate that the combined approach of classical MD for structure evolution and
443
quantum chemical DFT for electronic structure analysis is a reliable technique to investigate the
444
physico-chemical properties of silicates.
445
Supplementary Materials: The following are available online, Figure S1: GULP-optimized structure for the
446
bulk of the crystal Mg2SiO4. View of the unit cell (left), view of the extended periodic system (right), Figure S2:
447
Mg-Mg (a) and Mg-O (b) pair correlation functions derived from the classical MD simulations for the 1×1×2,
448
2×1×2 and 2×2×2 systems. Table S1: Bond distance ranges of the (1×1×1) Mg2SiO4 bulk structures: experimental,
449
GULP-optimized and B3LYP optimized values. Cell parameters and fractionary coordinates of the optimized
450
systems.
451
Author Contributions: “Conceptualization, A.R.; Methodology, Software, Validation, Formal Analysis,
452
Investigation, Resources, and Data Curation, J.A.M.-G. and J.N.-R; Writing-Original Draft Preparation,
453
Writing-Review & Editing, and Visualization, J.A.M.-G. and A.R.; Supervision, Project Administration and
454
Funding Acquisition, A.R.
455
Funding: This research was funded by MINECO (Projects CTQ2014-60119-P and CTQ2017-89132-P) and DIUE
456
(Projects 2014SGR482 and 2017SGR1320).
457
Acknowledgments: A.R. is indebted to “Ramón y Cajal” program. J.A.M.-G is indebted to “Europa Excelencia”
458
Conflicts of Interest: The authors declare no conflict of interest. The funders had no role in the design of the
460
study; in the collection, analyses, or interpretation of data; in the writing of the manuscript, and in the decision
461
to publish the results.
462
463
References
464
1. Rimola, A.; Costa, D.; Sodupe, M.; Lambert, J.-F.; Ugliengo, P. Silica Surface Features and Their Role in the
465
Adsorption of Biomolecules: Computational Modeling and Experiments. Chem. Rev. 2013, 113, 4216-4313.
466
2. Fubini, B.; Otero Arean, C. Chemical Aspects of the Toxicity of Inhaled Mineral Dusts. Chem. Soc. Rev.
467
1999, 28, 373-381.
468
3. Fenoglio, I.; Prandi, L.; Tomatis, M.; Fubini, B. Free Radical Generation in the Toxicity of Inhaled Mineral
469
Particles: The Role of Iron Speciation at the Surface of Asbestos and Silica. Redox Rep. 2001, 6, 235-241.
470
4. Otero Areán, C.; Barceló, F.; Fenoglio, I.; Fubini, B.; Llabrés i Xamena, F.X.; Tomatis, M. Free Radical
471
Activity of Natural and Heat Treated Amphibole Asbestos. J. Inorg. Chem. 2001, 83, 211-216.
472
5. Turci, F.; Colonna, M.; Tomatis, M.; Mantegna, S.; Cravotto, G.; Gulino, G.; Aldieri, E.; Ghigo, D.; Fubini, B.
473
Surface Reactivity and Cell Responses to Chrysotile Asbestos Nanofibers. Chem. Res. Toxicol. 2012, 25,
474
884-894.
475
6. Merget, R.; Bauer, T.; Küpper, H.; Philippou, S.; Bauer, H.; Breitstadt, R.; Bruening, T. Health Hazards due
476
to the Inhalation of Amorphous Silica. Arch. Toxicol. 2002, 75, 625-634.
477
7. Hench, L.L.; Polak, J.M. Third-Generation Biomedical Materials. Science 2002, 295, 1014-1017.
478
8. Vallet-Regí, M.; Balas, F.; Arcos, D. Mesoporous Materials for Drug Delivery. Angew. Chem. Int. Edit.
479
2007, 46, 7548-7558.
480
9. Ceresoli, D.; Vanderbilt, D. Structural and Dielectric Properties of Amorphous ZrO2 and HfO2. Phys. Rev.
481
B 2006, 74, 125108.
482
10. 1Zhao, X.; Ceresoli, D.; Vanderbilt, D. Structural, Electronic, and Dielectric Properties of Amorphous ZrO2
483
from Ab Initio Molecular Dynamics. Phys. Rev. B 2005, 71, 085107.
484
11. Wang, Y.; Zahid, F.; Wang, J.; Guo, H. Structure and Dielectric Properties of Amorphous High-k oxides:
485
HfO2, ZrO2, and their Alloys. Phys. Rev. B 2012, 85, 224110.
486
12. Madon, M.; Price, G.D. Infrared Spectroscopy of the Polymorphic Series (Enstatite, Ilmenite, and
487
Perovskite) of MgSiO3, MgGeO3, and MnGeO3. J. Geophys. Res. Solid Earth 1989, 94, 15687-15701.
488
13. Hofmeister, A.M. Single-Crystal Absorption and Reflection Infrared Spectroscopy of Forsterite and
489
Fayalite. Phys. Chem. Miner. 1987, 14, 499-513.
490
14. Jäger, C.; Molster, F.J.; Dorschner, J.; Henning, T.; Mutschke, H.; L.B.F.M.Waters Steps toward interstellar
491
silicate mineralogy IV. The crystalline revolution. Astron. Astrophys. 1998, 339, 904-916.
492
15. Henning, T.; Mutschke, H. Low-Temperature Infrared Properties of Cosmic Dust Analogues. Astron.
493
Astrophys. 1997, 327, 743-754.
494
16. Fabian, D.; Jäger, C.; Henning, T.; Dorschner, J.; Mutschke, H. Steps toward interstellar silicate mineralogy
495
V. Thermal evolution of amorphous magnesium silicates and silica. Astron. Astrophys. 2000, 364, 282-292.
496
17. Billinge, S.J.L.; Levin, I. The Problem with Determining Atomic Structure at the Nanoscale. Science 2007,
497
316, 561-565.
498
18. Tilocca, A. Current Challenges in Atomistic Simulations of Glasses for Biomedical Applications. Phys.
499
Chem. Chem. Phys. 2014, 16, 3874-3880.
500
19. Umari, P.; Pasquarello, A. Infrared and Raman Spectra of Disordered Materials from First Principles.
501
Diam. Relat. Mater. 2005, 14, 1255-1261.
502
20. Kroll, P. A DFT Study of Amorphous Silicon Oxynitride. J. Non-Cryst. Solids 2005, 351, 1127-1132.
503
21. Corno, M.; Pedone, A.; Dovesi, R.; Ugliengo, P. B3LYP Simulation of the Full Vibrational Spectrum of 45S5
504
Bioactive Silicate Glass Compared to v-Silica. Chem. Mater. 2008, 20, 5610-5621.
505
22. Karazhanov, S.Z.; Kroll, P.; Holt, A.; Bentzen, A.; Ulyashin, A. Comparative Analysis of Electronic
506
Structure and Optical Properties of Crystalline and Amorphous Silicon Nitrides. J. Appl. Phys. 2009, 106,
507
053717.
508
23. Bondi, R.J.; Lee, S.; Hwang, G.S. First-Principles Study of the Mechanical and Optical Properties of
509
Amorphous Hydrogenated Silicon and Silicon-Rich Silicon Oxide. Phys. Rev. B 2010, 81, 195207.
510
24. Lee, S.; Bondi, R.J.; Hwang, G.S. Ab Initio Parameterized Valence Force Field for the Structure and
511
25. Berardo, E.; Pedone, A.; Ugliengo, P.; Corno, M. DFT Modeling of 45S5 and 77S Soda-Lime
513
Phospho-Silicate Glass Surfaces: Clues on Different Bioactivity Mechanism. Langmuir 2013, 29, 5749-5759.
514
26. Landmann, M.; Köhler, T.; Rauls, E.; Frauenheim, T.; Schmidt, W.G. The Atomic Structure of Ternary
515
Amorphous TixSi1−xO2 Hybrid Oxides. J. Phys. Condens. Matter 2014, 26, 253201.
516
27. Dovesi, R.; Orlando, R.; Erba, A.; Zicovich-Wilson, C.M.; Civalleri, B.; Casassa, S.; Maschio, L.; Ferrabone,
517
M.; De La Pierre, M.; D'Arco, P.; Noël, Y.; Causà, M.; Rérat, M.; Kirtman, B. CRYSTAL14: A program for
518
the ab initio investigation of crystalline solids. Int. J. Quantum Chem. 2014, 114, 1287-1317.
519
28. Henning, T. Cosmic Silicates. Annu. Rev. Astron. Astrophys. 2010, 48, 21-46.
520
29. Rubin, A.E. Mineralogy of meteorite groups. Meteorit. Planet. Sci. 1997, 32, 231-247.
521
30. Mumma, M.J.; Charnley, S.B. The Chemical Composition of Comets—Emerging Taxonomies and Natal
522
Heritage. Annu. Rev. Astron. Astrophys. 2011, 49, 471-524.
523
31. Molster, F.; Kemper, C. Crystalline Silicates. Space Sci. Rev. 2005, 119, 3-28.
524
32. Vidali, G. H2 Formation on Interstellar Grains. Chem. Rev. 2013, 113 8762–8782.
525
33. Hama, T.; Watanabe, N. Surface Processes on Interstellar Amorphous Solid Water: Adsorption, Diffusion,
526
Tunneling Reactions, and Nuclear-Spin Conversion. Chem. Rev. 2013, 113, 8783-8839.
527
34. van Dishoeck, E.F.; Herbst, E.; Neufeld, D.A. Interstellar Water Chemistry: From Laboratory to
528
Observations. Chem. Rev. 2013, 113, 9043-9085.
529
35. Born, M.; Huang, K. Dynamical Theory of Crystal Lattices; Oxford University Press: Oxford, 1954.
530
36. Gale, J.D.; Rohl, A.L. The General Utility Lattice Program (GULP). Mol. Simul. 2003, 29, 291-341.
531
37. Roberts, C.; Johnston, R.L. Investigation of the Structures of MgO Clusters Using a Genetic Algorithm.
532
Phys. Chem. Chem. Phys. 2001, 3, 5024-5034.
533
38. Flikkema, E.; Bromley, S.T. A New Interatomic Potential for Nanoscale Silica. Chem. Phys. Lett. 2003, 378,
534
622-629.
535
39. Hassanali, A.A.; Singer, S.J. Model for the Water−Amorphous Silica Interface: The Undissociated Surface.
536
J. Phys. Chem. B 2007, 111, 11181-11193.
537
40. Becke, A.D. Density-Functional Thermochemistry. III. The Role of Exact Exchange. J. Chem. Phys. 1993, 98,
538
5648-5652.
539
41. Lee, C.; Yang, W.; Parr, R.G. Development of the Colle-Salvetti Correlation-Energy Formula into a
540
Functional of the Electron Density. Phys. Rev. B 1988, 37, 785-789.
541
42. Civalleri, B.; D'Arco, P.; Orlando, R.; Saunders, V.R.; Dovesi, R. Hartree–Fock Geometry Optimisation of
542
Periodic Systems with the Crystal Code. Chem. Phys. Lett. 2001, 348, 131-138.
543
43. Noel, Y.; Catti, M.; D’Arco, P.; Dovesi, R. The Vibrational Frequencies of Forsterite Mg2SiO4: An
544
All-Electron Ab Initio Study with the CRYSTAL Code. Phys. Chem. Miner. 2006, 33, 383-393.
545
44. De La Pierre, M.; Orlando, R.; Maschio, L.; Doll, K.; Ugliengo, P.; Dovesi, R. Performance of Six Functionals
546
(LDA, PBE, PBESOL, B3LYP, PBE0, and WC1LYP) in the Simulation of Vibrational and Dielectric
547
Properties of Crystalline Compounds. The Case of Forsterite Mg2SiO4. J. Comput. Chem. 2011, 32,
548
1775-1784.
549
45. De La Pierre, M.; Carteret, C.; Orlando, R.; Dovesi, R. Use of Ab Initio Methods for the Interpretation of the
550
Experimental IR Reflectance Spectra of Crystalline Compounds. J. Comput. Chem. 2013, 34, 1476-1485.
551
46. Noël, Y.; De La Pierre, M.; Maschio, L.; Rérat, M.; Zicovich-Wilson, C.M.; Dovesi, R. Electronic Structure,
552
Dielectric Properties and Infrared Vibrational Spectrum of Fayalite: An Ab Initio Simulation with an
553
All-Electron Gaussian Basis Set and the B3LYP Functional. Int. J. Quantum Chem. 2012, 112, 2098-2108.
554
47. Monkhorst, H.J.; Pack, J.D. Special Points for Brillouin-Zone Integrations. Phys. Rev. B 1976, 13, 5188-5192.
555
48. Pascale, F.; Zicovich-Wilson, C.M.; López Gejo, F.; Civalleri, B.; Orlando, R.; Dovesi, R. The Calculation of
556
the Vibrational Frequencies of Crystalline Compounds and its Implementation in the CRYSTAL Code. J.
557
Comput. Chem. 2004, 25, 888-897.
558
49. Zicovich-Wilson, C.M.; Dovesi, R.; Saunders, V.R. A General Method to Obtain Well Localized Wannier
559
Functions for Composite Energy Bands in Linear Combination of Atomic Orbital Periodic Calculations. J.
560
Chem. Phys. 2001, 115, 9708-9719.
561
50. Zicovich-Wilson, C.M.; Bert, A.; Roetti, C.; Dovesi, R.; Saunders, V.R. Characterization of the Electronic
562
Structure of Crystalline Compounds through their Localized Wannier Functions. J. Chem. Phys. 2002, 116,
563
1120-1127.
564
51. Zicovich-Wilson, C.M.; Torres, F.J.; Pascale, F.; Valenzano, L.; Orlando, R.; Dovesi, R. Ab Initio Simulation
565
52. Ferrero, M.; Rérat, M.; Orlando, R.; Dovesi, R. The Calculation of Static Polarizabilities of 1-3D Periodic
567
Compounds. The Implementation in the Crystal Code. J. Comput. Chem. 2008, 29, 1450-1459.
568
53. Ferrero, M.; Civalleri, B.; Rérat, M.; Orlando, R.; Dovesi, R. The Calculation of the Static First and Second
569
Susceptibilities of Crystalline Urea: A Comparison of Hartree–Fock and Density Functional Theory
570
Results Obtained with the Periodic Coupled Perturbed Hartree–Fock/Kohn–Sham Scheme. J. Chem. Phys.
571
2009, 131, 214704.
572
54. Maschio, L.; Kirtman, B.; Salustro, S.; Zicovich-Wilson, C.M.; Orlando, R.; Dovesi, R. Raman Spectrum of
573
Pyrope Garnet. A Quantum Mechanical Simulation of Frequencies, Intensities, and Isotope Shifts. J. Phys.
574
Chem. A 2013, 117, 11464-11471.
575
55. Carteret, C.; De La Pierre, M.; Dossot, M.; Pascale, F.; Erba, A.; Dovesi, R. The Vibrational Spectrum of
576
CaCO3 Aragonite: A Combined Experimental and Quantum-Mechanical Investigation. J. Chem. Phys.
577
2013, 138, 014201.
578
56. Lacivita, V.; Erba, A.; Noël, Y.; Orlando, R.; D’Arco, P.; Dovesi, R. Zinc Oxide Nanotubes: An Ab Initio
579
Investigation of their Structural, Vibrational, Elastic, and Dielectric Properties. J. Chem. Phys. 2013, 138,
580
214706.
581
57. Prencipe, M.; Maschio, L.; Kirtman, B.; Salustro, S.; Erba, A.; Dovesi, R. Raman Spectrum of NaAlSi2O6
582
Jadeite. A Quantum Mechanical Simulation. J. Raman Spectrosc. 2014, 45, 703-709.
583
58. Maschio, L.; Demichelis, R.; Orlando, R.; Pierre, M.D.L.; Mahmoud, A.; Dovesi, R. The Raman Spectrum of
584
Grossular Garnet: A Quantum Mechanical Simulation of Wavenumbers and Intensities. J. Raman
585
Spectrosc. 2014, 45, 710-715.
586
59. De La Pierre, M.; Carteret, C.; Maschio, L.; André, E.; Orlando, R.; Dovesi, R. The Raman Spectrum of
587
CaCO3 Polymorphs Calcite and Aragonite: A Combined Experimental and Computational Study. J.
588
Chem. Phys. 2014, 140, 164509.
589
60. Maul, J.; Erba, A.; Santos, I.M.G.; Sambrano, J.R.; Dovesi, R. In Silico Infrared and Raman Spectroscopy
590
under Pressure: The Case of CaSnO3 Perovskite. J. Chem. Phys. 2015, 142, 014505.
591
61. Schneider, A.G.; Schomborg, L.; Ulpe, A.C.; Rüscher, C.H.; Bredow, T. Structure, Vibrational Spectra and
592
11B-NMR Chemical Shift of Na8[AlSiO4]6(B(OH)4)2: Comparison of Theory and Experiment. J. Phys. Chem.
593
A 2016, 120, 7503-7509.
594
62. Ricca, C.; Grishin, A.; Ringuede, A.; Cassir, M.; Adamo, C.; Labat, F. Modeling Composite Electrolytes for
595
Low-Temperature Solid Oxide Fuel Cell Application: Structural, Vibrational and Electronic Features of
596
Carbonate-Oxide Interfaces. J. Mater. Chem. A 2016, 4, 17473-17482.
597
63. Zicovich-Wilson, C.M.; Pascale, F.; Roetti, C.; Saunders, V.R.; Orlando, R.; Dovesi, R. Calculation of the
598
Vibration Frequencies of α-Quartz: The Effect of Hamiltonian and Basis Set. J. Comput. Chem. 2004, 25,
599
1873-1881.
600
64. Ferrero, M.; Rérat, M.; Kirtman, B.; Dovesi, R. Calculation of First and Second Static Hyperpolarizabilities
601
of One- to Three-Dimensional Periodic Compounds. Implementation in the CRYSTAL Code. J. Chem.
602
Phys. 2008, 129, 244110.
603
65. Ferrero, M.; Rérat, M.; Orlando, R.; Dovesi, R. Coupled Perturbed Hartree-Fock for Periodic Systems: The
604
role of Symmetry and Related Computational Aspects. J. Chem. Phys. 2008, 128, 014110.
605
66. Dall’Olio, S.; Dovesi, R.; Resta, R. Spontaneous Polarization as a Berry Phase of the Hartree-Fock Wave
606
Function: The Case of KNbO3. Phys. Rev. B 1997, 56, 10105-10114.
607
67. Baranek, P.; Zicovich-Wilson, C.M.; Roetti, C.; Orlando, R.; Dovesi, R. Well Localized Crystalline Orbitals
608
Obtained from Bloch Functions: The Case of KNbO3. Phys. Rev. B 2001, 64, 125102.
609
68. Noel, Y.; Zicovich-Wilson, C.M.; Civalleri, B.; D’Arco, P.; Dovesi, R. Polarization Properties of ZnO and
610
BeO: An Ab Initio Study through the Berry Phase and Wannier Functions Approaches. Phys. Rev. B 2001,
611
65, 014111.
612
69. Ferrari, A.M.; Valenzano, L.; Meyer, A.; Orlando, R.; Dovesi, R. Quantum-Mechanical Ab Initio Simulation
613
of the Raman and IR Spectra of Fe3Al2Si3O12 Almandine. J. Phys. Chem. A 2009, 113, 11289-11294.
614
70. Maschio, L.; Ferrabone, M.; Meyer, A.; Garza, J.; Dovesi, R. The Infrared Spectrum of Spessartine: An Ab
615
Initio All Electron Simulation with Five Different Functionals (LDA, PBE, PBESOL, B3LYP and PBE0).
616
Chem. Phys. Lett. 2011, 501, 612-618.
617
71. Dovesi, R.; Pierre, M.D.L.; Ferrari, A.M.; Pascale, F.; Maschio, L.; Zicovich-Wilson, C.M. The IR Vibrational
618
Properties of Six Members of the Garnet Family: A Quantum Mechanical Ab Initio Study. Am. Mineral.
619
72. Deer, W.A.; Howie, R.A.; Zussman, J. An Introduction to the Rock-Forming Minerals; 2nd ed.; Longman:
621
London, 1992; p.^pp.
622
73. Servoin, J.L.; Piriou, B. Infrared Reflectivity and Raman Scattering of Mg2SiO4 Single Crystal. Phys. Status
623
Solidi B 1973, 55, 677-686.
624
74. Iishi, K. Lattice dynamics of forsterite. Am. Mineral. 1978, 63, 1198-1208.
625
75. Chopelas, A. Single Crystal Raman Spectra of Forsterite, Fayalite, and Monticellite Am. Mineral. 1991, 76,
626
1100-1109.
627
76. Reynard, B. Single-Crystal Infrared Reflectivity of Pure Mg2SiO2 forsterite and (Mg0.86,Fe0.14)2SiO4 olivine.
628
Phys. Chem. Miner. 1991, 18, 19-25.
629
77. Kolesov, B.A.; Geiger, C.A. A Raman Spectroscopic Study of Fe–Mg Olivines. Phys. Chem. Miner. 2004, 31,
630
142-154.
631
78. Hofmeister, A.M. Thermal Conductivity of Spinels and Olivines from Vibrational Spectroscopy: Ambient
632
Conditions. Am. Mineral. 2001, 86, 1188-1208.
633
79. Sogawa, H.; Koike, C.; Chihara, H.; Suto, H.; Tachibana, S.; Tsuchiyama, A.; Kozasa, T. Infrared Reflection
634
Spectra of Forsterite Crystal. Astron. Astrophys. 2006, 451, 357-361.
635
80. Suto, H.; Sogawa, H.; Tachibana, S.; Koike, C.; Karoji, H.; Tsuchiyama, A.; Chihara, H.; Mizutani, K.;
636
Akedo, J.; Ogiso, K.; Fukui, T.; Ohara, S. Low-Temperature Single Crystal Reflection Spectra of Forsterite.
637
Mon. Not. R. Astron. Soc. 2006, 370, 1599-1606.
638
81. Navarro-Ruiz, J.; Ugliengo, P.; Rimola, A.; Sodupe, M. B3LYP Periodic Study of the Physicochemical
639
Properties of the Nonpolar (010) Mg-Pure and Fe-Containing Olivine Surfaces. J. Phys. Chem. A 2014, 118,