IJEDR1401201
International Journal of Engineering Development and Research (www.ijedr.org)1122
Student's Awareness of Cloud Computing: Case
Study Faculty of Engineering at Aden University,
Yemen
Samah Sadeq Ahmed Bagish
Department of Information Technology, Faculty of Engineering, Aden University, Aden, Yemen
________________________________________________________________________________________________________ Abstract— Cloud computing is a new technology and new trends. With cloud computing application are running as a service over the internet on scalable infrastructure. Universities can take advantage of cloud computing application to provide students and teachers with free or low cost tools. This paper will focus on the students awareness of cloud computing and how often they use cloud computing application. It also aims to investigate the student's opinion of using cloud computing collaboration application and the university administrator support to integrate that new technology. The finding therefore recommends education and sensitization on cloud computing in order to increase awareness and knowledge about this emerging technology and its prospects. This work involved group of students from faculty of engineering at Aden University, Yemen.
Keywords: Cloud Computing, Grid Computing, Virtualization
________________________________________________________________________________________________________ 1. Introduction
Cloud Computing refer to providing computing resources (e.g. storage, servers, processing, networking and applications) to end users as services via the internet in pay-per-use cost structure. End users can get three types of services from cloud service providers and those three services are IaaS (Infrastructure-as-a-Service), PaaS (Platform-as-a-Service), and SaaS (Software-as-a-Service). The deployment models are private, public and hybrid clouds. Cloud computing creates virtualized resources that can be made available to end users but physical characteristics of computing are hidden from end users by providing a virtual image. Virtualization, in a rather loose definition, is a framework of dividing the resources of a computer into multiple execution environments [2]. With low financial budget and limited available resources, education sector can become level one beneficiary of cloud Computing [8].
2. Cloud Computing Definition
A common definition is given in a NIST report; "Cloud computing is a model for enabling ubiquitous, convenient, on-demand network access to a shared pool of configurable computing resources (e.g., networks, servers, storage, applications, and services) that can be rapidly provisioned and released with minimal management effort or service provider interaction"[1]. Ajithe. S, M. Hemalatha define it as "A collection of hardware, software and other resources that can be accessed over the Internet, and used to assemble a solution on demand (that is, at the time of the request) to provide a set of services back to the requester [3].
3. Characteristics of Cloud Computing
The NIST has identified five essential characteristics of Cloud Computing which are:
On-demand self-service. A consumer can unilaterally provision computing capabilities, such as server time and network storage, as needed automatically without requiring human interaction with each service provider.
Broad network access. Capabilities are available over the network and accessed through standard mechanisms that promote use by heterogeneous thin or thick client platforms (e.g., mobile phones, tablets, laptops, and workstations). Resource pooling. The provider’s computing resources are pooled to serve multiple consumers using a multi-tenant
model, with different physical and virtual resources dynamically assigned and reassigned according to consumer demand. Examples of resources include storage, processing, memory, and network bandwidth.
Rapid elasticity. Capabilities can be elastically provisioned and released, in some cases automatically, to scale rapidly outward and inward commensurate with demand.
IJEDR1401201
International Journal of Engineering Development and Research (www.ijedr.org)1123
4. Computing ParadigmsFigure (1), adapted from Voas and Zhang (2009) [4], shows six phases of computing paradigms, from dummy terminals/mainframes, to PCs, networking computing, to grid and cloud computing.
In phase 1: many users shared powerful mainframes using dummy terminals.
In phase 2: stand-alone PCs became powerful enough to meet the majority of user's needs.
In phase 3: PCs, laptops, and servers were connected together through local networks to share resources and increase performance.
In phase 4: local networks were connected to other local networks forming a global network such as the Internet to utilize remote applications and resources.
In phase 5: grid computing provided shared computing power and storage through a distributed computing system. I In phase 6: cloud computing further provides shared resources on the Internet in a scalable and simple way.
Figure (1): Six computing paradigms (adapted from Voas and Zhang (2009) [4]
5. Cloud Computing Services Models
There are three types of cloud service models as follows:
i. Infrastructure as a Service (IaaS): Is the delivery of computer infrastructure as a service. The CSP provides a set of virtualized computing resources (e.g. network, bandwidth, storage capacity, memory, processing power) in the cloud [5]. Amazon Elastic Compute is an example of IaaS.
ii. Platform as a Service (PaaS): Is an application development and deployment platform which provides programming languages and tools supported by the service provider and is delivered as a service to application developers over the Internet [6]. Google App Engine and Windows Azure are examples of PaaS.
iii. Software as a Service (SaaS): Is a service delivery model whereby applications run in the cloud and are delivered over the Internet through a web browser on a subscription or on-demand basis[6] without the need to install and run the application on the customer own computer. Google Docs and Microsoft are examples of SaaS.
6. Cloud Computing Deployment Models
More recently, four cloud deployment models have been defined in the Cloud community.
i. Public cloud: used by the general public cloud consumers and the cloud service provider have the full ownership of the public cloud with its own policy, value, and profit, costing, and charging model.
ii. Private cloud: the cloud infrastructure is operated within a single university, and managed by the IT department of the university or a third party cloud provider and may exist on premise or off premise. It can provide the utmost control over data, security, and quality of service [6].
iii. Hybrid cloud: is a composition of at least one private cloud and at least one public cloud. A hybrid cloud is typically offered in one of two ways: a vendor has a private cloud and forms a partnership with a public cloud provider, or a public cloud provider forms a partnership with a vendor that provides private cloud platforms. iv. Community cloud: share the infrastructure between universities in the same community. An example is Virginia
IJEDR1401201
International Journal of Engineering Development and Research (www.ijedr.org)1124
7. Methodology7.1.Research Population
The research population is the students of the engineering faculty (Computer Science & Engineering Department and Civil Department). The questionnaires are distributed to this population which represents the research population. The research population is identified in terms by the method of the population selection andits size, as follows:
Population Distributed Questionnaire Retrieved Questionnaire Percentage%
Computer science & engineering 62 0 40
Civil 93 0 60
Total 155 0 100
Table (1) Research Population 7.2. Questionnaire design and data collection
The questionnaire is composed of six parts as follows: First part: Personal data which consist of (7) items.
Second part: use of computers and devices for accessing the internet which consist of (2) items Third part: Cloud computing Awareness which consist of (3) items
Fourth part: use of cloud computing application which consist of (1) items
Fifth part: students opinion about collaboration when using cloud which consist of (5) items Sixth part: students opinion about university administration support which consist of (6) items
The section on opinions was particularly framed as a Likert Scale. The Likert items enabled respondents to agree or disagree with statements.
7.3. Reliability of Questionnaire
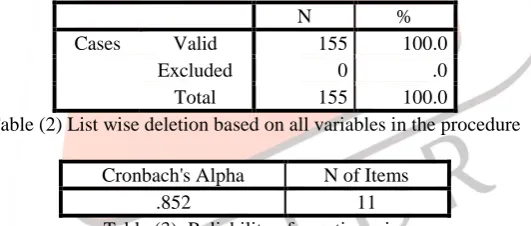
The Likert items, in particular, were subjected to statistical verification using Cronbach's alpha index of reliability to ensure that each item in the section on opinion appropriatelymeasured the respective underlying constructs[7]. The reliability for questionnaire used in this study is shown in table (3) [1].
N %
Cases Valid 155 100.0
Excluded 0 .0
Total 155 100.0
Table (2) List wise deletion based on all variables in the procedure Cronbach's Alpha N of Items
.852 11
Table (3): Reliability of questionnaire
Cronbach's Alpha equals 0.852 for the entire questionnaire which indicates an excellent reliability of the entire questionnaire. Thereby, it can be said that the researcher proved that the questionnaire was valid, reliable, andready for distribution for the population
7.4. Statistical Analysis Tools
To achieve the research goal, we used quantitative data analysis. The Data analysis will be madeutilizing (SPSS 19). We utilized the following statistical tools:
1. Cronbach's Alpha for Reliability Statistics. 2. Frequency and Descriptive analysis.
3. Parametric Tests (Analysis of Variance- ANOVA).It is used to examine if there is a statistical significant difference between several means among the respondents the use and need of Cloud Computing Technology in faculty of engineering due to (Department and level).
7.5. Results and Analysis
According to a general information which is collected from the respondents of the questionnaire, the population characteristics was determined in order to identify the characteristics of the respondents.
The repeatability distributions of some of these variables are presented to the following arrangement :Department and Level Part 1: Personal Data
IJEDR1401201
International Journal of Engineering Development and Research (www.ijedr.org)1125
DepartmentTable (4) and figure (2) shows the department distribution among the population.
Frequency Percent Valid Percent Cumulative Percent
computer science 62 40.0 40.0 40.0
civil 93 60.0 60.0 100.0
Total 155 100.0 100.0
Table (4): Illustrates Population Distribution According to Department
Figure (2): Population Distribution According to Department
The statistics show that the responders are in civil department at (60%) of the population and computer Science and engineering department (40%) of the population
Level
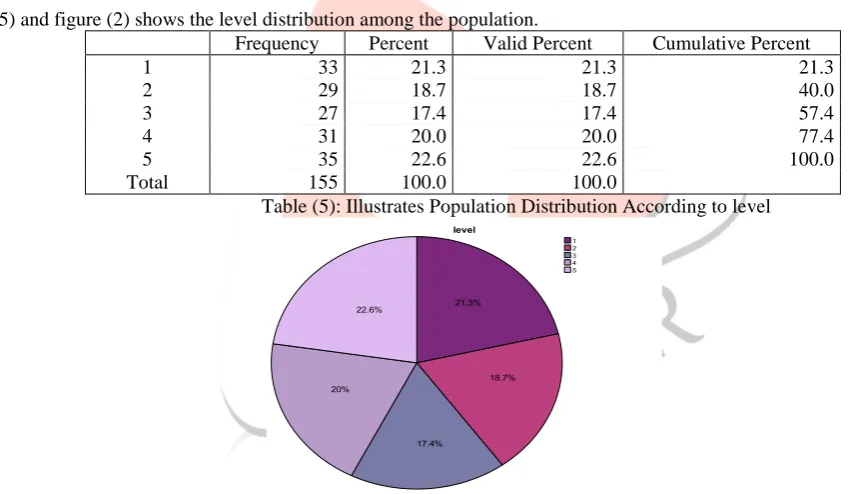
Table (5) and figure (2) shows the level distribution among the population.
Frequency Percent Valid Percent Cumulative Percent
1 33 21.3 21.3 21.3
2 29 18.7 18.7 40.0
3 27 17.4 17.4 57.4
4 31 20.0 20.0 77.4
5 35 22.6 22.6 100.0
Total 155 100.0 100.0
Table (5): Illustrates Population Distribution According to level
Figure (3): Population Distribution According to level
The statistics show that the majority of responders at level five with (22.6%) of the population, level four with (20%) of the population, level three with (17.4%) of the population, level two with (18.7%) of the population and level one with (21.3%) of the population.
Table (6) shows the Department and level distribution among the population. level
Total
1 2 3 4 5
Department computer science 14 13 10 11 14 62
civil 19 16 17 20 21 93
Total 33 29 27 31 35 155
Table (6): Illustrates Population Distribution According to Department and level Part 2: Use of computers and devices for accessing internet
IJEDR1401201
International Journal of Engineering Development and Research (www.ijedr.org)1126
Frequency PercentDesktop at home 13 8.4
Desktop at college 0 0
Laptop 145 93.5
Smart phone 108 69.7
Tablet 7 4.5
Table (7): Percent use of Computers and devices for accessing internet
Figure (4): Percent use of Computers and devices for accessing internet
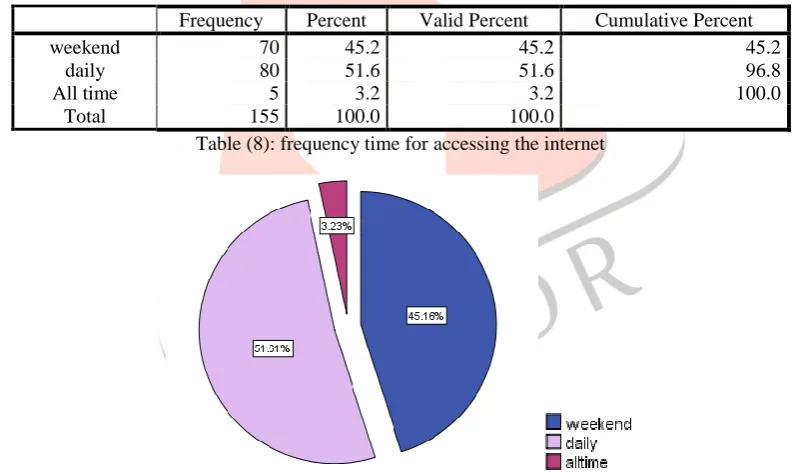
Respondents reported the frequency of Internet access shown in table (8), and responses were grouped into three categories: Weekends or few times a week (45.2%), several times a day (51.6%), all of the time or whenever I get an opportunity (3.2%).
Frequency Percent Valid Percent Cumulative Percent
weekend 70 45.2 45.2 45.2
daily 80 51.6 51.6 96.8
All time 5 3.2 3.2 100.0
Total 155 100.0 100.0
Table (8): frequency time for accessing the internet
Figure (5): Use frequency time for accessing the internet Part 3: Cloud Computing Awareness
The below table (9) and figure (6) show that how many participants are knowing about cloud computing Frequency Percent Valid Percent Cumulative Percent
yes 71 45.8 45.8 45.8
no 84 54.2 54.2 100.0
Total 155 100.0 100.0
Table (9): frequency of Cloud Computing Awareness 8.4
0
93.5
69.7
4.5 0
20 40 60 80 100
Desktop at home
Desktop at college
IJEDR1401201
International Journal of Engineering Development and Research (www.ijedr.org)1127
Figure (6): Percent of Cloud Computing AwarenessThe below table (10) show that although 71 participants (45%) said that they know cloud computing, but only 51 participants (32%) answer right definition of cloud computing.
Frequency Percent
Valid Percent
Cumulative Percent
no answer 86 55.5 55.5 55.5
2 4 2.6 2.6 58.1
3 51 32.9 32.9 91.0
4 14 9.0 9.0 100.0
Total 155 100.0 100.0
Table (10): frequency of Cloud Computing Definition
The below table (11) show that (38.1%) participants think they use cloud computing applications. Frequency Percent
Valid Percent
Cumulative Percent
yes 59 38.1 38.1 38.1
no 96 61.9 61.9 100.0
Total 155 100.0 100.0
Table (11): frequency of Cloud Computing Use Application Part 4: Use of Cloud Computing Application
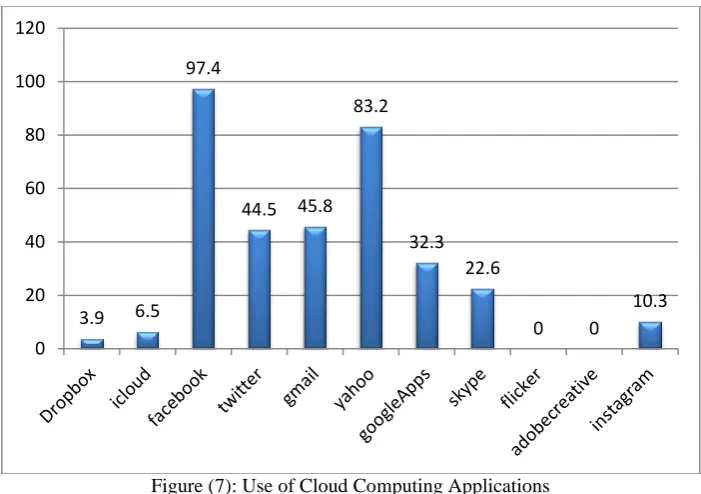
The below table (12) show that Facebook is the most popular application used by most of the participants with (97.4.1%).
Frequency Percent
Dropbox 6 3.9
icloud 10 6.5
Facebook 151 97.4
Twitter 69 44.5
Gmail 71 45.8
Yahoo 129 83.2
GoogleApps 50 32.3
Skype 35 22.6
Flicker 0 0
AdobeCreative 0 0
Instagram 16 10.3
IJEDR1401201
International Journal of Engineering Development and Research (www.ijedr.org)1128
Figure (7): Use of Cloud Computing Applications Part 5: Students Opinion about collaboration when using cloud
Statements 1 2 3 4 5 Mean Std
I like that my assignment will be shared with my lecturer
# 3 2 23 58 69
4.21 0.883
% 1.9 1.3 14.8 37.4 44.5
I like that my lecturer will be able to see my progress # 3 0 22 89 41 4.06 0.762
% 1.9 0 14.2 57.4 26.5
I don’t want the lecturer to see my assignment until its finished
# 8 112 20 11 4
2.3 0.783
% 5.2 72.3 12.9 7.1 2.6
I will enjoy accessing my assignment through web browser
# 1 3 27 71 51
4.1 0.831
% 0.6 1.9 17.4 45.8 34.2
I like that my lecturer can put feedback directly into my assignment
# 0 3 19 69 64
4.25 0.744
% 0 1.9 12.3 44.5 41.3
Total # 15 120 111 298 229 3.78 0.80
% 1.94 15.48 14.32 38.45 29.55 Table (13): Students Opinion about collaboration when using cloud
After studied the results of the previous part (Students Opinion about collaboration when using cloud) we got that 3.78 (agree) based on five Likert Scale.
Part 6: Students opinion about university administrator support
Statements 1 2 3 4 5 Mean Std
The university administration always searches for new technologies and its benefits
# 31 10 23 58 33
3.34 1.411
% 20 6.5 14.8 37.4 21.3
The university administration always concern to provide instructors with train for any new technology to keep pace with development
# 31 5 56 37 26
3.14 1.316
% 20 3.2 36.1 23.9 16.8
The university administration put flexible plan enough to accommodate any changes required by the adoption of cloud
# 30 14 46 37 28
3.12 1.35
% 19.4 9 29.7 23.9 18.1
3.9 6.5 97.4
44.5 45.8 83.2
32.3 22.6
0 0
10.3
IJEDR1401201
International Journal of Engineering Development and Research (www.ijedr.org)1129
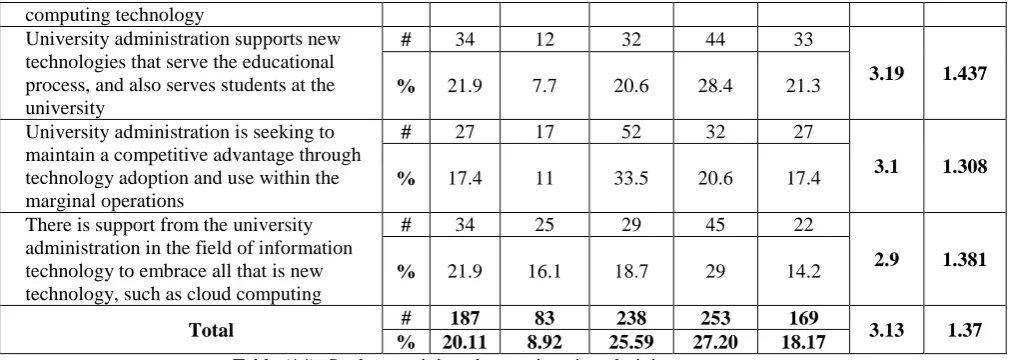
computing technologyUniversity administration supports new technologies that serve the educational process, and also serves students at the university
# 34 12 32 44 33
3.19 1.437
% 21.9 7.7 20.6 28.4 21.3
University administration is seeking to maintain a competitive advantage through technology adoption and use within the marginal operations
# 27 17 52 32 27
3.1 1.308
% 17.4 11 33.5 20.6 17.4
There is support from the university administration in the field of information technology to embrace all that is new technology, such as cloud computing
# 34 25 29 45 22
2.9 1.381
% 21.9 16.1 18.7 29 14.2
Total # 187 83 238 253 169 3.13 1.37
% 20.11 8.92 25.59 27.20 18.17 Table (14): Students opinion about university administrator support
After studied the results of the previous part (students opinion about university administrator support) we got that 3.13 (neutral) based on five Likert Scale.
Testing the Hypothesis
Null Hypothesis: There is no significant effect between students in terms of demographic variable (department) to use cloud computing collaboration application
Alternate Hypothesis: There is significant effect between students in terms of demographic variable (department) about collaboration when using cloud.
Sum of Squares df Mean Square F Sig.
Between Groups .171 1 .171 1.050 .307
Within Groups 24.878 153 .163
Total 25.049 154
Table (15): ANOVA Test to use Cloud Computing Collaboration Application
The previous table (15) shows the comparison between the means by test the value of F, the results there is no significant effect between students in terms of demographic variable (department) to use cloud computing collaboration application where the value is 0.307 is greater than 0.05 so we accept the Null Hypothesis.
8. Conclusion
The purpose of this research work is to evaluate the student's awareness and uses regarding cloud computing services and application. For this purpose a survey was conducted through questionnaires to evaluate the objectives from students of faculty of engineering at Aden University, Yemen. Findings are showing that most of the students are not familiar with cloud computing due to lack of resources but unfortunately some of them have clear. We also find that most students uses laptops (93.5%) and smart phone (69.7%) indicating their mobility. An increase in the awareness and familiarity with cloud computing amongst students will serves as the perfect recipe for increased adoption. There is therefore the need to focus and raise awareness on its benefits and importance in teaching system to extend the lack in computing resources
9. References
[1] T. Mell, "The NIST Definition of Cloud Computing," National Institute of Standards and Technology, Information Technology Laboratory, 2009
[2] M. Rosenblum. “The Reincarnation of Virtual Machines”, Qfocus, 2004
[3] A. Singh & M. Hemalatha, “Cloud Computing for Academic Environment”, Inter. J. of Info. & Com. Tech. Rese, Vol. 2, 2012
[4] Voas, J., & Zhang, J. (March/April 2009). Cloud computing: New wine or just a new bottle? IEEEITPro, 15–17.
[5] A. Youssef, “Exploring Cloud Computing Services and Applications”, J. of Emerging Trends in Computing & Information Sciences, VOL. 3, NO. 6, July 2012
[6] P. Thomas, “Cloud Computing: New Opportunities and Challenges for Education”, Journal: IEEE Technology and Engineering Education (ITEE), Vol. 7 No. 2, 2012.
[7] L.J. Cronback, "Coefficient Alpha and the Internal Structure of Tests", Psychometrika, Vol. 16 No. 3, 1951, PP. 297-334 [8] Muhammad Hairs Abid, Fahad Jan, Tasleem Mustafa, MuhammedShakeelFaridi, " Cloud Computing: A general User's
![Figure (1), adapted from Voas and Zhang (2009) [4], shows six phases of computing paradigms, from dummy terminals/mainframes, to PCs, networking computing, to grid and cloud computing](https://thumb-us.123doks.com/thumbv2/123dok_us/8447756.1388894/2.595.131.464.219.470/figure-computing-paradigms-terminals-mainframes-networking-computing-computing.webp)