Open Access Journal of Sports Medicine
Dove
press
O r i g i n A l r e S e A r c h
open access to scientific and medical research
Open Access Full Text Article
Pacing strategy in male elite and age group
100 km ultra-marathoners
Beat Knechtle1,2
Thomas rosemann1
Matthias A Zingg1
Michael Stiefel1
christoph A rüst1
1institute of Primary care, University of Zurich, Zurich, 2gesundheitszentrum St gallen, St gallen, Switzerland
correspondence: Beat Knechtle Facharzt FMh für Allgemeinmedizin, gesundheitszentrum St gallen, Vadianstrasse 26, 9001 St gallen, Switzerland
Tel +41 71 226 82 82 Fax +41 71 226 82 72 email beat.knechtle@hispeed.ch
Abstract: Pacing strategy has been investigated in elite 100 km and elite 161 km (100 mile) ultra-marathoners, but not in age group ultra-marathoners. This study investigated changes in running speed over segments in male elite and age group 100 km ultra-marathoners with the assumption that running speed would decrease over segments with increasing age of the athlete. Running speed during segments in male elite and age group finishers for 5-year age groups (ie, 18–24 to 65–69 years) in the 100 km Lauf Biel in Switzerland was investigated during the 2000–2009 period. Average running speed over segment time station (TS) TS1–TS2 (56.1 km) was compared with running speed Start–TS1 (38 km) and Start–TS3 (76.7 km) and running speed TS2–TS3 was compared with running speed Start–Finish. For the top ten athletes in each edition, running speed decreased from 2000 to 2009 for TS1–TS2 and TS2–TS3 (P,0.0001) but not in TS3–Finish (P.0.05). During TS1–TS2, athletes were running at 98.0%±2.1% of the running speed of Start–TS1. In TS2–TS3, they were running at 94.6%±3.4% of the running speed of TS1–TS2. In TS3–Finish, they were running at 95.5%±3.8% of running speed in TS2– TS3. For age group athletes, running speed decreased in TS1–TS2 and TS2–TS3. In TS3–Finish, running speed remained unchanged with the exception of the age group 40–44 years for which running speed increased. Running speed showed the largest decrease in the age group 18–24 years. To summarize, the top ten athletes in each edition maintained their running speed in the last segment (TS3–Finish) although running speed decreased over the first two segments (TS1– TS2 and TS2–TS3). The best pacers were athletes in the age group 40–44 years, who were able to achieve negative pacing in the last segment (TS3–Finish) of the race. The negative pacing in the last segment (TS3–Finish) was likely due to environmental conditions, such as early dawn and the flat circuit in segment TS3–Finish of the race.
Keywords: running, men, long distance, master athlete
Introduction
Ultra-marathon running involves any running race distance longer than the classical marathon distance of 42.195 km.1 Among the different ultra-marathon race distances,
the 100 km distance is highly popular, where the number of female and male finishers has increased exponentially in the last 50 years.2
The age3 and origin2 of the fastest 100 km ultra-marathoners are known. For elite
100 km ultra-marathoners, the pacing strategy has also been investigated.4 The faster
runners started at a faster running speed, maintained their starting speed for ∼50 km before slowing down, and finished the race within a ∼15% decrease of their starting speed.4 In contrast, slower runners showed a greater percent decrease in running speed
and were unable to maintain their initial pace for as long.4 Apart from elite 100 km
Open Access Journal of Sports Medicine downloaded from https://www.dovepress.com/ by 118.70.13.36 on 26-Aug-2020
For personal use only.
Number of times this article has been viewed
This article was published in the following Dove Press journal: Open Access Journal of Sports Medicine
Dovepress
Knechtle et al
ultra-marathoners, the pacing strategy has recently been investigated for elite 161 km (100 mile) ultra-marathoners.5
Winners in 161 km ultra-marathons remained relatively close behind the leading runners at the beginning of the race before taking the lead in the middle half of the race, and then avoided slowing down as much as the other top runners in the later stages of the race.5
Age seems to be an important predictor variable in running performance in both marathoners6 and
ultra-marathoners.7,8 In marathoners, older, female, and faster
runners were better pacers than younger, male, and slower runners.6 In 100 km ultra-marathoners, however, the
contri-bution of age to the pacing strategy is not known. In male 100 km ultra-marathoners, variables of anthropometry, training, and pre-race experience were related to 100 km race time.7 Running speed during training sessions, mean
weekly running kilometers during training, and age were the best predictors for 100 km race time.7 In male 100 km
ultra-marathoners, running performance was best at the age of ∼35 years3 and decreased after the age of ∼45 years.9
With increasing age, there is a decrease in performance-related characteristics such as maximum oxygen uptake and muscle strength,10 which might lead to reduced endurance
performance. However, increasing age might also be of benefit, especially in ultra-marathon running. It has been shown in time-limited races from 6 hours to 10 days that ultra-marathoners improved their performance with increasing number of finishes and the age of peak ultra-marathon perfor-mance increased with increasing number of finishes.11
Since running speed decreases with increasing age in 100 km ultra-marathon running,9 we may assume that older
runners (ie, those older than ∼35–45 years) will slow down more rapidly during a 100 km ultra-marathon than younger runners (ie, younger than ∼35–45 years). Therefore, we set out to describe pacing strategies in athletes of differing age groups completing the same ultra-marathon event. The aim of the present study was to investigate running speed over seg-ments in male elite and age group 100 km ultra-marathoners
competing in the 100 km Lauf Biel held in Switzerland,12
with the assumption that running speed would decrease at a faster rate over segments (ie, positive pacing)13 with
increasing age.
Materials and methods
ethics
This study was approved by the institutional review board of St Gallen, Switzerland, with a waiver of the requirement for informed consent given that the study involved analysis of publicly available data.
The race
The 100 km Lauf Biel, held in Biel, Switzerland, is one of the most traditional and largest 100 km ultra-marathons held in Europe.12 The race takes place annually during the
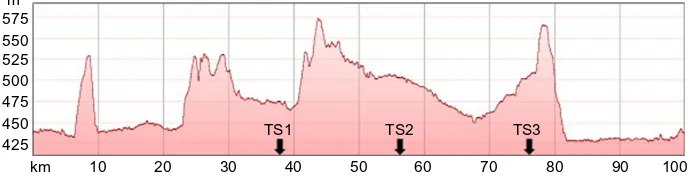
night of the first weekend in June, with all runners starting at 10 pm. The race is held as one large loop of 100 km with a total change in altitude of ∼645 m (Figure 1). The fastest finishers complete the race within ∼7 hours and arrive early in the morning at around sunrise on the following day. The organizer offers 17 aid stations, with an abundance of food and beverages, including hypotonic sports drinks, tea, soup, caffeinated drinks, water, bananas, oranges, energy bars, and bread.12 The athletes are allowed to be supported by a cyclist
for additional food and clothing.12
Data sampling and data analysis
The dataset for this study was obtained from the official race website.12 Split times at three time stations (TS) TS1
“Oberramsern” (38 km), TS2 “Kirchberg” (56.1 km), and TS3 “Bibern” (76.7 km) were taken identically during the 2000–2009 period by using an electronic chip system. Each athlete received an electronic chip within their race number, provided by the official timing company Datasport (http://www. datasport.com). Since 1999, split and overall race times have been recorded by Datasport in the same manner. In earlier years (ie, before 2000) and later years (ie, after 2009), split times
575 m
550 525 500 475 450 425
km 10 20 30 40
TS1 TS2 TS3
50 60 70 80 90 100
Figure 1 Profile of the course 100 km Lauf Bie, Switzerland.
Abbreviations: TS, time station; m, meter; km, kilometer.
Open Access Journal of Sports Medicine downloaded from https://www.dovepress.com/ by 118.70.13.36 on 26-Aug-2020
Dovepress Pacing in male elite and age group ultra-marathoners
were taken differently. Upon passing a TS and at the end of the race, the split and overall race time was recorded electronically. We used split times and distances between the different TS and between TS and both start and finish, calculating running speed between the different TS and between the TS and both start and finish. Very few women competed in this race, so we had to limit our analysis to male competitors. For each edition, we extracted the annual ten fastest men overall and the annual ten fastest male age group finishers ranked in 5-year age groups (ie, 18–24, 25–29, 30–34, 35–39, 40–44, 45–49, 50–54, 55–59, 60–64, and 65–69 years).
Statistical analysis
The performance of the top ten athletes in each edition was tested for a linear change in performance (ie, running speed) using linear regression analysis. To test whether athletes became slower during the race, relative average running speed over segment TS1–TS2 (ie, expressed as percent running speed at TS1) was compared with relative average running speed over segment Start–TS1 (defined as 100%). The relative average running speed over segment TS2–TS3 was compared with relative average running speed over seg-ment TS3–Finish. This was done using repeated measures one-way analysis of variance with Greenhouse-Geisser correction and Sidak’s multiple comparison tests, with individual variances calculated for each comparison. Since relative average running speeds over segments tended to be skewed, data were arcsine transformed before analysis using the formula arcsine ([relative speed]) = sin - 1 (square root ([relative speed]/100)). To test whether changes in altitude (calculated as the difference between two consecutive TS) during the course of the race had an effect on relative aver-age running speed over segments, we used a mixed-effects regression model with relative average running speed over segments and change in altitude as fixed variables. We performed one model (model 1) for running speed over segments for editions and age groups, and a second model (model 2) again for running speed over segments for edi-tions and age groups but with the inclusion of changes in altitudes between the different TS. The effect of change in altitude on running speed was estimated using means of the Akaike information criterion (AIC). The altitude of TS were determined using altitude information at positions of TS in Google Earth (version 7.1.2.2041, build 10/7/2013) and the altitude profile of the race course.14 The analysis of the annual
top ten men for each age group was similarly performed like the analysis of the annual ten fastest men. Since athletes in the age group 18–24 years showed the steepest decline in
running speed over segments, the relative average running speed over segments for athletes ranked in this age group was compared with the relative average running speed over segments for athletes in all other age groups using one-way analysis of variance with Dunnett’s multiple comparison post hoc tests with single pooled variance. To estimate the effect sizes of significant results, we calculated Cohen’s d using means and standard deviations. Statistical analyses were performed using IBM Statistical Package for the Social Sciences version 22 (IBM SPSS, Chicago, IL, USA) and GraphPad Prism version 6.01 (GraphPad Software, La Jolla, CA, USA). Significance was accepted at P,0.05 (two-tailed for t-tests). Significant results were further separated into
P,0.05, P,0.01, and P,0.0001. Data in the text and figures are shown as the mean ± standard deviation.
Results
Top ten athletes in each edition
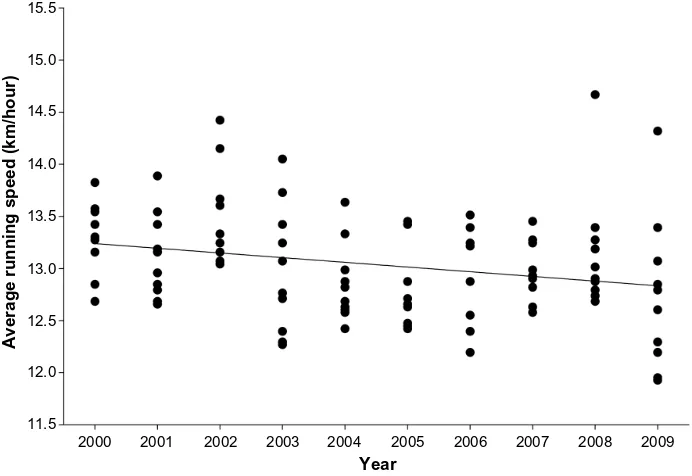
Relative average running speed over segments for the top ten athletes in each edition decreased (r2=0.06, P=0.0116)
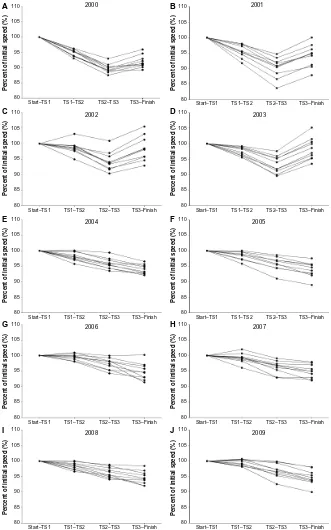
across editions (Figure 1; Cohen’s d=0.96, effect size r=0.43). Figure 2 presents the changes in percent running speed between over segments for each edition from 2000 to 2009 for the annual top ten athletes. In 2002, 2006, 2007, and 2009, the top ten athletes in each edition showed no change in running speed over segment TS1–TS2. Over segment TS2– TS3, running speed decreased in all editions. Over segment TS3–Finish, running speed increased during 2000–2003, but decreased during 2004–2009. When the top ten athletes in each edition were pooled for the 10 years of 2000–2009 (Figure 3), running speed decreased over segment TS1–TS2 (P,0.0001; Cohen’s d=1.37, effect size r=0.56) and over segment TS2–TS3 (P,0.0001; Cohen’s d=1.21, effect size
r=0.51). However, over segment TS3–Finish, no change in running speed occurred (P.0.05, Figure 4). Over segment TS1–TS2, the athletes were running at 98.0%±2.1% of their running speed for segment Start–TS1. Over segment T2–TS3, they were running at 94.6%±3.4% of their running speed for segment TS1–TS2. Over segment TS3–Finish, they were running at 95.5%±3.8% of their running speed over segment TS2–TS3.
Age group finishers
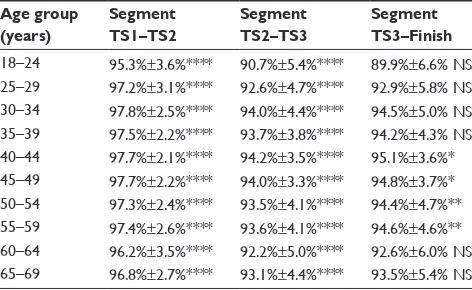
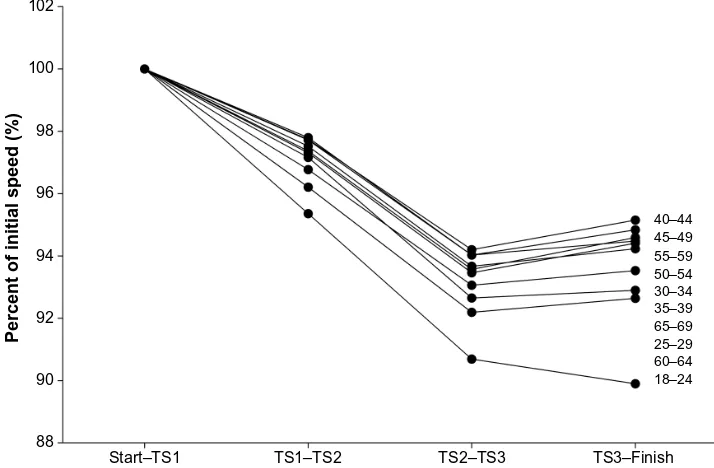
For all age group athletes, running speed decreased over seg-ment TS1–TS2 and over segseg-ment TS2–TS3 (Table 1). However, over segment TS3–Finish, running speed remained, unchanged with the exception of the age group 40–44 years, where running speed increased. Running speed showed the greatest decrease
Open Access Journal of Sports Medicine downloaded from https://www.dovepress.com/ by 118.70.13.36 on 26-Aug-2020
Dovepress
Knechtle et al
in athletes in the age group 18–24 years (Figure 5). Running speed for athletes in the age group 18–24 years was different from that of all other age group athletes, with the exception of athletes in the age group 60–64 years at TS2 and TS3.
Influence of changes
in altitude on performance
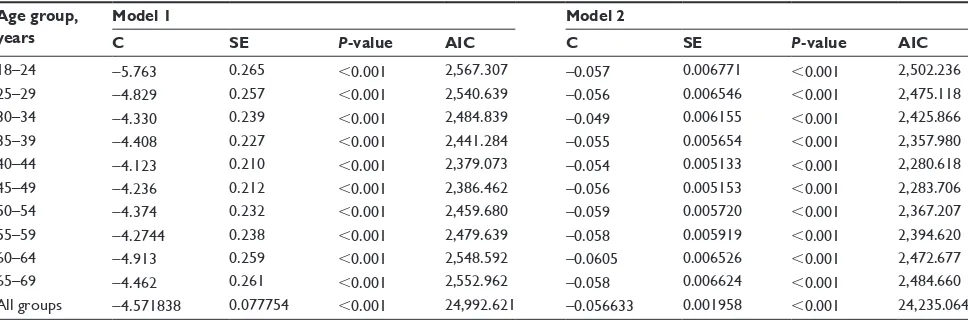
Running speed decreased in the top ten athletes across editions (Table 2, model 1). However, when altitude was included in the model (Table 2, model 2), running speed did not decrease in 2006 and 2009. When the ten fastest runners in each age group were considered (Table 3), running speed decreased over segments (Table 3, model 1); changes in altitude had no influence on performance (Table 3, model 2), even when all age group athletes were considered.
Discussion
This study investigated changes in running speed over seg-ments in a single 100 km ultra-marathon for both elite and age group athletes, and it was hypothesized that running speed would decrease more rapidly over segments in older age group athletes than in their younger counterparts. The most important findings were: the top ten athletes became slower across editions: running speed decreased over segments in the top ten athletes in each edition in TS1–TS2 and TS2–TS3, but remained unchanged over segment TS3–Finish; and runners in the age group 18–24 years showed the greatest decrease in running speed over the different race segments.
Top ten athletes in each edition
Mean top ten running speed in each edition decreased over segments during the 2000–2009 period. However, this result is very surprising given that the worldwide trend is an improve-ment in performance (ie, increase in running speed) across calendar years in 100 km ultra-marathoners.3 Cejka et al
recently investigated the running speed of the annual fastest women and men competing in all 100 km ultra-marathons held worldwide between 1960 and 2012.3 Running speed
increased very significantly from 10.23±1.22 km/hour to 15.05±0.29 km/hour for the annual ten fastest men and from 7.18±1.54 km/hour to 13.03±0.18 km/hour for the annual ten fastest women.3 Potential differences between the 100 km
Lauf Biel and the worldwide trend in 100 km ultra-marathons could be changes in environmental conditions across years and changes in participation trends, both of which might influence performance in ultra-marathoners.
Indeed, the 100 km Lauf Biel might be different to the general trend worldwide.12 A study investigating
participa-tion and performance trends in the 100 km Lauf Biel from 1998 to 2010 showed that the mean age of the annual top ten finishers increased annually by 0.4 years for both women and men.9 The 100 km race times for the annual top ten
finish-ers remained stable for women, but significantly increased annually by 2.4 minutes for men.9 We might assume that
elite 100 km ultra-marathoners do not compete in the 100 km Lauf Biel, given that the best 100 km ultra-marathoners origi-nate from Japan.2 Alternatively, the best ultra-marathoners
15.5
15.0
13.5
13.0
12.5
12.0
11.5
2000 2001 2002 2003 2004 2005
Year
Average running speed (km/hour)
2006 2007 2008 2009 14.5
14.0
Figure 2 running speed of the top ten athletes in each edition between 2000 and 2009.
Open Access Journal of Sports Medicine downloaded from https://www.dovepress.com/ by 118.70.13.36 on 26-Aug-2020
Dovepress Pacing in male elite and age group ultra-marathoners
might be seeking other or longer running challenges, such as 161 km ultra-marathons,15 Badwater,16,17 Spartathlon,16,17
and Marathon des Sables,18,19 or longer ultra-marathon races
up to 1,000 km,20 3,100 miles,21 or 10 days.11
When running speed over segments was analyzed by edition for the ten fastest finishers, some athletes were
able to achieve a negative or even pacing over segment TS1–TS2, but pacing was positive over segment TS2–TS3 in all editions. Over segment TS3–Finish, running speed increased in 2000–2003 but decreased in 2004–2009. The overall decrease in running speed over segments during the 2000–2009 period was due to the decrease in the last segment
2000
2002 2003
105 110 A
C D
B
100
95
Percent of initial speed (%) 85 Percent of initial speed (%) 90
80
105 110
100
95
Percent of initial speed (%) 85 90
80
105 110
100
95
85 90
80
Percent of initial speed (%)
105 110
100
95
85 90
80
Start–TS1 TS1–TS2 TS2–TS3 TS3–Finish
Start–TS1 TS1–TS2 TS2–TS3 TS3–Finish
2004
E
105 110
100
95
Percent of initial speed (%) 85 90
80
Start–TS1 TS1–TS2 TS2–TS3 TS3–Finish
2006
2008
2007
2009
G
105 110
100
95
Percent of initial speed (%) 85 90
80
Start–TS1 TS1–TS2 TS2–TS3 TS3–Finish
Start–TS1 TS1–TS2 TS2–TS3 TS3–Finish
H
105 110
100
95
Percent of initial speed (%) 85 90
80
J
105 110
100
95
Percent of initial speed (%)
85 90
80 I
105 110
100
95
Percent of initial speed (%) 85 90
80
Start–TS1 TS1–TS2 TS2–TS3 TS3–Finish
Start–TS1 TS1–TS2 TS2–TS3 TS3–Finish
2005
F
105 110
100
95
Percent of initial speed (%) 85 90
80
Start–TS1 TS1–TS2 TS2–TS3 TS3–Finish
Start–TS1 TS1–TS2 TS2–TS3 TS3–Finish
Start–TS1 TS1–TS2 TS2–TS3 TS3–Finish
2001
Figure 3 change in running speed for the top ten athletes in each edition over segments Start–TS1, TS1–TS2, TS2–TS3, and TS3–Finish, expressed as percent of running speed over segment Start–TS1 between 2000 and 2009 (A–J).
Abbreviation: TS, time station.
Open Access Journal of Sports Medicine downloaded from https://www.dovepress.com/ by 118.70.13.36 on 26-Aug-2020
Dovepress
Knechtle et al
(TS3–Finish) during 2004–2009. A potential explanation for even or negative pacing over segment TS3–Finish could involve motivational factors and experience. Motivation might be increased by knowing that the finish line is very near after passing the last TS. Hanley recently showed that gold medalists competing in the world cross country champion-ships were faster than the other medalists only in the final lap,22 and concluded that athletes taking a patient approach in
the early stages of the race would have the benefit of a faster finish.22 When 20 km and 50 km race walkers competing in
the International Association of Athletics Federations (IAAF) world championships were compared, the fastest finishers started the slowest relative to their previous best performance and lower-placed finishers tended to decrease speed earlier during the race.23
However, the overall goal is to complete the race as fast as possible; therefore, the optimal starting speed is the one
that allows this to occur. Leading athletes probably achieve higher finishing speeds because they have more physiologi-cal reserve as the race enters the final stages. When we look at the different editions (Figure 3), we see a different trend in 2000–2003 compared with 2004–2009. While the annual top ten finishers showed negative pacing in the last split in 2000–2003, pacing became positive in the last split in 2004–2009. There seems to be a trend towards even pacing after 2005, with more negative splits at the final segment before 2005. Changes in training theory or even trends may play an important role! Perhaps some “running guru” started advertising towards negative split pacing and against “putting some time in the bank”?
Psychological reasons for decision-making in pacing strategy should also be considered.24–26 The performance
level of the athletes seems to be the most important factor. Renfree and St Clair Gibson investigated the influence of different performance standards on pacing strategy in elite female marathoners competing in the IAAF Women’s Marathon Championship in 2009.24 Athletes finishing in the
first quartile of all finishers ran the first two 5 km segments at a relatively slower speed than athletes in the second to fourth quartiles of all finishers, but at a relatively higher speed after 35 km.24 These authors concluded that psychological factors
influenced decision-making in a major competitive event.24
Similarly, top runners in the New York City Marathon tried to maintain an even pacing profile by avoiding an excessively fast start, which might result in a decrease in running speed in the second half of the race.25 Esteve-Lanao et al
investi-gated the pacing strategy in athletes competing in the World Cross Country Championships between 2007 and 2013.26
They showed that the top ten finishers displayed more even pacing compared with the other finishers, who showed more positive pacing.26
Another explanation for the even pacing over the last segment (TS3–Finish) could be the environmental conditions (ie, the flat circuit in the last segment of the race).13 Abbiss
and Laursen reported that a constant pace is “optimal” for prolonged events such as running, swimming, rowing, ski-ing, speed skatski-ing, and cycling under stable external (ie, environmental and geographic) conditions.13 These aspects
(ie, dawn and a flat course over the last segment of the race) might explain why some athletes were able to achieve nega-tive or even pacing in the last segment of the race.
Age group finishers
When the ten fastest finishers for each age group were con-sidered, running speed decreased over segments TS1–TS2 105
100
95
Percent of initial speed (%
)
90
85
Start–TS1 TS1–TS2 TS2–TS3 TS3–Finish
Figure 4 change in running speed for the 100 fastest finishers (pooled from ten editions between 2000 and 2009) over segments Start–TS1, TS1–TS2, TS2–TS3, and TS3–Finish, expressed as percent of running speed over segment Start–TS1.
Abbreviation: TS, time station.
Table 1 Percent running speed over segments expressed in percent of running speed at TS1
Age group (years)
Segment TS1–TS2
Segment TS2–TS3
Segment TS3–Finish
18–24 95.3%±3.6%**** 90.7%±5.4%**** 89.9%±6.6% nS 25–29 97.2%±3.1%**** 92.6%±4.7%**** 92.9%±5.8% nS 30–34 97.8%±2.5%**** 94.0%±4.4%**** 94.5%±5.0% nS 35–39 97.5%±2.2%**** 93.7%±3.8%**** 94.2%±4.3% nS 40–44 97.7%±2.1%**** 94.2%±3.5%**** 95.1%±3.6%* 45–49 97.7%±2.2%**** 94.0%±3.3%**** 94.8%±3.7%* 50–54 97.3%±2.4%**** 93.5%±4.1%**** 94.4%±4.7%** 55–59 97.4%±2.6%**** 93.6%±4.1%**** 94.6%±4.6%** 60–64 96.2%±3.5%**** 92.2%±5.0%**** 92.6%±6.0% nS 65–69 96.8%±2.7%**** 93.1%±4.4%**** 93.5%±5.4% nS
Note: *P,0.05; **P,0.01; ****P,0.0001.
Abbreviations: NS, not statistically significant; TS, time station.
Open Access Journal of Sports Medicine downloaded from https://www.dovepress.com/ by 118.70.13.36 on 26-Aug-2020
Dovepress Pacing in male elite and age group ultra-marathoners
and TS2–TS3 in all age groups. However, over segment TS3–Finish, running speed remained unchanged, with the exception of the age group 40–44 years, in which running speed increased. The greatest decrease in running speed was found for athletes in the age group 18–24 years. The finding that athletes in the age group 40–44 years were able to achieve negative pacing over segment TS3–Finish is not surprising. A potential explanation could be age itself. The fastest race times in 100 km ultra-marathons are achieved by athletes under the age of ∼40 years.3 Cejka et al investigated changes
in 100 km ultra-marathon running performance and age of peak running performance for 100 km ultra-marathoners
competing worldwide between 1960 and 2012.3 The running
speed of the annual top ten athletes increased across the calendar years from 8.67 km/hour to 15.65 km/hour and the mean age of the annual top ten athletes increased during the same period from 29 to 40 years.3
A rather surprising finding was that athletes in the age group 18–24 years showed the largest decrease in running speed over segments. Age has been reported to be a major pre-dictor variable in 100 km ultra-marathon running, apart from running speed during training and the number of kilometers run per week.7 The age group 18–24 years is not the typical
age of successful ultra-marathoners.8 Ultra-marathoners are
102
100
98
96
94
Percent of initial speed (%) 92
90
88
Start–TS1 TS1–TS2 TS2–TS3 TS3–Finish
40–44 45–49 55–59 50–54 30–34 35–39 65–69 25–29 60–64 18–24
Figure 5 Change in running speed over segments for age group finishers (pooled from ten editions between 2000 and 2009) for each age group over segments Start–TS1, TS1–TS2, TS2–TS3, and TS3–Finish, expressed as percent of running speed over segment Start–TS1.
Abbreviation: TS, time station.
Table 2 Coefficients and standard errors from a multivariable regression model for the change in running speed over segments for editions (model 1) and editions and change in altitude (model 2)
Edition Model 1 Model 2
C SE P-value AIC C SE P-value AIC
2000 -5.463 0.582 ,0.001 232.704 -0.083 0.009 ,0.001 191.136
2001 -4.473 0.766 ,0.001 254.709 -0.098 0.014 ,0.001 226.086
2002 -2.913 0.734 ,0.001 251.355 -0.081 0.015 ,0.001 233.027
2003 -2.679 0.783 0.001 256.439 -0.104 0.014 ,0.001 223.913
2004 -4.685 0.382 ,0.001 199.049 -0.022 0.009 0.033 196.420
2005 -4.722 0.389 ,0.001 200.590 -0.021 0.010 0.043 198.462
2006 -4.231 0.472 ,0.001 216.019 -0.004 0.013 0.708 217.877
2007 -4.399 0.391 ,0.001 201.024 -0.022 0.010 0.031 198.322
2008 -4.356 0.379 ,0.001 198.542 -0.021 0.009 0.033 195.941
2009 -4.456 0.439 ,0.001 210.303 -0.002 0.012 0.841 212.263
All years -4.238180 0.197019 ,0.001 2,327.430 -0.046241 0.004942 ,0.001 2,250.256
Abbreviations: AIC, Akaike information criterion; C, coefficient; SE, standard error.
Open Access Journal of Sports Medicine downloaded from https://www.dovepress.com/ by 118.70.13.36 on 26-Aug-2020
Dovepress
Knechtle et al
typically aged about 45 years, and male ultra-marathoners achieve their fastest race times at the age of ∼30–49 years.3,8
The age of peak ultra-marathon performance is also higher in the longest ultra-marathon race distances. When athletes competing in races from 6 hours to 10 days were investigated, the age of t best ultra-marathon performance increased with increasing race duration.11
Athletes aged ∼20 years may also have too little experi-ence in ultra-marathon running. Younger ultra-marathoners have not finished as many ultra-marathons as their older counterparts.8 A recent study investigating ultra-marathoners
competing from 6 hours to 10 days showed that the age of peak ultra-marathon performance increased with increasing number of finishes.11 Hoffman and Krishnan investigated
the past-year and lifetime exercise patterns of 1,345 current and former ultra-marathoners.27 The median age at the first
ultra-marathon was 36 years, and the median number of years of regular running before the first ultra-marathon was 7.27
Active ultra-marathoners had a past-year median running distance of ∼3,347 km, which was minimally related to age but mostly related to their longest ultra-marathon competi-tion of the year.27
A potential explanation for even or negative pacing over the last segment (TS3–Finish) could be the timing of the start of the race. Athletes start the 100 km Lauf Biel at 10 pm and have to run during darkness. The fastest runners are able to finish the 100 km within ∼7 hours and arrive at the finish line between 5 am and 5:30 am. In the beginning of June, sun rise is at ∼5:30 am, but dawn has already broken at ∼4:30 am. The fastest runners in the field might be motivated by the increasing daylight and better visibility after the dark night. Environmental factors affecting circadian rhythm include
light, heat, air ionization, activity and eating patterns, and social activity.28 It has been reported that bright light has
an effect on the human circadian system, which is qualita-tively different from the effect of dim light.29 Endogenous
rhythms are desynchronized when perturbed by nocturnal shift work or time zone transitions.28 Circadian rhythmicity
in athletic performance can be modulated by factors such as workload, psychological stress, motivation, differences in “morningness/eveningness”, lighting, sleep disturbances, altitude, dietary constituents, sex, and age.30 Athletes older
than 50 years tend to be higher in “morningness”, habitu-ally scheduling relatively more training in the morning and selecting relatively higher work rates during exercise when compared with younger athletes.31 A further contributing
factor could be the difference in temperature between day and night. In June, the maximum temperature can rise to
∼30°C, and slower athletes may suffer in the heat during the day. Otherwise, faster athletes may profit from the lower temperatures at night.
Influence of changes
in altitude on performance
We included changes in altitude in our model and found that altitude had an influence in two editions (2006 and 2009) on running speed of the top ten athletes. This seems unusual; perhaps on these occasions there were tactical factors of the leading athletes that were more important than changes in elevation per se. Change in altitude had no influence on running speed over segments when considered by age group. This result confirms the recent finding that gradient was insignificant in the world record marathon runs in 2008 and 2011.32
Table 3 Coefficients and standard errors from a multivariable regression model for the change in running speed over segments for age groups (model 1) and age groups and change in altitude (model 2)
Age group, years
Model 1 Model 2
C SE P-value AIC C SE P-value AIC
18–24 -5.763 0.265 ,0.001 2,567.307 -0.057 0.006771 ,0.001 2,502.236
25–29 -4.829 0.257 ,0.001 2,540.639 -0.056 0.006546 ,0.001 2,475.118
30–34 -4.330 0.239 ,0.001 2,484.839 -0.049 0.006155 ,0.001 2,425.866
35–39 -4.408 0.227 ,0.001 2,441.284 -0.055 0.005654 ,0.001 2,357.980
40–44 -4.123 0.210 ,0.001 2,379.073 -0.054 0.005133 ,0.001 2,280.618
45–49 -4.236 0.212 ,0.001 2,386.462 -0.056 0.005153 ,0.001 2,283.706
50–54 -4.374 0.232 ,0.001 2,459.680 -0.059 0.005720 ,0.001 2,367.207
55–59 -4.2744 0.238 ,0.001 2,479.639 -0.058 0.005919 ,0.001 2,394.620
60–64 -4.913 0.259 ,0.001 2,548.592 -0.0605 0.006526 ,0.001 2,472.677
65–69 -4.462 0.261 ,0.001 2,552.962 -0.058 0.006624 ,0.001 2,484.660
All groups -4.571838 0.077754 ,0.001 24,992.621 -0.056633 0.001958 ,0.001 24,235.064
Abbreviations: AIC, Akaike information criterion; C, coefficient; SE, standard error.
Open Access Journal of Sports Medicine downloaded from https://www.dovepress.com/ by 118.70.13.36 on 26-Aug-2020
Dovepress Pacing in male elite and age group ultra-marathoners
limitations and implications
for future research
This study is limited in that certain environmental factors, such as wind, were not taken into consideration. Another study reported that headwind was a significant contributor to variability in running speed during the world record marathon runs in 2008 and 2011.32 The conflicting variables of
experi-ence and aging may explain why the best results were found in the middle-aged groups. Future studies may investigate whether a U-shaped curve will result from these two oppo-site trends. The fact that this race is over one long lap with quite substantial elevation changes does complicate things to some extent. Future studies could investigate a multi-lap event to simplify the issue of altitude changes and pacing.
Practical applications
This analysis shows that athletes in the age group 18–24 years have the largest decrease in running speed over segments. Younger athletes intending to compete in a 100 km ultra-marathon should be very cautious about pacing, and are recommended to complete many shorter races in advance.
Conclusion
To summarize, in the 100 km Lauf Biel, the top ten athletes in each edition were able to maintain their running speed in the last segment of the race, although running speed decreased in the first two segments. This was likely due to environmen-tal conditions, such as dawn and the flat circuit in the last segment. The “best” pacers were athletes in the age group 40–44 years, who were able to achieve negative pacing in the last segment of the race. The “worst” pacers were athletes in the age group 18–24 years, who had the greatest decrease in running speed across segments.
Disclosure
The authors report no conflicts of interest in this work.
References
1. Ultramarathon Running Resource. Available from: website http://www. ultramarathonrunning.com. Accessed January 25, 2015.
2. Cejka N, Rüst CA, Lepers R, Onywera V, Rosemann T, Knechtle B. Participation and performance trends in 100 km ultra-marathons worldwide. J Sports Sci. 2014;32:354–366.
3. Cejka N, Knechtle B, Rüst CA, Rosemann T, Lepers R. Performance and age of the fastest female and male 100 km ultra-marathoners worldwide from 1960 to 2012. J Strength Cond Res. January 28, 2014. [Epub ahead of print.]
4. Lambert MI, Dugas JP, Kirkman MC, Mokone GG, Waldeck MR. Changes in running speeds in a 100 km ultra-marathon race. J Sports
Sci Med. 2004;3:167–173.
5. Hoffman MD. Pacing by winners of a 161-km mountain ultramarathon.
Int J Sports Physiol Perform. 2014;9:1054–1056.
6. March DS, Vanderburgh PM, Titlebaum PJ, Hoops ML. Age, sex, and finish time as determinants of pacing in the marathon. J Strength Cond
Res. 2011;25:386–391.
7. Knechtle B, Knechtle P, Rosemann T, Lepers R. Predictor variables for a 100 km race time in male ultra-marathoners. Percept Mot Skills. 2010;111:681–693.
8. Knechtle B. Ultramarathon runners: nature or nurture? Int J Sports
Physiol Perform. 2012;7:310–312.
9. Knechtle B, Rüst CA, Rosemann T, Lepers R. Age-related changes in 100 km ultra-marathon running performance. Age (Dordr). 2012;34: 1033–1045.
10. Wiswell RA, Hawkins SA, Jaque SV, et al. Relationship between physiological loss, performance decrement, and age in master athletes.
J Gerontol A Biol Sci Med Sci. 2001;56:M618–M626.
11. Knechtle B, Valeri F, Zingg MA, Rosemann T, Rüst CA. What is the age for the fastest ultra-marathon performance in time-limited races from 6 h to 10 days? Age (Dordr). 2014;36:9715.
12. 100 km Lauf Biel. Available from: http://www.100km.ch. Accessed January 25, 2015.
13. Abbiss CR, Laursen PB. Describing and understanding pacing strategies during athletic competition. Sports Med. 2008;38:239–252.
14. Available from: http://www.gpsies.com/map.do?fileId=jxecmrwu azirqtcy. Accessed September 13, 2014.
15. Hoffman MD, Wegelin JA. The Western States 100-Mile Endurance Run: participation and performance trends. Med Sci Sports Exerc. 2009;41:2191–2198.
16. da Fonseca-Engelhardt K, Knechtle B, Rüst CA, Knechtle P, Lepers R, Rosemann T. Participation and performance trends in ultra-endurance running races under extreme conditions – ‘Spartathlon’ versus ‘Badwater’. Extrem Physiol Med. 2013;2:15.
17. Zingg MA, Knechtle B, Rüst CA, Rosemann T, Lepers R. Analysis of participation and performance in athletes by age group in ultramarathons of more than 200 km in length. Int J Gen Med. 2013;6:209–220. 18. Jampen SC, Knechtle B, Rüst CA, Lepers R, Rosemann T. Increase in
finishers and improvement of performance of masters runners in the Marathon des Sables. Int J Gen Med. 2013;6:427–438.
19. Knoth C, Knechtle B, Rüst CA, Rosemann T, Lepers R. Participation and performance trends in multistage ultramarathons – the ‘Marathon des Sables’ 2003–2012. Extrem Physiol Med. 2012;1:13.
20. Romer T, Rüst CA, Zingg MA, Rosemann T, Knechtle B. Age and ultra-marathon performance – 50 to 1,000 km distances from 1969–2012.
Springerplus. 2014;3:693.
21. Zingg MA, Rüst CA, Rosemann T, Lepers R, Knechtle B. Runners in their forties dominate ultra-marathons from 50 to 3,100 miles. Clinics
(Sao Paulo). 2014;69:203–211.
22. Hanley B. Senior men’s pacing profiles at the IAAF World Cross Country Championships. J Sports Sci. 2014;32:1060–1065.
23. Hanley B. An analysis of pacing profiles of world-class racewalkers.
Int J Sports Physiol Perform. 2013;8:435–441.
24. Renfree A, St Clair Gibson A. Influence of different performance levels on pacing strategy during the Women’s World Championship marathon race. Int J Sports Physiol Perform. 2013;8:279–285.
25. Santos-Lozano A, Collado PS, Foster C, Lucia A, Garatachea N. Influence of sex and level on marathon pacing strategy. Insights from the New York City race. Int J Sports Med. 2014;35:933–938. 26. Esteve-Lanao J, Larumbe-Zabala E, Dabab A, Alcocer-Gamboa A,
Ahumada F. Running World Cross Country Championships: a unique model for pacing study. Int J Sports Physiol Perform. 2014;9: 1000–1005.
27. Hoffman MD, Krishnan E. Exercise behavior of ultramarathon runners: baseline findings from the ULTRA study. J Strength Cond Res. 2013;27:2939–2945.
28. Reilly T. Human circadian rhythms and exercise. Crit Rev Biomed Eng. 1990;18:165–180.
Open Access Journal of Sports Medicine downloaded from https://www.dovepress.com/ by 118.70.13.36 on 26-Aug-2020
Open Access Journal of Sports Medicine
Publish your work in this journal
Submit your manuscript here: http://www.dovepress.com/open-access-journal-of-sports-medicine-journal
Open Access Journal of Sports Medicine is an international, peer-reviewed, open access journal publishing original research, reports, reviews and commentaries on all areas of sports medicine. The manuscript management system is completely online and includes a very quick and fair peer-review system.
Visit http://www.dovepress.com/testimonials.php to read real quotes from published authors.
Dovepress
Dove
press
Knechtle et al
29. Wever RA, Polásek J, Wildgruber CM. Bright light affects human circadian rhythms. Pflugers Arch. 1983;396:85–87.
30. Winget CM, DeRoshia CW, Holley DC. Circadian rhythms and athletic performance. Med Sci Sports Exerc. 1985;17:498–516.
31. Atkinson G, Reilly T. Circadian variation in sports performance. Sports
Med. 1996;21:292–312.
32. Angus SD. Did recent world record marathon runners employ optimal pacing strategies? J Sports Sci. 2014;32:31–45.
Open Access Journal of Sports Medicine downloaded from https://www.dovepress.com/ by 118.70.13.36 on 26-Aug-2020