372
Effect of Natural Fibers as Fillers on Glass Fiber
Reinforced Plastics
Anurag Gupta
Department of Mechanical Engineering, KIET Group of Institution anurag.gupta@kiet.edu
Abstract- Now days the researchers are foucusing to develop newer material which are sustainable and having
high strength to weight ratio at low cost. In the present work glass fiber reinforced plastic (GFRP) composites is developed with three different natural fiber i.e. jute, coir and baggase fiber as filler. Natural fibers are chosen so as to reduce the cost of composite and to obtain optimal composition to achieve maximum strength with the above said reinforcements. Unsaturated polyester resin is used as the matrix in this study and the glass fiber to resin ratio is kept constant while the fraction of three natural fibers are varied for to analyze the effect of these natural fiber on tensile strength of the GFRP. For this purpose D.O.E with Taguchi’s orthogonal L9 arrays are used. Analysis of variance (ANOVA) is performed on the measured data and signal to noise (S/N) ratios. A correlation derived from the results of Taguchi experimental design is proposed as a predictive equation for estimation of tensile strength of these composites. It is demonstrated that the predicted results obtained using this equation are consistent with experimental observations. Finally, optimal factor settings for maximum strength are determined.
Keywords: glass fiber reinforced plastic, Taguchi method, Design of experiment, unsaturated polyester resin.
1. INTRODUCTION
Most of the engineering applications require greater strength to weight ratio. so attempts are to be made to reduce the weight of GFRP by reinforcing it with less density fibers like jute, cotton, coir, baggase, banana etc. Chand et al. (1987) examined tensile and impact strength for rice husk ash-filled polyester resin composite with different ash volume fractions in the hand lay-up process. Cao and Fukumoto (2007) investigated the bulk molding compound (BMC) composed of unsaturated polyester (UP) resin, glass fibers, and bagasse fibers. An improvement was observed in the mechanical properties of injection molding composites by including the bagasse fibers. Saw and Datta (2009) used Furfuryl alcohol-grafted bagasse fiber varied from 20 to 50% in improvised jute fiber epoxy composite shows 55 % increase in tensile strength. Dhawan et al. (2013) studied the effect of coconut coir, rice and wheat husk as natural fillers on the mechanical characteristics of polyester and epoxy resins GFRP composite.
Gupta et al.(2014) investigated the effect of CaCO3 on hand layup GFRP composite tensile strength. Gupta et al.(2015) used bagasse fiber, carbon black and CaCO3as filler in pultruded glass reinforced polymer composite and optimize the tensile strength. Gupta et.al. (2016) develop hybrid filler for optimizing the flexural strength of pultruded jute fiber reinforced composite. Glass fiber reinforced plastics(GFRP) are most commonly used type of FRP composite .Glass fiber being synthetically made fiber so it is costly as compared to naturally available fiber such as jute , coir
, baggase , cotton etc. Moreover, glass fiber possesses higher density than all available natural fibers. In the present work an effort is made to develop a composition of natural fiber which can be used as filler in GFRP composite to achieve optimum tensile strength.
2. METHODS AND MATERIAL
Material used for manufacturing of GFRP by hand layup process is as follows
Fiber Used For Reinforcement: Glass fiber
Fibers Used As Filler: Jute fiber, Coir fiber, Baggase fiber
Resin Used: Unsaturated polyester resin: thermosetting polymer
Accelerator Used : Cobalt Nepthelate
373
Figure 1: Hand Layup process
3. EXPERIMENTATION
[image:2.595.75.291.109.231.2]The levels of fillers were decided by pilot experiments to check viscosity of resin after mixing of filler fibers to the resin. The levels of filler fibers in % is given in table 1
Table 1 various levels of fillers
Level Jute% Coir % Baggase %
1. 10 8 5
2. 15 12 7.5
3. 20 16 10
The experiments were conducted to manufacturing of GFRP composite by hand layup process with natural fibers filler as per Taguchi L9 orthogonal array as given in table 2
Table 2: level of natural fiber fillers
Experiment Run
% Jute % coir %Baggase
1. 10 8 5
2. 10 12 7.5
3. 10 16 10
4. 15 8 7.5
5. 15 12 10
6. 15 16 5
7. 20 8 10
8. 20 12 7.5
9. 20 16 1
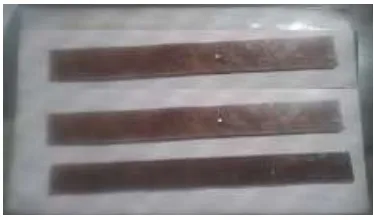
Figure 2 shows the laminate developed by hand layup process with different composition as per design of experiments.
Figure 2: work pieces obtained using hand lay- up process
After manufacturing of GFRP composite work pieces were prepared according to ASTM International (2010) D638: 2010 for tensile test. The figure 3 shows the specimen for tensile test as per ASTM D638: 2010.
Figure 3: specimen For tensile test on UTM as per ASTM D638: 2010
Result and Discussion:
The results of tensile test conducted on different composition of composite specimen are given in table 3 along with the calculated S/N ratio. As the tensile strength is a larger the better type response so the S/ N ratio is calculated on the equation 1
The average values of tensile strength and the S/N ratio for each parameter at level L1, L2 and L3 are calculated and are given in Table 3. These values have been plotted in Figure 4.
Table 3: Response table with S/N Ratio
Exp . Run
Tensile strength Test Data S/N ratio (db) R1
(MPa) R2 (MPa)
R3 (MPa)
Mean (MPa) 1.
87.50 91.20 90.70 89.80 39.07 2.
81.60 87.30 86.40 85.10 38.60 3.
48.20 45.40 46.50 46.70 33.39 4.
37.60 40.80 39.10 39.17 31.86
[image:2.595.307.523.311.423.2]374 5.
25.60 25.00 25.60 25.40 28.10 6.
30.20 33.70 31.80 31.90 30.08 7.
39.10 33.90 33.90 35.63 31.04 8.
58.10 56.90 59.20 58.07 35.28 9.
45.60 47.20 43.20 45.33 33.13
Table 3: S/N ratio values for the three levels
Main effects of S/N
Response Table for Tensile strength and S/N ratio
jute
coir
Baggase
level
Raw
data S/N
Raw
data S/N
Raw
data S/N L1 73.87 37.01 54.87 33.96 59.92 34.80 L2 32.16 30.00 56.19 33.99 56.53 34.51 L3 46.34 33.12 41.31 32.18 35.91 30.82 Diff. 41.71 7.01 14.88 1.81 24.01 3.98
Ran k
1 1 3 3 2 2
It is clear from Figure 4(a) the tensile strength of composite increases slightly while moving from level 1 to level 2 with the increasing content of coir, and then decrease rapidly with increasing content of the fiber. From figure 4(b) it was depicted that the tensile strength of the fiber glass reinforced composite decreases with the increasing content of baggase fiber. it is also observed that the rate if decreasing strength is more from level 2 to level 3.
Figure 4(a)
Figure 4(b)
Figure 4(c)
Figure 4 Effect of process parameters on tensile strength and S/N ratio (main effects). (a) Effect of jute content on raw data and S/N ratio; (b) Effect of coir content on raw data and S/N ratio and (c) effect of baggase size on raw data and S/N ratio
From figure 4(c) it is clear that the tensile strength of the fiber glass reinforced composite decreases with the increasing content of baggase fiber.it is also observed that the rate if decreasing strength is more from level 2 to level 3. The possible reason for this is that the short bagasse fiber provides interlocking with glass fiber and thus the later is firmly fixed in the former. This could increase the effective stress transfer at the interface. The effect of bagasse fiber size may also play a very important role to influence the tensile strength as large fiber of bagasse may cause more voids and crack propagation.
[image:3.595.146.557.104.460.2] [image:3.595.73.295.580.720.2]375 data is greater than F-Ratio table. The % contribution
of each factor was also calculated and shown in the tables.
Table4: analysis of Variance for Tensile Strength (Raw Data)
Table 5: d analysis of Variance for Tensile Strength (S/N Ratio)
So
u
rc
e
SS DOF V F-Rat
io
P F T
ab
le
Jute 74.056 2 37.028 531.44 67.2 19
Coir 6.4365 2 3.2182 46.18 5.84
Baggase 29.564 2 14.782 212.16 26.8
Error 0.1393 2 0.0696 0.12
T 110.19 8 100
*Significant at 95% confidence level.
SS: Sum of Squares; DOF: Degree of Freedom; V: Variance; SS’: Pure Sum of Squares.
Estimation of optimum performance characteristics: The optimum value of tensile strength was predicted at the selected levels of significant parameters A1, B2 and C1). The estimated mean of the response i.e. tensile strength was determined (Ross,1988; Roy, 1990) as Tensile strength
=A1+ B3 + C3 -2 T= 88.4 MPa Where
T : Overall mean of tensile strength = 50.79 MPa A1: Average tensile strength at the first level of jute content = 73.87 MPa
B2: Average tensile strength at the third level of coir content = 56.19 MPa
C1: Average tensile strength at the third level of baggase = 59.92 MPa
Estimation of optimum performance characteristics: The optimum value of tensile strength was predicted at the selected levels of significant parameters A1, B2 and C1). The estimated mean of the response i.e. tensile strength was determined (Ross, 1988; Roy,
1990) as
Tensile strength =A1+ B3 +C3 -2 T=88.4 MPa
where
T : Overall mean of tensile strength = 50.79 MPa A1: Average tensile strength at the first level of jute content = 73.87 MPa
B2 : Average tensile strength at the third level of coir content = 56.19 MPa
C1 : Average tensile strength at the third level of baggase = 59.92 MPa
Substituting the values of various terms in the above equation,
The 95% confidence interval of confirmation experiments (CICE) and of population
(CIPOP) was calculated by using the following equations:
(2) And
(3) where,
Fα(1, fe): The F ratio at the confidence level of (1 – α) against DOF 1 and error DOF fe
N: Total number of results = 27 (treatment = 9, repetition = 3)
R: Sample size for confirmation experiments = 3 Ve: Error variance = 10.449667 (Table 4), fe = error DOF = 20 (Table 4).
neff= =3.86
F 0.05(1, 20) = 3.4928 (Tabulated F value) So,
CICE = ±4.65 CIPOP = ±3.075
The predicted optimal range (for a confirmation runs of three experiments) is:
Mean tensile strength- CICE< tensile strength< Mean tensile strength + CICE
=83.75< tensile strength<93.05
So
u
rc
e
SS Do
F
V F-Ra
ti
o
P F T
a
bl
e
Jute 8095.84 2 4047.92 387.37 64.4 3.49
Coir 1220.54 2 610.27 58.40 9.71
Baggase 3039.88 2 1519.94 145.45 24.1
Error 208.99 20 10.44 1.66
T 12565.2 26 100
*Significant at 95% confidence level.
SS: Sum of Squares; DOF: Degree of Freedom; V: Variance; SS’: Pure Sum of Squares.
N
376 The predicted optimal range for the population is as
follows:
Mean tensile strength – CI pop< tensile strength< Mean tensile strength + CI pop
=83.325< tensile strength<91.475
The optimal values of process parameters for the predicted ranges of Tensile strength are as follows:
first level of jute content = 10 gm
second level of coir content = 12 gm
the first level of baggase = 5 gm
Confirmation Experiments
Three confirmation experiments were conducted at the optimum setting of the process parameters. The jute content was taken at the first level (A1), coir content was taken at the second level (B2) and baggase was kept at the first level (C1). These all fillers are mixed properly and 15% of the resin weight of filler mixture was mixed in resin. Then the composite strip was fabricated with this resin filler compound and keeping the resin & fiber ratio and other process parameter constant. Three specimens were cut from this strip and tensile tests were performed on universal testing machine. The average tensile strength of test was found 89.6 MPa, which was within the confidence interval of the predicated optima of tensile strength. Table 6: Result of confirmation test
SAMPLE NO. TENSILE STRENGTH (MPa)
1 91.2
2 88.9
3 88.7
4. CONCLUSION
The effect of three fillers Bagasse fiber, Carbon black and CaCO3 on tensile strength of the fiber glass reinforced composite was investigated. The following conclusions can be drawn from the study:
1. The predicted optimal range for tensile strength is CIPOP: 85.325< tensile strength<91.475
2. The 95% confidence interval of the predicted mean for tensile strength is 83.75< tensile strength<91.475
3. The tensile strength of composite increases slightly while moving from level 1 to level 2
with the increasing content of coir, and then decrease rapidly with increasing content of the fiber.
4. The tensile strength of the fiber glass reinforced composite decreases with the increasing content of baggase fiber.it is also observed that the rate if decreasing strength is more from level 2 to level 3.
The tensile strength of the fiber glass reinforced composite decreases with the increasing content of baggase fiber.it is also observed that the rate if decreasing strength is more from level 2 to level 3. The possible reason for this is that the short bagasse fiber provides interlocking with glass fiber and thus the later is firmly fixed in the former. This could increase the effective stress transfer at the interface. The effect of bagasse fiber size may also play a very important role to influence the tensile strength as large fiber of bagasse may cause more voids and crack propagation
REFERENCES
[1] Chand, N., Dan, T. K., Verma, S., and Rohatgi, P. K. (1987). Rice husk ash filled—polyester resin composites. Journal of materials science letters, 6(6), 733-735.
[2] Dhawan, V., Singh, S., and Singh, I. (2013). Effect of natural fillers on mechanical properties of GFRP composites. Journal of Composites, 2013.
[3] Cao,Y., and Fukumoto, I. (2007). Evaluation of Mechanical Properties of Injection Molding Composites Reinforced by Bagasse Fiber. Journal of Solid Mechanics and Materials Engineering, 1(10), 1023-1029.
[4] Saw, S. K., and Datta, C. (2009). Thermo mechanical properties of jute/bagasse hybrid fiber reinforced epoxy thermoset composites. BioResources, 4(4), 1455-1475.
[5] Gupta, A., Singh, H., & Walia, R. S. (2014). Effect of glass fiber and filler volume fraction variation on mechanical properties of GFRP composite. In Proceedings of the International Conference on Research and Innovations in Mechanical Engineering (pp. 407-414). Springer, New Delhi.
[6] Gupta, A., Singh, H., & Walia, R. S. (2015). Effect of fillers on tensile strength of pultruded glass fiber reinforced polymer composite.
[7] Gupta, A., Singh, H., & Walia, R. S. (2016). Hybrid filler composition optimization for tensile strength of jute fiber-reinforced polymer composite. Bulletin of Materials Science, 39(5), 1223-1231.
377 fiber composite, international journal of advance
research in science and engineering,5(1).144-151.