FROM CONTAMINATED WATER USING PYRO-PROCESSED COCONUT SHELL AND FIBER
TITUS MUNYAO KASIMU I56/CE/21187/2012
A Thesis Submitted in Partial Fulfillment of the Requirements for the Award of the Degree of Master of Science (Chemistry) in the School of Pure and Applied Sciences
of Kenyatta University
DECLARATION Declaration by Candidate
I hereby declare that this thesis is my original work and has not been presented for a degree in any other university or any other award.
Titus Munyao Kasimu I56/CE/21187/2012
Signed: Date:
We confirm that the work reported in this thesis was carried out and submitted with our approval as University supervisors.
Dr. Harun Mbuvi
Department of Chemistry
Kenyatta University, Nairobi, Kenya
Signed: Date:
Dr. Margaret Mwihaki Ng’ang’a Department of Chemistry
Kenyatta University, Nairobi, Kenya
DEDICATION
ACKNOWLEDGEMENTS
I am grateful to the Almighty God for granting me good health and strength to complete my postgraduate studies. In addition, I thank my supervisors Dr. Harun Mbuvi and Dr. Margaret Ng‟ang‟a of Department of Chemistry, Kenyatta University for their support, encouragement, tireless intellectual and technical guidance which has been of great help in this research.
I thank the librarians at Kenyatta University for their support in literature research. I wish to acknowledge Mr. Katana Chengo for his advice during proposal writing and data collection. I also acknowledge Mr. Josphat Kyula and Ndunda Joseph for assisting in collection of materials used in this study and encouragement during thesis writing.
I am also grateful to lecturers and technical staff of Chemistry Department, Kenyatta University and staff of Department of Geology and Mines for their invaluable support during data collection.
I would also like to acknowledge the support I received from my colleagues at work and my course mates for supportive ideas and advice throughout the course. May God bless you all.
TABLE OF CONTENTS
DECLARATIONS ... ii
DEDICATION ... iii
ACKNOWLEDGEMENTS ... iv
TABLE OF CONTENTS ...v
LIST OF FIGURES ... viii
LIST OF TABLES ... ix
ABBREVIATIONS AND ACRONYMS ...x
ABSTRACT ... xi
CHAPTER ONE ...1
INTRODUCTON ...1
1.1 Background Information ...1
1.2 Statement of the Problem and Justification ...3
1.3 Hypothesis...5
1.4 Objectives of the Study ...5
1.4.1 General Objective ...5
1.4.2 Specific Objectives ...5
1.5 Significance of the Study ...5
1.6 Scope and Limitation of Study ...6
CHAPTER TWO ...7
LITERATURE REVIEW ...7
2.1 Water Pollution ...7
2.2 Water Remediation Methods ...9
2.3 Adsorbents ...11
2.4 Biosorbents ...12
2.4.1 Metal Biosorption ...12
2.5.2 Adsorption Process ...13
2.5.3 Adsorption of Heavy Metal Cations ...14
2.6.1 Properties ...16
2.6.2 Health effects ...16
2.7 Water Turbidity ...17
2.8. Properties of Activated Coconut Shell and its Fiber and there Activated Charcoal ...17
2.9 Analytical Techniques ...19
2.9.1 Turbiditimeter ...19
2.9.2 Flame Atomic Absorption Spectrometry (FAAS) ...19
2.9.3 pH meter...20
2.9.4 Centrifuge ...21
2.9.5 Infrared (FTIR) ...22
CHAPTER THREE ...23
MATERIALS AND METHODS ...23
3.1 Collection of sample materials...23
3.2 Chemicals and Reagents ...23
3.3 Preparation of Adsorbents...24
3.3.1 Activated Coconut Shell (ACS) ...24
3.3.2 Activated Coconut Shell Charcoal (ACSC) ...24
3.3.3 Activated Coconut Fiber (ACF)...24
3.3.4 Coconut Fiber Charcoal (CFC) and Activated Coconut Fiber Charcoal (AFC) ...25
3.4 Instrumentation ...25
3.5 Batch Adsorption Experiments ...25
3.6 Optimization of Sorption Parameters...26
3.6.1 Optimization of pH ...26
3.6.2 Optimization of Adsorbent Dosage ...26
3.6.3 Optimization of Contact Time ...27
3.6.4 Optimization of Initial Concentration of Lead and Cadmium Ions Removal ...27
3.6.5 Optimization of Temperature Changes of Pb2+ and Cd2+ Ions Percentage Removal28 3.7 Removal of Turbidity ...28
3.8 Removal of Methylene Blue ...29
CHAPTER FOUR ...31
RESULTS AND DISCUSSIONS ...31
4.1 FTIR Data ...31
4.2 Removal of Turbidity ...39
4.3 Removal of Methylene Blue ...41
4.4 Removal of Pb2+ and Cd2+ Ions...42
4.4.1 The Effect of pH on Pb2+ and Cd2+ Ions Percentage Removal ...42
4.4.2 Effect of Contact Time on the Adsorption of Pb2+and Cd2+Ions ...45
4.4.3 The Effect of Adsorbent Dosage in Pb2+ and Cd2+ Ions Percentage Removal ...48
4.4.4 Effect of Initial Metal Ions Concentration on the Adsorption of Pb2+ and Cd2+Ions50 4.4.5 The Effect of Shaking Speed on Pb2+ and Cd2+ Ions Percentage Removal ...53
4.4.6 Effect of Temperature Changes on Adsorption of Pb2+ and Cd2+ Ions ...55
4.4.7 Adsorption Isotherms ...58
CHAPTER FIVE ...62
CONCLUSIONS AND RECOMMENDATIONS ...62
5.1 Conclusion ...62
5.2 Recommendations ...63
REFERENCES ...64
LIST OF FIGURES
Figure Title Page
Figure 2.1 Adsorption of Successful use of natural materials 16
Figure 2.2 Chemical structure of methylene blue 21
Figure 4.1 FTIR spectrum of coconut fiber 31
Figure 4.2 FTIR spectrum of activated coconut fiber 34
Figure 4.3 FTIR spectrum of activated coconut fiber lead saturated 35
Figure 4.4 FTIR spectrum of coconut shell 37
LIST OF TABLES
Table Title Page
Table 2.1 Adsorption of successful natural materials 15 Table 2.2 physical properties of methylene blue 16 Table 4.1 Functional groups analysis of the coconut fiber, activated coconut
fiber and activated coconut fiber saturated with lead
32
Table 4.2 Functional groups analysis of the coconut shell, activated coconut shell and activated coconut shell saturated with lead
35
Table 4.3 Langmuir and Freundlich isotherm constants for Pb2+ ions adsorption by activated coconut shell and its fiber and there activated charcoal
59
Table 4.4 Langmuir and Freundlich isotherm for.Cd2+ ions adsorption by activated coconut shell and its fiber and there activated charcoal
60
Table 4.5 Langmuir and Freundlich isotherm constants for colour adsorption by activated coconut shell and its fiber and there activated charcoal
ABBREVIATIONS AND ACRONYMS
AC Activated Carbon
ACF Activated Coconut Fiber
ACFC Activated Coconut Fiber Charcoal ACS
ACSC CFC
Activated Coconut Shell
Activated Coconut Shell Charcoal Coconut Fiber Charcoal
CSC Coconut Shell Charcoal
FAAS Flame Atomic Absorption Spectroscopy FTIR Fourier Transform Infrared Spectrum NTU Nephelometric Turbidity Units
pH Power of Hydrogen
PC Platinum Cobolt
UN United Nations
ABSTRACT
Water is essential for all domestic and development activities worldwide. It‟s continues contamination by heavy metals is a major concern to many developing countries, Kenya included as they are non-biodegradable and toxic. This is expected to increase in tandem with the projected population and industrial growth. Therefore, it is important to systematically minimize the percentage concentration of the heavy metal ions in waste water before use or discharge into water bodies. Methods in operation for removal of the heavy metal ions in wastewater include: chemical coagulation, ion-exchange, electrochemical, adsorption, membrane process and ultra-filtration. Most of these methods are uneconomical due to high costs, extremely highly toxic sludge and inefficient removal of heavy metals. This motivated the current research work to explore simpler methods of wastewater treatment that can be economically viable and environment friendly in arid and semi-arid regions in developing countries. Coconut shell and its fiber are locally available agricultural waste which can be converted by activation into adsorbents for water remediation due to its fineness and large surface area. The present study was set to investigate the potential of activated coconut shell, fiber and their charcoals to remediate water contaminated with Pb2+ and Cd2+ ions, methylene blue and turbidity. Coconut shell and fiber adsorbents were activated with sodium hydroxide while charcoal was obtained by burning shell and fiber which had been soaked in phosphoric acid in limited air. The ability of adsorbents to adsorb lead (II) and cadmium (II) ions from wastewater was investigated by carrying out batch experiment and varying parameters such as initial concentration, adsorbent dose, contact time, agitation speed, temperature and pH were varied. Fourier Transform Infrared Spectrum analysis detected presence of functional groups of COO¯, O-H, C=O, C-O-C and RNO2 in adsorbents upon
CHAPTER ONE INTRODUCTON 1.1 Background Information
Water quality in the developing countries continues to deteriorate leaving out a large population of the world with no access to sufficient safe and clean drinking water (Thompson et al., 2003). In 2008, the World Bank estimated that 3,550,000 people die annually from unintentional water poisoning worldwide (Mbugua et al., 2014). Two-thirds of the cases are found in developing countries and hence additional treatments are required in areas where these chemical contaminants are prevalent (Hoekstra et al., 2012). This water scarcity situation is bound to become more problematic in the near future due to the projected population growth, increasing usage of water and geographical disparities between different locations. High population growth rate both in rural and urban areas as a result of improved health care has destroyed water supply systems (Schroter et al.; 2005).
infrastructure and high inflation rates in economy has hindered access to clean water by the poor in many developing countries.
There has been remarkable growth in light and informal (jua kali) industries like textiles, leather, paper, plastics, electroplating, cement, metal processing, wood preservatives, paints, pigments and steel fabricating industries. These industries discharge large quantities of poisonous wastes to water bodies making water unhealthy for domestic use (Chengo et al., 2013). Studies in Kenya showed that the open-air mechanical workshops are significant sources of mobile and bioavailable heavy metal contaminants (Chengo et al., 2013). Several studies suggest that among the heavy metals, pollution associated with lead ions is of key concern in Kenya (Elamin et al., 2013; Muiruri et al., 2013; Muinde et al., 2013) and Africa (Akoto et al., 2008; Amouei et al., 2014). Lead is a non-essential element and poisonous even at very low concentration levels of exposure resulting to impairment of nervous system and its effect on foetus, infants and young children, ischemic heart disease, testicular atrophy, anemia and interstitial nephritis (Tong et al., 2000). People have reported nausea and vomiting at a level of 15 mg/L of lead, with no negative impacts at 0.05 mg/L (Levin et al., 2008).
Methylene blue exposure in the environment may result to eye burns and irritation to the skin on animals and human beings (Jiuhui, 2008). Several processes used to remove turbidity and dissolved heavy metals include ion exchange, precipitation, ultrafiltration, reverse osmosis, electro dialysis, filtration and sedimentation (Scott and Ollis., 1995), which are not cost effective.
Coconut shells and their fibers are agricultural waste available in large quantities throughout the tropical countries. In Kenya, they are found along the coastal region, currently burning is the only way of disposal which contributes significantly to CO2 and
methane emission which are pollutants to environment (Foo et al., 2010). When allowed to settle in water ponds they became breeding places for mosquitoes. Due to economic and environmental problems, effort should be directed towards utilization, storage and disposal of coconut shells and their fibers. Current methods for water treatments are expensive and they are not effective in remove of heavy metal impurities such as lead, copper, mercury and cadmium ions, suspended particles and methylene blue from wastewater (Foo et al., 2010).
1.2 Statement of the Problem and Justification
it not safe for human use (rosegrant et al., 2002). Suspended particles in drinking water affect its turbidity. There is need to minimize levels of heavy metals, methylene blue and suspended particles from wastewater to acceptable limits. Enough and clean safe water supply system is the key factor in ensuring health working community (Fewtrell et al.,
2005). Coconut shell and its fiber are agricultural waste occupying a large portion of coastal region in Kenyan resulting to poor drainage systems, breeding places for mosquitoes causing malaria which reports high death rates in the world. Previously coconut shell was burnt as a means of solid waste disposal which contributes to carbon (IV) oxide and methane emissions.
1.3 Hypothesis
Activated coconut shell, its fiber and charcoal are potential adsorbents for removal of Pb2+ ions, Cd2+ ions, turbidity and methylene blue from contaminated water.
1.4 Objectives of the Study 1.4.1 General Objective
To determine efficiency and capacity of coconut products in removal of Pb2+ and Cd2+ ions, turbidity and methylene blue from contaminated water.
1.4.2 Specific Objectives
i) To identify the functional groups using FTIR in coconut shell, fiber and their activated products that are involved in adsorption of cations
ii) To determine efficiency percentage removal of Cd2+ and Pb2+ ions from wastewater using activated coconut shell and its fiber and their activated charcoal at varying parameters
iii) To determine the optimum adsorption capacities of the activated coconut shell and its fiber and their activated charcoal on Pb2+ and Cd2+ ions in water
iv) To determine the efficiency of the activated coconut shell and its fiber and their activated charcoal towards removal of methylene blue and turbidity
1.5 Significance of the Study
mosquitoes which cause higher percentage death rates due to malaria infections. This will lead to healthy population, improved economy while restoring the ecological environment as in line with the UN millennium development goals.
1.6 Scope and Limitation of Study
CHAPTER TWO LITERATURE REVIEW 2.1 Water Pollution
Water is considered as the most crucial of all natural resources and a source of life. Water covers 70% earth‟s surface with approximately 98% of this water being seawater which is not usable for drinking as a result of high salt concentration (Kumar et al., 2012). Water scarcity is likely to increase in the near future (Kumar et al., 2012) with deterioration of water quality in unindustrialized countries, where an estimated 2.4 billion people have no access to potable quality water (WHO, 2015). Kenya is a water scarce country where most county governments are unable to supply their population with sufficient water (Wanyiri et al., 2013). In 2006, total water available in Kenya was 20,291m3 (UN/WHO, 2006) and water availability was estimated as 650m3/year per capital, and could drop to about 350m3 per year by 2020. There is increasing dominance of contaminated water balance with dropping per capital aid of fresh water availability (WHO, 2015).
and suspended particles is also a source of many diseases (Kim et al., 2003; Crump et al., 2004; Mohammadian et al., 2010).
Water bodies are being polluted by various types of waste matter. The rate of arsenic, lead, cadmium, zinc, nickel and chromium metal ions concentration intensities in water are exceeding acceptable levels, making it unhealthy to human and living organisms consumption (Alloway, 1998; Morais et al., 2012). Metals ions are immobilized and absorbed through leaching from waste dumps, polluted soils and water then passed through food web. The metal ions concentration increases as food chain moves from one lower level to the next higher level (Sridhara et al., 2008). Heavy metals are non-biodegradable, once consumed cannot be excreted by the body in living organisms. This as long-term effect causing health problems to man and aquatic lives even at lower concentrations (Chipasa, 2003). Analysis of heavy metals concentrations in water near and within Ngara garage was found to be significantly high than the minimum allowed limits indicating pollution (Chengo et al., 2013). Main contribution of heavy metal pollution to the rivers is from urban run-off, domestic sewage and industrial waste waters (Ochieng et al., 2007).
The current WHO drinking water standard for lead is 0.1 mg/L dosage above which is poisonous and is the major contributing factor to the cause of cancer and heart diseases (Tong et al., 2000; Jarup, 2003). Pollution due to cadmium has increased by a factor of 14 in the last decade (Ahmed et al., 1998). It‟s widely found in nature and present in air,
cadmium ions may cause cancer in human and kidney damage (Elst et al., 2007). It can also cause renal damage, hypertension and testicular entropy (Tilaki et al., 2004). Clean safe water comprises of both aesthetic and health anxiety depending on the chemicals present (WHO, 1997). Treated water has acceptable taste and oduor, free from harmful chemicals, microbes and aesthetically pleasing. (Kawamura, 2000; Rai et al., 2002; Rezaee et al., 2008). Adsorption techniques at solid substrate is mostly used due to its high efficiency, easy to operate, cost effectiveness and readiness of different adsorbents (Rao et al., 2000).
2.2 Water Remediation Methods
Ion exchange is one of the water treatment method whereby one or more undesirable soluble ion pollutants are removed from water through exchange with another soluble ion of the same electrical charge ( Mollah et al., 2001; Alguacil, 2003). It is effective method used to remove cadmium from waste water (Bay and Bartkiewicz, 2009). Rate of matrix saturation by organics and other solids in the contaminated water is high when intense metal ions are used and also sensitive to the pH of the solution making process unsuitable (Babel et al., 2006).
and sea water (Amado et al., 2008). However there is formation of metal hydroxides, which clog the membrane lowering its effectiveness (Elmidaoui et al., 2001).
Flotation is a process that involves producing small air bubbles in the water being treated when mixed with frothing agent. Impurities are attached to bubbles produced by coagulation and flocculation to form froth which floats on surface before being removed (Emamjomeh and Sivakumar, 2009). Flotation method is more effective than other methods in purification of wastewater due to its, fast start up, high rate operation, and a thicker sludge. Method required high reagent, unpredictable metal ion removal make it unpopular (Babel and Kuraniwan, 2003).
Complexation is removal of metal ions from solution may by complex formation on the cell surface after the interaction between the metal and the active groups. Micro-organisms may also produce organic acids such citric, oxalic, gluonic, fumaric, lactic and malic acids, which may end up chelating toxic metals resulting in the formation of metalloorganic molecules. These organic acids help in the solubilisation of metal compounds and their leaching from their surfaces (Volesky, 1995).
2.3 Adsorbents
An adsorbent is a substance typically spongy in nature with a large surface area that can absorb substances onto its surface by intermolecular forces (Chaudhari and Khairuldin, 2009). They have very high attraction to certain ions or ion groups and have shown outstanding properties like, high selectivity and resistance to deprivation, high temperatures and high intensities of radiation (Abdel et al., 2007). During adsorption, solutes distribute themselves between the adsorbent surface and the dispersing medium. Due to the presence of functional groups, sorbents can be derivertised to improve their efficiency and increase their adsorption capacity (Hong et al., 2002).
Surface complexation models are planned chemically to calculate standards of thermodynamic properties mathematically (Pagnanelli et al., 2004).
2.4 Bio-adsorbents
Biosorbents are living and dead biomass as well as cellular products such as polysaccharides that can be used for binding metal ions. Biosorbents unlike other conventional water treatment materials contain several binding organic groups which can be modified to increase their adsorptive capacity for metal removal. They are of low cost, high efficiency, minimum chemical and physical sludge no additional nutrient requirement, they can be regenerated and they have high possibility of metal recovery (Ahalya et al., 2003). A range of absorbents such as orange peel, grass leaf, wheat shells, heartwood, rice husk, saw dust of various plants, bark of the trees, groundnut shells, coconut shells, black gram husk, hazelnut shells, walnut shells, cotton seed hulls, waste tea leaves, Cassia fistula leaves, maize corn cob, beans, and sugarcane bagasse have been reported to be used to remove or recover heavy metals from aqueous solutions (Garg et al., 2008).
2.4.1 Metal Biosorption
effective biosorbent material for the removal of metal ions from aqueous solutions. It has advantages over other methods such as low operating cost, minimization of the volume of chemical and high effectiveness in detoxifying much diluted wastes (Hajar, 2009).
Modification of adsorbent to improve its properties in order to remove heavy metals from contaminated waters can be done by introducing a functional group to the adsorbent (Suedee, et al., 2006). The surfaces of most natural adsorbents and synthetic (for example activated carbon) adsorbents are covered by functional groups such as hydroxyls, sulfonics, phosphates and amines (Szabo et al., 2006). It is important to strongly bind metal ions on the adsorbent surface.
2.5.2 Adsorption Process
Adsorption is the ability of the adsorbate to adhere or attach to the adsorbent (Garg et al.,
2008). The degree of adsorption capacity is evaluated using the Langmuir, Freundlich, Dubinin-Radushkevich and Temkin adsorption isotherms (Shokoohi et al., 2009). Adsorption isotherm is the elementary requirement for designing any adsorption system. Isotherm definite the relation between the amounts of adsorbate removed from liquid phase by unit mass of adsorbent at constant temperature (Ansari and Mohammad, 2009). Adsorption techniques have proved to be more reliable, economical and effective in the metal ion removal. (Choy et al., 1999).
hand Freudlich isotherm was first empirical in nature but was later interpreted as biosorption to heterogeneous surface or surface supporting sites of different affinities and has been used widely to fit experimental data (Oubagaranadin et al., 2007).
2.5.3 Adsorption of Heavy Metal Cations
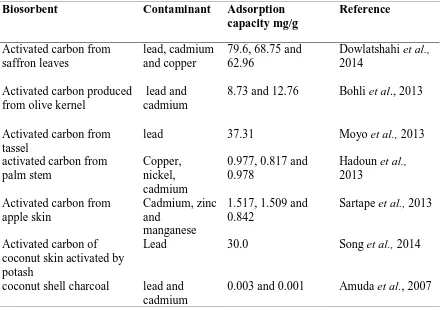
Table 2.1: Adsorption of Successful use of natural materials
Biosorbent Contaminant Adsorption
capacity mg/g
Reference
Activated carbon from saffron leaves
lead, cadmium and copper
79.6, 68.75 and 62.96
Dowlatshahi et al.,
2014 Activated carbon produced
from olive kernel
lead and cadmium
8.73 and 12.76 Bohli et al., 2013
Activated carbon from tassel
lead 37.31 Moyo et al., 2013
activated carbon from palm stem
Copper, nickel, cadmium
0.977, 0.817 and 0.978
Hadoun et al.,
2013 Activated carbon from
apple skin
Cadmium, zinc and
manganese
1.517, 1.509 and 0.842
Sartape et al., 2013
Activated carbon of coconut skin activated by potash
Lead 30.0 Song et al., 2014
coconut shell charcoal lead and cadmium
0.003 and 0.001 Amuda et al., 2007
2.6 Methylene Blue
Methylene blue (1) is a compound consisting of dark green crystal, used in various ways in industries, which include coloring paper, temporary hair colorant, treatment of cyanide poisoning, bacteriologic, indicator, dyeing cottons and wools (Rastogi et al., 2003).
S N
N CH3 CH3 + Cl -N
H3C H3C
1
2.6.1 Properties
Table 2.2: physical properties of methylene blue Chemical formula C14H18N3SCl
Molecular weight 319.85 g/mol
Melting point 373 K-383 K
Type of dye Basic blue
Boiling point Decomposes
Maximum wavelength 665 nm Refractive index 1.347
density 1.0 g/mL at 293 K
solubility Soluble in water, ethanol, ethylene
2.6.2 Health effects
Methylene blue can cause eye burns in humans and animals, methemoglobinemia, cyanosis, convulsions, tachycardia, dyspnea, irritation to the skin, and if ingested, irritation to the gastrointestinal tract, nausea, vomiting, and diarrhea. Therefore, it is important to remove methylene blue from wastewater before discharge. Adsorption is widely used to remove pollutants from wastewaters of textile, paper printing and other industries wastes. Commercial activated carbon are referred as adsorbents for colour but its high cost led researchers to look for alternative low cost renewable sources, biomas and effective adsorbents from agricultural wastes, clays and zeolites for water remediation.
1993b; Namasivayam and Kanchana 1993a). Tamarind fruit shell (Papita, 2010) have been used as a basis of the production of activated carbon for the removal of textile dye effluent. However, there are no reports of activated coconut shell and its fiber and their activated charcoal on adsorption of methylene blue from contaminated water.
2.7 Water Turbidity
Turbidity is a major physical characteristic that expresses water‟s optical property to scatter and absorb rather than transmit light (Palanques et al., 2001). This is caused by suspended impurities such as clay, silt, microscopic inorganic and organic matter, soluble colored compounds, plankton and other microscopic organisms. Turbidity in drinking water activates growth of pathogens in water systems resulting into outbreak of waterborne diseases which is a health concern (Davies and Smith, 2001). Although it is not a direct pointer of health issues there is relationship between turbidity removal and protozoa (Anderson et al., 2005; Pichler et al., 2012). Methods mostly employed to remove turbidity include coagulation, flocculation, sedimentation and filtration which are not cost effective (Scott and Ollis., 1995). Rice husk which is inexpensive and abundant material has been used effectively as adsorbent in the removal of turbidity in waste water containing dyes, phenols and pesticides (Hamaruzzama and Gupta, 2011).
2.8. Properties of Activated Coconut Shell and its Fiber and there Activated Charcoal
moissanite (SiC) 16% (Chandra et al., 2009). They also contain proteins, carbohydrates and phenolic compounds which have carboxyl, hydroxyl, sulfate phosphate and amino groups that are found to be most effective adsorbent (Chandra et al., 2009).
Coconut shell consists of Mg, Al, Si, Fe, P, in its chemical composition and the following oxides have been confirmed Si, AI, Mn, Fe, Ca, K, Mg, Na and Zn with percentages composition of 45.05%, 15.61%, 0.22%, 12.4%, 0.57%, 0.52%, 16.2%, 0.45% and 0.3% respectively (Chandra et al., 2009). Carbon, sulphates and traces of other elemental oxide have also been reported (Chandra et al., 2009). Coconut shells are insoluble in water, good chemical stability and high mechanical strength. It‟s granular in structure, distinctive chemical composition, locally available, renewable and effective in metals ions remediation making it a potential adsorbent material for heavy metals ions from polluted water (Abdel et al., 2007).
Activated carbon is extremely permeable material with different hollow structures and can allow molecules to enter the pores of their carbon (Shah and Jadav, 2012). The fundamental building elements of carbon are SiO2 and Al2O3 tetrahedral. Adjacent
2.9 Analytical Techniques 2.9.1 Turbiditimeter
Turbidity is measured using a turbid meter (Omar and MatJafri, 2008). A turbid meter consists of a light source that illuminates a water sample and a photoelectric cell that measures the intensity of light scattered at a 90 angle by the particles in the sample. Light scattered by particles such as silt, clay, algae, organic matter and micro-organisms enables the detection of these particles in water. It measures turbidity in nephelometric turbidity units (Ahmad et al., 2010).
2.9.2 Flame Atomic Absorption Spectrometry (FAAS)
Atomic Absorption Spectrometry (AAS) is an analytical method based on the absorption of radiation energy by the atoms. When a dispersion of the molecules of a sample is generated in a flame, several of these atoms get excited thermally and release characteristic radiation as they return to the ground state level. Majority of them, nevertheless, remain in the ground state. When a light beam is made to pass via the flame, a part of it will be get absorbed by dispersed atoms. The wavelength of the band is characteristic of the atoms of the element concerned and absorbance of the band is proportional to the concentration of the particles in the flame (Skoog et al., 1982).
element; (ii) the emission beam from the radiation source is modulated; (iii) the modulated signal passes through the atomic vapour where the atoms of the analyte absorb radiation of the line-like radiation source; (iv) the desired spectral line (usually resonance lines) is selected by the monochromator; (v) the isolated analyte line falls onto the detector (a photomultiplier) where the signal is converted into the electric signal; (vi) the modulated signal is amplified by the selective amplifier; (vii) the signal is finally recorded by a readout device (Skoog, 1982).
Figure 2.2: Schematic Diagram of AAS Instrumentation
2.9.3 pH meter
solution. Second electrode is a glass electrode that consists of high resistance glass tube with a thin, low resistance glass bulb at the bottom. It encloses silver coated silver wire with wax insulation.
When the electrodes are dipped in the solution, the saturated solution of KCl comes out of the reference electrode through the small holes and forms an invisible ionic bridge between electrodes through which current passes. Hydrogen ions absorbed by glass electrode and electric potential develops between electrodes. This potential difference is measured in terms of pH by suitable galvanometer. The pH scale of the device is calibrated by at least two buffer solutions. One of the buffers used for calibration has pH 7.00 and the second is selected depending on the range where the measurements are to be taken 9.20 for basic solutions and 4.01 for acidic solutions. This correlates the measured potential of the indicator electrode with the pH scale.
2.9.4 Centrifuge
2.9.5 Infrared (FTIR)
CHAPTER THREE MATERIALS AND METHODS 3.1 Collection of sample materials
Coconut fruits were obtained from Mombasa County and transported to Kenyatta University laboratories. First they were cleaned with distilled water to remove mud and sand. The coconut fibers were removed, the hard shell broken and the soft part removed. The shells and fibers were air dried for three weeks at a room temperature (298 K).
3.2 Chemicals and Reagents
Analytical grade of Pb(NO3)2 and Cd(NO3)2 salts obtained from Sigma Aldrich company
were used for the preparation of the stock solutions of Pb2+ and Cd2+ ions respectively (Abdus, 2005). The standard solutions of lead and cadmium ions containing 1000 mg/L were prepared by dissolving 1.600 g lead nitrate and 2.745 g cadmium nitrate in 1000 mL of distilled water in volumetric flasks. The solutions were then diluted using formulae of C1V1 = C2V2 to obtain standard solutions of concentrations 2, 4, 6, 8, 10, 50 and 100
3.3 Preparation of Adsorbents 3.3.1 Activated Coconut Shell (ACS)
The shells were cut into smaller pieces and then crushed using a Sheller machine. A standard sieve of 4 -16 was used to sieve powder to the size of range 1.0 -5.0 mm. The resulting powder was activated by immersing into a 2 molar solution of sodium hydroxide for 24 hours for proper soaking then filtered, rinsed with distilled water and allowed to dry in the sun to dryness (Ansari and Mohammad, 2009).
3.3.2 Activated Coconut Shell Charcoal (ACSC)
Dry coconut shell powder was soaked in a 2M solution of phosphoric acid for 24 hours then filtered and dried in the sun. The resultant coconut shell powder was placed into an aluminum cylinder, the contents warmed to expel air and water vapor before the cylinder closed and then heated from the bottom. After heating for 12 hours, the contents were left to cool, cylinder opened and product inspected visually to determine fully carbonized shells. Shells that retained the brown color and those that were difficult to break by hand were removed saved for the next batch (Papita, 2010).
3.3.3 Activated Coconut Fiber (ACF)
3.3.4 Coconut Fiber Charcoal (CFC) and Activated Coconut Fiber Charcoal (AFC) Coconut fiber charcoal (CFC) was prepared by carbonizing dry coconut fiber powder. Activated coconut fiber charcoal (AFC) was prepared by first activating the coconut fiber powder with phosphoric acid followed by carbonizing as described in section 3.3.2.
3.4 Instrumentation
The resolution of Lead and Cadmium metal ions concentration were done using atomic absorption spectrophotometer model AAS 4141, ECIL, India in flame mode using air-acetylene flame as described by (Welz and Sperling, 1999; Donovan et al., 2002). A pH meter, model PHEP, Hanna instrument, Italy, was used to measure pH (Hammond et al., 2005). Turbidity meter, model 2100P (HACH) was used to determine the turbidity (Omar and MatJafri, 2008). Centrifuge is a device that separates a mixture of liquids due to their difference in densities and also liquids from solids detained in their suspension (Haeberle
et al., 2006).
The concentration of methylene blue in the solutions before and after adsorption were determined using a double beam UV-visible spectrophotometer (Cecil CE- 2041, 2000 ceries) at 664.5 nm Supermini 200 compact. FTIR machine, IRT Tracer 100 SHIMADZU was used to determine functional groups.
3.5 Batch Adsorption Experiments
aqueous solution of known concentration of lead and cadmium solutions in 120 mL plastic bottles containing a known mass of the adsorbent. Test solutions in plastic bottles were agitated at 120 rpm at a temperature of 25 oC. The pH of the test solution was adjusted to suitable pH values using nitric acid and sodium hydroxide. Masses of 1.0 g of ACS, ACSC, ACF, CFC and AFC were added to each of the solution and then stirred for 30 minutes to equilibrate. The solution was then centrifuged and the concentrations of the filtrates of Pb2+ and Cd2+ ions determined using flame atomic absorption spectrometry (FAAS).
3.6 Optimization of Sorption Parameters 3.6.1 Optimization of pH
The effect of pH on the percentage removal of Pb2+ and Cd 2+ was studied using 1.0 g of ACS, ACSC, ACF, CFC and AFC. The pH of the solutions were varied from pH 2 to pH 10 using 0.1 M nitric acid and 0.1 M sodium hydroxide solutions. At each pH, 1.0 g of the adsorbents were stirred with 50 mL of aqueous metal solutions containing 100 mg/L Pb2+ and Cd2+ s ions in a solutions respectively. The samples were stirred at a speed of 120 rpm for 3 hours. At the end of the contact time, samples were centrifuged and concentrations of Pb2+ and Cd2+ ions determined using flame atomic adsorption spectrometry.
3.6.2 Optimization of Adsorbent Dosage
concentration and pH were used. Initial concentrations of the aqueous metal solutions of Pb2+ and Cd2+ ions of 50 mL of 100 mg/L were used for varying doses of ACS, ACSC, ACF, CFC and AFC. Initial pH of the metal ion solutions were adjusted to their respective optimum pH using nitric acid and sodium hydroxide solutions. The experiments were conducted in triplicate and stirred for 3 hours in plastic bottles on the water bath shaker. At the end of the contact time, the samples were centrifuged and the concentrations of Pb2+ and Cd2+ ions were determined using flame atomic adsorption spectrometry.
3.6.3 Optimization of Contact Time
The percentage of Pb2+ and Cd2+ ions adsorbed at various contact time of 30, 60 90, 120, 150 and 180 minutes were investigated using 50 mL of 100 mg/L sample solutions in 120 mL plastic bottles. 1.0 g of ACS, ACSC, ACF, CFC and AFC was added to each bottle. The pH of the sample solutions were adjusted using 0.1 M nitric acid and 0.1 M sodium hydroxide solutions. The bottles were stirred on a shaker at 120 rpm. The solutions were then centrifuged and the filtrates subjected to atomic absorption spectroscopy to record the absorbance of Pb2+ and Cd2+ ions.
hydroxide and nitric acid respectively. Samples are removed from bath shaker after 2 hours then centrifuged. Concentrations of Pb2+ and Cd2+ ions were determined using flame atomic adsorption spectroscopy (FAAS). All runs were conducted in triplicates.
3.6.5 Optimization of Temperature Changes of Pb2+ and Cd2+ Ions Percentage Removal
The effect of temperature on Pb2+ and Cd2+ ions on the percentage of Pb2+ and Cd2+ ions adsorbed was investigated by agitating 50 mL samples of Pb2+ and Cd2+ solutions of 50 mg/L in 120 ml plastic bottles with 1.0 g of ACS, ACSC, ACF, CFC and AFC adsorbents with varying water bath shaker temperature of 293 K, 313 K, 333 K, 353 K and 373 K. The contact time was kept at 2 hours and initial pH of the test solution was set at pH 6 using 0.1 molar sodium hydroxide and 0.1 molar nitric acid. Samples were withdrawn after 2 hours and centrifuged. Concentrations of Pb2+ and Cd2+ ions were determined using FAAS. All runs were conducted in triplicates.
3.7 Removal of Turbidity
3.8 Removal of Methylene Blue
Methylene blue 1000 mg/L was prepared by weighing 1000 mg and dissolving it in 500 Ml of distilled water then adjusting to one litre. Dilution of solutions were done using formulae of C1V1 = C2V2 to obtain standard solutions of concentrations 100 mg/L. The
effect of quantity of ACS, ACSC, ACF, CFC and AFC on the amount of methylene blue adsorbed was studied by agitating 50 mL of coloured water with different amounts of sorbent of 0.1, 0.2, 0.5, 1.0 and 2.0 g for 3 hours. The solution was then filtered using whatman No. 1 filter paper and the colour in water was determined using UV Spectrophotometer at 650 nm. Experiments performed at a temperature of 298 K and a speed of 120 rpm maintained.
3.9 Data Analysis
The amount and percentage of Pb2+ and Cd2+ ions adsorbed were calculated using the equation 3.1 and 3.2 respectively. To calculate the sorption capacities of the adsorbents, analysis of metal sorption and methylene blue was fitted into Langmuir and Freundlich adsorption isotherm models using equation 3.4 and 3.6 respectively which are linearized (Freundlich, 1906; Langmuir, 1981).
V m
C C
qe o e
)
(
………...……equation 3.1
R = 100 ……….equation 3.2
Where, R= percentage removal
qe= Amount of metal ion removed per unit mass of adsorbent at equilibrium
Co = Initial concentration of sorbate
Ce = Concentration of sorbate at equilibrium m =mass of adsorbent used in grams
eq eq e
bC C bQ q
1 max
……….………equation 3.3
Its linearized form is represented by the following equation (Katircioğlu et al., 2008)
Ceq 1 Ceq
Qeq bQmax Qmax………..equation 3.4
Where qe is the amount of the metal ion adsorbed per gram of the adsorbent at equilibrium (mg/g), Ce is the solute concentration (mg/L) in aqueous solution at
equilibrium, qmax represents practical limitation adsorption capacity and b is an affinity
constant for binding sites (L/mg), Qmax is the adsorption capacity of the adsorbent (mg/g).
The equation 3.5 of Freundlich isotherm model can be linearized by taking logarithms and then applied on highly interactive species as in equation 3.6
Qe = Kf * Ce1/n ……….equation 3.5
Log (Qe) = log (Kf) + (1/n) log (Ce)………...equation 3.6
When log Qe is plotted against log Ce, log Kf is the intercept of the line and „1/n‟ the
slope of the linear line (Coles and Yong, 2006). The constant Kf is adsorption capacity
while „1/n‟ is a function of the power of adsorption in the process of adsorption. If n = 1 then the partition between the two phases are independent of the concentration. When the value of „1/n‟ is less than one it designates a normal adsorption (State and State, 2012). The gradient varies between 0 and 1 which is a surface heterogeneity or degree of adsorption intensity which becomes extra heterogeneous as it approaches to a zero value. While, a value lower than unity implies Chemisorption process. „1/n‟ above one is an indicative of cooperative adsorption (Shahbeig et al., 2013).
CHAPTER FOUR RESULTS AND DISCUSSION 4.1 FTIR Data
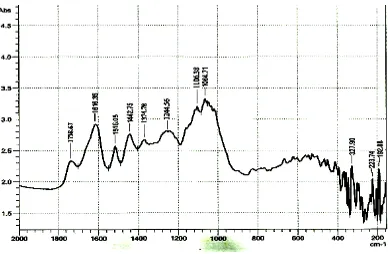
Analysis using FTIR was carried out to identify the functional groups present in the adsorbents as well as groups involved in metal ion binding. The following adsorbents were analyzed CF, ACF, ACF saturated with lead, CS, ACS, ACS saturated with lead in the range 4000-200cm-1 and the IR spectrum are shown in figures 4.1, 4.2, 4.3, 4.4, 4.5 and 4.6.
Figure 4.1: FTIR spectrum of coconut fiber
associated with aromatic ether C - O - CH3 while aromatic ring stretching C=C mode is
assigned to 1516.05 cm-1.
Sharp band at 1442.75 and 1374.78cm-1 are assigned to CH2 lignin in asymmetric
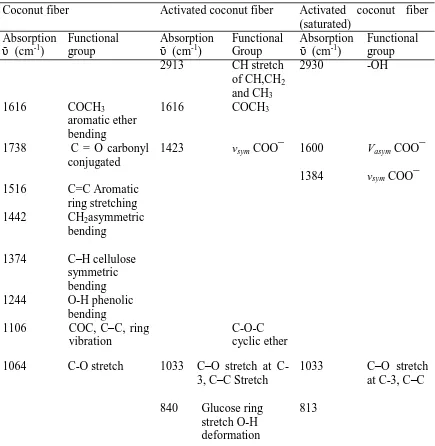
Table 4.1: IR bands functional groups analysis of CF, CFA and CFA saturated with lead.
Coconut fiber Activated coconut fiber Activated coconut fiber (saturated)
Absorption
ῡ (cm-1)
Functional group
Absorption
ῡ (cm-1)
Functional Group
Absorption
ῡ (cm-1)
Functional group 2913 CH stretch
of CH,CH2
and CH3
2930 -OH
1616 COCH3
aromatic ether bending
1616 COCH3
1738 C = O carbonyl conjugated
1423 vsym COO¯ 1600 Vasym COO¯ 1384 vsym COO¯ 1516 C=C Aromatic
ring stretching 1442 CH2asymmetric
bending 1374 C–H cellulose
symmetric bending 1244 O-H phenolic
bending
1106 COC, C–C, ring vibration
C-O-C cyclic ether 1064 C-O stretch 1033 C–O stretch at
C-3, C–C Stretch
1033 C–O stretch at C-3, C–C 840 Glucose ring
stretch O-H deformation
813
Figure 4.2 and table 4.1 shows FTIR spectrum of coconut fiber upon activation and functional groups associated with peaks. As shown, a new peak is observed at 2913 cm-1 associated with asymmetric stretch of CH, CH2 and CH3 in lignin. Glucose OH
1033 cm-1 but intensity of aromatic ether C -O-CH3 increases. This shows that more
active functional groups appeared on adsorbent (Parikh and Chorover, 2005).
Figure 4.2: FTIR spectrum of activated coconut fiber, CFA
disappeared while intensity of C–O stretch vibration decreased. This shows that the above functional groups are involved in binding of Pb2+ ions (Kazy et al., 2006, Parikh and Chorover, 2006).
Table 4.2: IR bands of functional groups in CS, ACS and ACS saturated with lead. Coconut Shell Activated coconut Shell Activated coconut Shell
(saturated) Absorption
ῡ (cm-1)
Functional Group
Absorption
ῡ (cm-1)
Functional Group
Absorption
ῡ (cm-1)
Functional group 2920 C-H stretch
of CH, CH2
and CH3
in lignin
2934 -OH
1743 Carboxylic C=O
1618 -C=C- 1608 COO¯ 1604 vsym COO¯
1516 C=C Aromatic 1508 RNO2
1444 -OH in carboxylic 1431 -OH
1335 CH2 cellulose, lignin 1384 C–H
cellulose, hemicellu lose
1249 O-H aromatic 1272 -O-H Phenolic
1118 -O-H Alcohols and ethers
1108 C-O-C stretching mode
1033 C-O stretch 1037 C-O stretch 1008
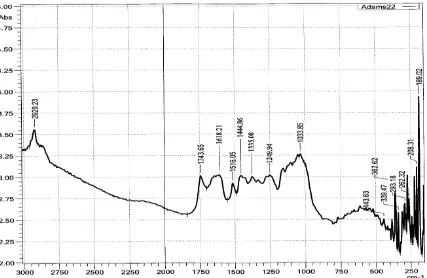
Figure 4.4 showed spectrum of coconut shell that has been dried at a temperature of 298 K. This spectrum gave sharp intense peak absorption band that exist on the wave number of 2920.23 cm-1 showing stretching vibration of C-H asymmetric stretch of CH, CH2 and
CH3 in lignin. Strong and sharp symmetric stretching vibration bands of C=O carbonyl in
and to O-H phenolic in bending mode while 1033.85 confirmed glucose C–O stretch vibration as in table 4.2.
Figure 4.4: FTIR spectrum of coconut shell (CS)
Figure 4.5 show FTIR spectrum of coconut shell upon activation. As shown, new more active peaks are observed at 1118.85, 2934 cm-1 and 1108.62 cm-1 associated with OH in alcohol and ether out of plane bending, CH of CH, CH2 and CH3 in lignin asymmetric
stretching vibrations and COC in ether stretching mode respectively. Phenolic -OH bending shifts from 1249 to 1272.58 cm-1, RNO2 asymmetric mode 1516 cm-1 shifts to
Figure 4.5: FTIR spectrum of activated coconut shell (CSA)
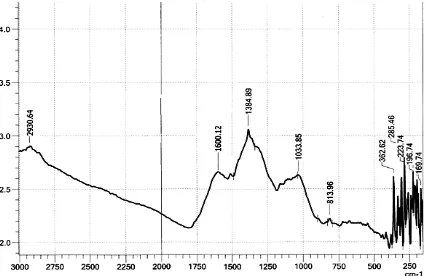
The FTIR spectrum in figure 4.6 shows the absorptions of the activated coconut shell (ACS) which was obtained on saturating activated coconut shell with lead ions and then allowing it to dry at room temperature. The spectrum showed shifts in some absorption peaks when compared with figure 4.5. Asymmetric vibration of COO¯ shifted from 1608.63 to 1604.77 cm-1 while RNO2 from 1508 cm-1 to asymmetric and symmetric mode
on wavelength of 1384 cm-1 and 1352 cm-1. The peaks at 2934.08 cm-1, 1508.33 cm-1, 1431.28 cm-1, 1272.58 cm-1, 1118.58 cm-1 and 1108.62 cm-1 disappeared completely. This shows that COO¯, RNO2 and -OH were completely involved in binding Pb2+ ions as
Figure 4.6: FTIR spectrum of activated coconut shell (ACS).lead saturated
4.2 Removal of Turbidity
0 10 20 30 40 50 60 70 80 90 100
0 . 1 0 . 5 1 1 . 5 2
% r e mo v a l o f su sp e n d e d p a rt ic le Dosage (g) CSA CSCA CFA CFC CFCA
Figure 4.7: The percentage removal of suspended particles from wastewater using 250 NTU of 50 mL turbid water shaking speed of 120 rpm, temperature of 298 K, and pH of 6 with 0.1, 0.2, 0.5, 1 and 2g of adsorbents for 3 hours.
above 1.5 g there was no significant difference in percentage removal. This show that increase in adsorbent dose increases rate of settling and aggregation of suspended particles resulting into improved turbidity of less than 5 NTU in all adsorbents but more than 1.5 g of adsorbent results into dispersion of settled and aggregated particles (Mishra
et al., 2004; Chaudhari et al., 2009).
4.3 Removal of Methylene Blue
The experiments were performed using 0.1, 0.2, 0.5, 1.0 and 2.0 g of ACS, ACSC, ACF, CFC and AFC as adsorbents, agitation speed 120 rpm, contact time 3 hours at 50 mg /L initial concentrations of methylene blue and temperature of 298 K as represented in figure 4.8.
Figure 4.8 showed that adsorbent dose increases with percentage removal of methylene blue, from 50.3% to 89.7% for ACS when dosage increased from 0.1 to 0.5 g then decreased to 50.3% when 2 g of adsorbent were used. While percentage removal increased from 72.3% to 98.99% for ACSC, 60.3% to 96% for ACF, 65.77% to 93.15% for CFC, 73.2% to 99.9% for ACFC when 1.0 g of adsorbent were used. The data showed no statistical significant difference when adsorbent increases above 1 g as at 95% confidence level. Similar results were reported by Alzaydien (2009). ACFC is more effective than other adsorbents by removing 99.9% of the dye. According to water Bureau of Standards, colour for drinking water should be below 15 pc (platinum cobalt) so adsorbents removed colour even below 0.1 platinum cobalt WHO 1996. Increase in adsorbent dose results in large amount of adsorbed dye as a result of increased number of adsorption sites and large surface area. Decrease in adsorbed amount of methylene blue is associated to overlapping of adsorbent surface area available to dye and increased diffusion path distance (Garg et al., 2008).
4.4 Removal of Pb2+ and Cd2+ Ions
4.4.1 The Effect of pH on Pb2+ and Cd2+ Ions Percentage Removal
0 10 20 30 40 50 60 70 80 90 100
2 4 5 6 7 8 1 0
% R em ov al of le ad (ii ) ion s pH CSA CSCA CFA CFC CFCA
Figure 4.9: The effect of pH on Pb2+ ions percentage removal using 1.0 g of adsorbent, contact time of 3 hours, shaking speed of 120 rpm, temperature of 298 K and initial metal ion concentration of 50 mg/L in 50 mL of solution.
0 10 20 30 40 50 60 70 80 90 100
2 4 5 6 7 8 1 0
% R em ov al of c admium (ii ) ions pH CSA CSCA CFA CFC CFCA
Results in figure 4.9 and 4.10 showed that, the percentage removal of Pb2+ ions by ACS, ACSC, ACF, CFC and ACFC were 40.8%, 51.6%, 53.1%, 68.3% and 74.9% respectively at pH 2 and 97.5%, 98.2%, 98.9%, 99.1 and 99.9% respectively at pH 6, followed by percentage removal decreased to 68.3%, 85.2%, 72.4%, 81.4% and 75.0% at pH 10 respectively. The percentage removal of Cd2+ ions by ACS, ACSC, ACF, CFC and ACFC were 52.2%, 57.2%, 74.5%, 78.0% and 62.3% respectively at pH 2, 99.5%, 97.7%, 97.5%, 99.4 and 99.0% respectively at pH 6. The percentage removal then decreased to 81.3%, 72.4%, 62.4%, 57.6% and 52.0% at pH 10 respectively. Statistical data showed significance difference at pH 2 and 6 of ACF, ACSC and ACS in the percentage removal of Pb2+ ions by adsorbents at 95% confidence level. When pH values are lower than 2, there is low rate removal of metal ions due to increased number of vacant phosphate groups on activated surfaces, protonation of the active sites at the adsorbents surface, preventing adsorption of metal ions by adsorbate (Zeid and Li. 2011). Between pH values 4 and 7, number of vacant sites increases as linked H+ ions are released from adsorbate facilitating high rate of metal ions adsorption. Solubility of metal ions is very high at lower pH values, increasing their adsorption (Olayinka et al., 2009).
Precipitation of metal hydroxides is formed at higher pH values. This indicates that removal of metal ions at higher pH values might be due to precipitation relatively to adsorption (Patnukao et al., 2008). Rate of adsorption at pH values above 7 decreases due to the formation of soluble metal hydroxyl complexes (Amuda et al., 2007). Lower retention of metals ions in more acidic situation is due to high competitive exchange rate of H+ ions and metal ions. Net positive charge results due to presence of H+ and H3O+
cations for the vacant sites on the adsorbent surface, causing partial discharge of these cations (Sheta et al., 2003). As more negative charges on the surface increases with pH increase facilitating greater metal ions uptake (Gong et al., 2005; Katircioğlu et al., 2008). Adsorption optimum pH removal for Pb2+ and Cd2+ ions are better executed at moderate pH between 5 and 6.
4.4.2 Effect of Contact Time on the Adsorption of Pb2+and Cd2+Ions
The effect of percentage removal of Pb2+ and Cd2+ ions as contact time was varied from 30 to 180 minutes at pH of 6, stirring speed of 120 rpm, temperature of 298 K and initial metal ion concentration of 50 mg/L for 1.0g of ACS, ACSC, ACF, CFC and ACFC is presented in figure 4.11 and 4.12. This was done to determine optimum time for the interaction between metal ions and adsorbents to attain equilibrium.
Figure 4.11: The effect of contact time on Pb2+ ions percentage removal using 1.0 g of adsorbent, pH 6 shaking speed of 120 rpm, temperature of 298 K and initial metal ion concentration of 50 mg/L in 50 mL of solution.
0 10 20 30 40 50 60 70 80 90 100
3 0 6 0 9 0 1 2 0 1 5 0 1 8 0
% R e m oval of l e ad ( ii ) ion s
Time in minutes
CSA
CSCA
CFA
CFC
From figure 4.11 it is clear that as time increases the amount of adsorbed lead metal ions increases gradually from 56.7% to 98.7% for ACS when contact time was increased from thirty minutes to two hours followed by a decline to 98.2%. ACSC and ACF had shown rapid rate of metal ions adsorption from 54.0% to 99.4% and 66.0% to 99.2% respectively when time increased from thirty minutes, attaining equilibrium after two hours. The percentage removal for Pb2+ ions was almost a plateau with a range from 89.5% to 99.6% for the CFC and 90.7% to 98.2% for ACFC when the time was increased from thirty minutes to three hours. Statistical data showed no significance difference for the percentage adsorption of Pb2+ ions by ACSC, ACS and ACF after 120 minutes while for CFC and ACFC after 30 minutes at 95% confidence limit.
0 10 20 30 40 50 60 70 80 90 100
3 0 6 0 9 0 1 2 0 1 5 0 1 8 0
% Re m oval of c ad m iu m (ii) ion s
Time in minutes
CSA
CSCA
CFA
CFC
CFCA
From figure 4.12, the percentage removal of Cd2+ ions by ACS increased as time progressed from 76.8% at thirty minutes to an optimum value of 99.1% after two hours. The percentage removal of ACSC increased from 95.5% to 99.7% at a time interval of thirty minutes and three hours then attaining equilibrium. The percentage removal for Cd2+ ions was almost at equilibrium with a range from 75.1% to 99.8% for the ACF, 75.9% to 95.1% for CFC and 80.9% to 99.7% for ACFC when the time was increased from thirty minutes to two hours. Statistical data showed the percentage removal of Cd2+ ions by ACS, ACSC, ACF, CFC and ACFC after 90, 150, 90, 120 and 60 minutes are not significant difference at 95% confidence limit respectively.
4.4.3 The Effect of Adsorbent Dosage in Pb2+ and Cd2+ Ions Percentage Removal Experiments were conducted with the adsorbent dosage of 0.1, 0.5, 1.0, 1.5 and 2.0 g per 50 mL of test solution. The effect of pH 6.0, starring period of 3 hours at 120 rpm, temperature of 298 K and initial metal ion concentration of Pb2+ and Cd2+ ions 50 mg/L for ACS, ACSC, ACF, CFC and ACFC are shown in figure 4.13 and 4.14.
0 10 20 30 40 50 60 70 80 90 100
0 . 1 0 . 5 1 1 . 5 2
% R e m o val o f l e ad ( ii) io n s Dosage (g) CSA CSCA CFA CFC CFCA
Figure 4.13: The effect of adsorbent dosage in Pb2+ ions percentage removal using a of pH 6 contact time of 3 hours, adsorbent dosage of 1.0 g, shaking speed of 120 rpm, temperature of 298 K and initial metal ion concentration of 50 mg/L in 50 mL of solution.
at 95% confidence limit while the percentage removal using ACF increased from 11.7% to 61.2% as the dosage was increased from 0.1 g to 2.0 g. Maximum percentage removal attained were as follows CSCA 98.1% at 1.5 g, ACFC 99.6% at 1.5 g, CFC 99.3% at 1.5 g, ACS 95.8% at 1.5 g and ACF 61.2% at 2.0 g, This showed that AFC is effective in removal of Pb+2 ions from solution.
Figure 4.14: The effect of adsorbent dosage in Cd2+ ions percentage removal using a pH of 6 contact time of 3 hours, shaking speed of 120 rpm, temperature of 298 K and initial metal ion concentration of 50 mg/L in 50 mL of solution.
Figure 4.14 show the percentage removal of Cd2+ ions by CFCA and CFC increased from 65.9% to 99.9% and 73.7% to 96.7% when the dosage was increased from 0.1 g to 1.5 g followed by a decrease to 99.2% and 96.3% respectively at a dosage of 2.0 g. The percentage removal for ACS, ACSC and ACF increased steadily from 62.1% to 98.1%, 55.8% to 95.6% and 68.3% to 97.5% respectively as adsorbent dosage increased from 0.1 g to 1.5 g and there were no significant differences as the adsorbents dose were increased from 1.0 g to 2.0 g. The optimum percentage removal of Cd2+ ions were realized at 99.9% for ACFC, 96.7% for CFC, and 98.1% for ACS at a dosage of 1.5 g respectively
0 10 20 30 40 50 60 70 80 90 100
0 . 1 0 . 5 1 1 . 5 2
% R e m ov al o f cad m iu m (i i) ion s
Dosage ( g)
CSA
CSCA
CFA
CFC
while for ACSC occurs at 95.6% and 97.5% for ACF at a dosage of 1.0 g. This indicates that ACFC is an effective adsorbent towards removal of Cd2+ ions.
The trend indicates that higher dosage increases ability of exchangeable sites for metal ions (Babel and kurniawan 2004), (Najua et al., 2008) and (Dakiky et al., 2002).
Percentage removal of Cd2+ ions remains constant suggesting that after 1.0 g dose of adsorbent, maximum adsorption is reached and hence the amount of ions bound to the adsorbent and amount of free ions remains constant even with further addition of the dose of adsorbent. This is due to the more readiness of the exchangeable vacant sites or surface area at higher concentration of the adsorbent. The result shows overlapping of adsorption sites during removal due to overcrowding of adsorbent particles leading to a split in the concentration gradient between solute concentration in the solution and the solute concentration in the surface of the sorbent (Fourest and Roux, 1992). Adsorptions becomes constant due to shieling effect on vacant sites as result of screening effect on the dense outer layer of the cells at higher concentration of dosage (Bishnoi et al. 2004).
4.4.4 Effect of Initial Metal Ions Concentration on the Adsorption of Pb2+and Cd2+ Ions
0 10 20 30 40 50 60 70 80 90 100
5 0 1 0 0 1 5 0 2 0 0 2 5 0
% Re m oval of lead (ii ) ions
Initial concentration in mg/L
CSA
CSCA
CFA
CFC
CFCA
Figure 4.15: The effect of initial concentration of metal ions towards removal of pb2+ ions using a of pH 6 contact time of 3 hours, adsorbent dosage of 1.0 g, shaking speed of 120 rpm and temperature of 298 K in 50 mL of solution.
Figure 4.16: The effect of initial concentration of metal ions towards removal of Cd2+ ions using a of pH 6 contact time of 3 hours, adsorbent dosage of 1.0g, shaking speed of 120 rpm and temperature of 298 K in 50 mL of solution.
Figure 4.16, it can be deduced that increasing initial metal ions concentration increased the percentage removal of Cd2+ ions followed by decrease in adsorption by all the adsorbents. Adsorption by ACS increased from 79.6% to 96.6% followed by decrease to 75.9%, ACSC increased from 69.1% to 98.3% followed by decrease to 95.4%, CFC increased from 67.0% to 99.9% followed by decrease to 90.1% as data showing statistically significant change on percentage removal when initial metal ion concentration increases above 150 mg/L. ACF percentage removal increased from 77.7% to 99.5% followed by decrease to 85.6% and ACFC percentage removal increased from 69.0% to 99.4% followed by decrease to 85.5% as initial concentration increases from 50 mg/L to 150 mg/L but no statistical significant change in percentage removal above 200 mg/L. The optimum percentage removal of Cd2+ ions was 96.6%, 98.3%, 99.5%, 99.9% and 99.4% at 150 mg/L for ACS, ACSC, ACF, CFC and ACFC respectively.
0 10 20 30 40 50 60 70 80 90 100
5 0 1 0 0 1 5 0 2 0 0 2 5 0
% R e m ova l of c ad m iu m (i i) i on s
Initial concentration in mg/L
CSA
CSCA
CFA
CFC
As initial concentration increases from 50 to 150 mg/L rate of percentage removal is very high and this can be due to presence of active and large surface area of vacant sites in the adsorbent at the beginning, providing increased dynamic force to overcome all mass transfer resistance of metal ions between the aqueous and solid phases resulting in higher possibility of collision between metal ions and sorbents (Mureithi et al., 2012). The low adsorption capacity at higher concentration can be as a result of smaller number of binding sites on the adsorbent surface comparative to more number of adsorbing species (Tumin and Chuah, 2008; Senthil et al., 2010). Adsorbents performed better at initial concentrations of 150 mg/L for Cd2+ and Pb2+ ions The percentage removal of 99.9% by ACF is higher than any other adsorbent indicating that it has more active and large number of binding sites for Cd2+ and Pb2+ ions respectively.
4.4.5 The Effect of Shaking Speed on Pb2+ and Cd2+ Ions Percentage Removal
0 10 20 30 40 50 60 70 80 90 100
2 4 6 8 1 0 1 2
% Rem ov al of l ead (i i) i on s
Shaking speed in rpm
CSA
CSCA
CFA
CFC
CFCA
Figure 4.17: The effect of shaking speed on Pb2+ ions percentage removal using a of pH 6 contact time of 3 hours, adsorbent dosage of 1.0g, temperature of 298 K and initial metal ion concentration of 50 mg/L in 50 mL of solution.
0 10 20 30 40 50 60 70 80 90 100
2 4 6 8 1 0 1 2
% Re m oval of c ad m iu m (ii) ion s
Shaking speed in rpm
CSA
CSCA
CFA
CFC
CFCA
Figure 4.18: The effect of shaking speed on Cd2+ ions percentage removal using a of pH 6 contact time of 3 hours, adsorbent dosage of 1.0g, temperature of 298 K and initial metal ion concentration of 50 mg/L in 50 mL of solution.
attained maximum adsorption of 99.2% at a shaking speed of 100 rpm, ACF managed to remove 63.1% at 120 rpm, while CFC and ACFC removed 99.7% and 99.4% at shaking speed of 100 and 80 rpm respectively. The percentage removal of Cd2+ ions show similar trends in figure 4.18 where maximum removal percentage is attained as follows ACS 98.92%, ACSC 96.91%, CFC 99.62%, and AFC 99.51% at shaking speed of 100 rpm while ACF removed 83.25% at shaking speed of 120 rpm. Statistical data showed no significant change in percentage removal of pb2+ and Cd2+ ions for shaking speed values of adsorbents above 8 and 10 rpm respectively except for ACF which increases with increase in shaking speed.
This indicates that increase in shaking speed enhances diffusion of metal ions towards the surface of the adsorbent due to increased kinetic energy which breaks forces between the Pb2+ and Cd2+ ions in solution and the binding sites which are made readily available promoting fast rate of transfer of sorbate ions to the sorbent sites (Argun et al., 2007). Shaking speed should be enough to ensure cell surfaces for binding sites are available for adsorption process to occur, shaking speed of 100 to 120 rpm were selected as optimum speed for Pb2+ and Cd2+ ions.
4.4.6 Effect of Temperature Changes on Adsorption of Pb2+ and Cd2+ Ions
0 10 20 30 40 50 60 70 80 90 100
2 9 3 3 1 3 3 3 3 3 5 3 3 7 3
% Re m oval of lead (ii ) ions Temperature (K) CSA CSCA CFA CFC CFCA
Figure 4.19: The effect of temperature on Pb2+ ions percentage removal using a of pH 6 contact time of 3 hours, adsorbent dosage of 1.0 g, shaking speed of 120 rpm and initial metal ion concentration of 50 mg/L in 50 mL of solution.
0 10 20 30 40 50 60 70 80 90 100
2 9 3 3 1 3 3 3 3 3 5 3 3 7 3
% Re m oval of c ad m iu m (ii) ion s Temperature (K) CSA CSCA CFA CFC CFCA
Figure 4.19 and 4.20, the percentage removal of Pb2+ ions by ACSC increased from 61.75 to 98.71% when the temperature was increased from 293 to 333 K. Further increase in temperature above 333 K did not affect the percentage removal of Pb2+ ions by ACSC. Similar trend is observed for ACS towards removal of Cd2+ where it increased from 77.60 to 98.93% with temperature increase from 293 to 353 K. Percentage removal of Pb2+ ions by CSA increased from 57.77 to 96.52% when the temperature was increased from 293 to 333 K, CFC from 83.07 to 99.60% with temperature increase from 293 to 353 K, ACFC from 80.68 to 98.86% when the temperature was increased from 293 to 333 K. Percentage removal of Cd2+ ions by ACSC increased from 96.64 to 99.86% with temperature increased from 293 to 353 K, CFC from 96.94 to 99.25% with temperature increased from 293 to 313 K, ACFC from 98.80 to 99.59% when temperature increased from 293 to 353 K and further decrease in percentage removal were observed with increase in temperature in all adsorbents. There were no statistical significant change in percentage removal of Cd2+ ions for ACSC, ACS and AFC above 293 K and above 333 K in Pb2+ ions for ACSC and CFC at 95% confidence level.