Enhancing Power Efficiency of Doherty Power Amplifiers Using
Windowing Based Crest Factor Reduction Technique
Deepak N. Maroor Vikraman*, Rocco Giofr´e, and Paolo Colantonio
Abstract—This paper investigates the performance of a Windowing Based Crest Factor Reduction (CF RW B) technique, to enhance the power efficiency of Radio Frequency (RF) power amplifiers. In particular, CF RW B is implemented on a Doherty Power Amplifier (DP A) in conjunction with Generalized Memory Polynomial (GM PDP D), and Volterra series based Digital Predistortion (VDP D) techniques. Key features like spectral regrowth, Peak to Average Power Ratio (P AP R) reduction, efficiency improvement and Error Vector Magnitude (EV M) have been used to measure the efficacy of the proposed method. Both simulation and experimental results show that the proposed combination of CF RW B technique with GM PDP D and VDP D is able to reduce the P AP R of the complex input signals by nearly 60%, with minimal degrading of the EV M and spectral regrowth. Moreover, such signal with reducedP AP R can be used to overdrive the DPA, allowing for a relevant average efficiency enhancement (i.e., up to 25%), while fulfilling the requirements of modern communication standards such as Wideband Code Division Multiple Access (W CDM A) and long-term evolution (LT E).
1. INTRODUCTION
Demand for higher data rates, allocation of more users, and the need of robust wireless communication links have driven the development of modern standards like 3G and 4G. These technologies are bounded by very stringent specifications, that are continuously getting tougher as in the forthcoming 5th generation of wireless systems [1]. Complex modulation schemes, like Wideband Code Division Multiple Access (W-CDMA), and Orthogonal Frequency Division Multiplexing (OFDM) are considered to be promising solutions to meet the expected requirements. Unfortunately, such signals are characterized by highly varying envelope [2–4], resulting in very high Peak to Average Power Ratio (PAPR). Therefore, such coding approaches are creating bigger challenges for Power Amplifiers (PAs) designers, who have either to conceive new PA configurations or to resurrect and optimize old PA architectures to set up novel ways to maximize the efficiency-linearity trade-off of the transmitters [5].
In this context, the Doherty Power Amplifier (DPA) has been rediscovered as one of the most promising PA architecture to fulfill such a goal. However, even if the DPA has the relevant capability to increase the average efficiency, when working with varying envelope signals, its linearity is usually worsen as compared to other PAs topologies [6, 7]. Therefore, methods and solutions to improve the DPA linearity, without worsening its efficiency behavior, are of great interest.
Crest Factor Reduction (CFR) techniques [8, 9], in conjunction with Digital Predistortion (DPD) techniques are considered to be a promising solution to simultaneously achieve higher linearity and efficiency [10–15]. However, a complete experimental validation of both benefits and drawbacks induced by their application on a DPA is not yet reported in literature. The aim of this paper is to fill such a gap, showing how a CF RW B algorithm, in conjunction with DPD techniques, can be exploited to simultaneously improve the overall efficiency and linearity of a DPA. Moreover, for an in-depth performance analysis two different DPD approaches, i.e., Generalized Memory Polynomial (GM PDP D),
Received 17 February 2016, Accepted 20 March 2016, Scheduled 13 April 2016
* Corresponding author: Deepak N. Maroor Vikraman ([email protected]).
and Volterra series based Digital Predistortion (VDP D) are adopted and applied onto two different signal standards: Long-Term Evolution (LT E) and multicarrier Wideband Code Division Multiple Access (W CDM A) with varying bandwidth. In particular, to reduce the PAPR of the signals,CF RW B technique [9, 10] based on peak windowing is used and its performance in conjunction with GM PDP D and VDP D techniques is evaluated through several parameters such as Adjacent Channel Power ratio (ACPR), Error Vector Magnitude (EVM), and power efficiency increment.
This paper is organized as follows. The conventional clipping & filtering and clipping & windowing methods applied to reduce the PAPR of a complex signal are summarized in Section 2.1 and Section 2.2, respectively. The proposed CF RW B algorithm is reported in Section 3, while GM PDP D and VDP D predistortion techniques are briefly introduced in Section 4. The registered experimental results, when the proposed method is applied to either LTE and WCDMA signals, are reported in Section 5.1 and Section 5.2, respectively. Finally, conclusions are drawn in Section 6.
2. CONVENTIONAL CFR TECHNIQUES
Both conventional hard clipping and clipping & filtering techniques are still considered to be the easiest methods of PAPR reduction. Unfortunately, they are not adequate enough to generate signals which can meet the stringent requirements of modern communication standards. In the following subsections, pros and cons of these conventional CFR techniques are briefly discussed, highlighting their limiting factors [6, 8, 10–12].
2.1. Clipping and Filtering
Conventional CFR techniques are based on classical limiting approach, in which peaks of the complex signal are reduced by hard clipping over a given maximum threshold. This approach generates sharp corners in the time domain signal, which give rise to out-of-band (OOB) spurious [5]. To mitigate them, clipping & filtering techniques can be used. However, such techniques are not able to fully restrict the peak-regrowth, and, above all, to properly control the in-band noise (i.e., avoiding EVM degradation) [9, 16, 17].
Conventional clipping & filtering techniques can be denoted by:
xclip(n) =Sf n(n)· x(n) (1)
where Sf n(n) represents the scaling function used to define the threshold limit for hard clipping, and x(n) is the envelope of the baseband signal to be clipped & filtered to reduce the PAPR. The scaling functionSf n(n) is defined by:
Sf n(n) = 1−Spulse(n) (2)
where
SP ulse(n) =
{
1− Ath
|x(n)| |x(n)| ≥Ath
0 |x(n)|< Ath
(3)
Here,Ath is the maximum threshold defined for clipping, and consequently,xclip(n) is the final clipped signal with reduced PAPR. This signal xclip(n) is then filtered to smooth the sharp edges generated after hard clipping [4]. Sequence of pulsesSP ulse(n) are normalized by the clipping thresholdAth. From (1)–(3), it is obvious that after direct clipping, the clipped corners inSP ulse(n) also remain inxclip(n), which causes nonlinear distortions and regeneratesOOB distortion, as well.
2.2. Clipping & Windowing
In clipping & windowing techniques, to reduce the OOB radiations, filtering functions are replaced by windowing functions. The latter are used to smooth the sharp edges of the clipped signals (xclip). Conventional windowing technique can be represented by:
Csc(n) = 1− ∞
∑
i=−∞
whereWin(n) defines the windowing function, which can be any conventional function such as Hamming, Gaussian, Kaiser, etc. [17]. Scaling function used to scale down the PAPR of the complex signal is given by Csc(n), while Ceff(i) are the coefficients selected such that the product of the original signal x(n)
and the scaling function Csc(n) does not exceed the maximum clipping threshold Ath. Therefore, like clipping & filtering functions, the clipped & windowed signal can be represented by:
xclipwin(n) =Csc(n)·x(n) (5)
3. PEAK WINDOWING BASED ALGORITHM FOR CFR
CF RW B algorithm was proposed in [18], but in that work, performance measures such as, efficiency improvement, ACPR/ACLR, and EVM were not analyzed for upcoming communication standards. Therefore, for systems based on 3G and 4G technology, pros and cons of introducing such a technique in conjunction to DPD techniques is still an interesting area of investigation. In theCF RW B technique, firstly a window covering L number of samples is defined, and this window is further divided into two asymmetric windows, namely left-side (winls) and right-side (winrs), respectively. Secondly, in time domain, the peaks of reference signal x(n) are detected, and these peaks are grouped into blocks if they fall within predefined frame of the main window, and their locations are indexed. For example, let window length L be 200, and corresponding samples are indexed bym1,m2,m3,. . .,m200.
Suppose samples indexed bym20,m45,m85,m160andm175 exceed the given windowing thresholdAwin.
Therefore, if the main window has been portioned assuming winls=winrs=100 samples, then samples indexed bym20,m45 and m85 fall in the left side of the main window, and they will be grouped in the
winls, while the samples indexed by m160 and m175 will be grouped in winrs. Peaks grouped in the
windows are scaled down using the scaling function given by:
Apk−win(n) = 1− ∞
∑
m=−∞
Ceff−win(m)·[winls(n−nm) +winrs(n−nm)] (6)
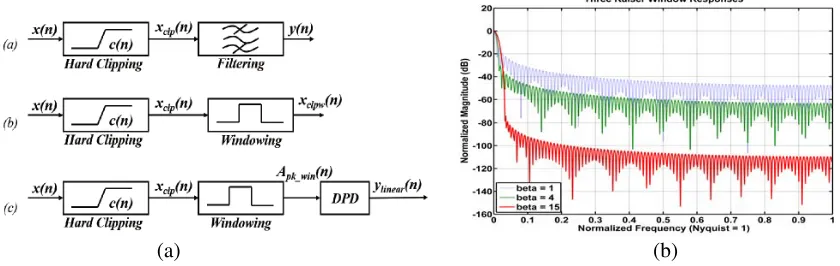
where, two windowing functions winls(n) andwinrs(n) are two different windows defining the left and right side of the windowing function, respectively. Ceff−win is the weighting factor for those left-out peaks which were not indexed bym. This down scaled signalApk−win(n) is multiplied with the original signal x(n) (i.e., signal with high PAPR), resulting into a signal with lower PAPR. This algorithm has been tested and verified with single and multicarrier signals as well. Each block of the windowing function is constructed in an adaptive manner to reduce over-attenuation caused by superposition of the windows. By this algorithm, small peaks are concealed under large neighboring peaks and only peaks with large amplitude are exploited to design the scaling function. Each block is then processed by the CF RW B algorithm to reduce the PAPR and later its performance is analyzed in conjunction with the two DPD techniques. Fig. 1(a) reports the block diagrams of the three aforementioned methods.
(a) (b)
3.1. Implementation of the Proposed Algorithm
For windowing purpose, any conventional window function such as Hamming, Gaussian, Kaiser or others can be used. In this work, Kaiser window is used because of its ability to control the windowing parameters by adjusting only two factors, namely window length L, and window shaping factorβ [17]. In particular,L= 200 andβ= 15 are used to implementwinls(n) andwinrs(n) Kaiser windows, which can be expressed as:
wink= I0
β
√
1−
[
2n L+ 1−1
]2
I0(β)
(7)
whereI0 is the zeroth order modified Bessel function of the first kind, andβis an arbitrary, non-negative
real number that determines the shape of the window. Fig. 1(b) shows the spectral response of Kaiser window with varying values ofβ, while keeping window lengthLconstant at 200.
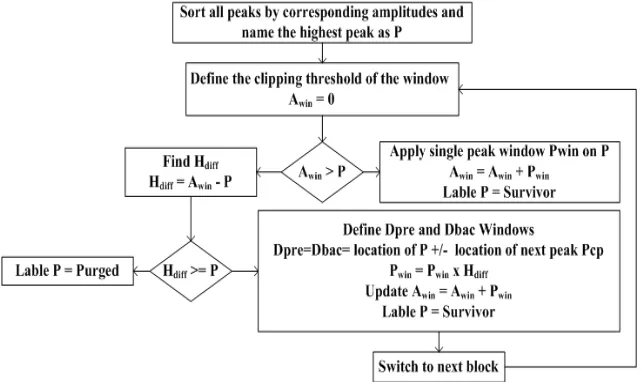
The flow chart shown in Fig. 2 provides in-depth explanation of the proposed CFR technique. Initially, all the peaks of the input signal are sorted and indexed in blocks with respect to their amplitudes from high to low. As stated earlier, maximum threshold for the window is assumed to be Awin. The samples above such threshold are labeled ‘Unprocessed’. The sample with highest amplitude in the block is labeledP. If the amplitude of sample ‘P’ is less than the assumed threshold Awin, then single peak windowing Pwin is applied on P, and correspondingly Awin is modified as superposition of Awin and Pwin, resulting inAwin =Awin+Pwin, and the peakP is labeled ‘Survivor’.
Figure 2. Flow chart of the proposed CFR algorithm.
Conversely, if the peak P is higher than Awin, then the difference between Awin and Pwin is calculated and labeled ‘Hdiff’, while sampleP is labeled ‘Eradicate’. If the difference betweenAwin and P is less than zero, then the next closest peak Pcp is indexed and labeled ‘Survivor’. The difference between the peaks P and Pcp is calculated and labeled Dpres, and the left hand side of window is constructed by measuring the difference between the sample position ofP and Pcp. Similarly, the next following peak on the right hand side of the peak P is measured and the corresponding window on the right hand side is calculated. In this case, the peak window Pwin is denoted by Pwin ×Hdiff and
(a) (b)
Figure 3. CCDF plots of the 10 MHz LTE and multicarrier WCDMA signals with and without CFR at different thresholds. (a) CCDF plots of the LTE signals. (b)CCDF plots of the multicarrier WCDMA signals.
From both figures, it is evident that the proposed CFR technique is capable to reduce the PAPR of both LTE and multicarrier WCDMA signals by nearly 4 dB. It is also visible that the performance of the proposed CFR technique is better when used with LTE signals, because the average value of the probability density function (PDF) of the LTE signal under consideration was higher than that for the multicarrier WCDMA signals. This implies that a higher number of peaks were clipped and windowed in case of LTE signal, resulting in a higher reduction of PAPR with respect to WCDMA signals.
Figure 4(a) shows the envelope of the WCDMA signal when it is hard clipped, clipped & filtered, and when it is treated with the proposed algorithm, respectively. As can be noted, the clipping & filtering process gives rise to peak regrowth after filtering, whereas the signal processed with theCF RW B technique always remain within the maximum threshold.
(a) (b)
Figure 4. Figures showing time and frequency domain behaviors of 10 MHz WCDMA signal treated by CF RW B. (a) Time Domain Envelope of the Multicarrier WCDMA signal. (b) Spectrum of clipped and windowed two carrier WCDMA signal.
4. GENERALIZED MEMORY POLYNOMIAL VS.VOLTERRA MODELS
To test the performance of the proposed CFR technique in conjunction with different DPD techniques, two DPD algorithms, namely Volterra series based Digital Predistortion (VDP D) and Generalized Memory Polynomial (GM PDP D), are selected. Volterra series with multidimensional convolutions are considered to be one of the most prominent and robust modelling techniques for PAs [10, 19–21]. The Volterra series predistorter can be described by:
Zn= Q∑−1
m=0
... Q∑−1
ml=0
hl(m1...ml)
L
∏
l=1
x(n−ml) (8)
In the above equation,Zn is an L dimensional summation of power series and past time envelope responses. hl(m1. . . ml) are the coefficients associated with theLth branch kernel of the Volterra series. This is a generalized power series representation with a finite memory of length Q+1.
Volterra series is a general nonlinear model with memory, but a full Volterra series with multidimensional convolutions produces a huge computational load, that limits its attractiveness in practical applications[20]. Therefore, it is generally simplified into Wiener, Hammerstein, Wiener-Hammerstein or generalized memory polynomial models (GM PDP D) [20]. GM PDP D reduces Volterra’s model complexity [20–24]. For this work, indirect learning architecture has been used to construct the GM PDP D, which eliminated the need for a model assumption and parameter estimation of the power amplifier [21, 22]. Moreover,GM PDP D is more robust and its coefficients can be easily estimated using a least square algorithm [20, 21].
In this work, we did not need all the coefficients of GM PDP D, because it was non intended to implement delay taps. Therefore, the following modified function was used as GM PDP D:
ZGM P(n) =
∑
kϵKa ∑
lϵLa
aklx(n−l)|x(n−l)|k+
∑ kϵKb ∑ lϵLb ∑ mϵMb
bklmx(n−l)|x(n−l−m)|k
+∑ kϵKc ∑ lϵLc ∑ mϵMc
cklmx(n−l)|x(n−l+m)|k (9)
Here, x(n) and ZGM P(n) are the input and output signals of the modified GMP model. Ka, La and akl are the nonlinearity order, memory order and coefficients of the aligned terms between signal and its exponentiated envelope, respectively. Kb, Lb, Mb and bklm are the nonlinearity order, memory depth, lagging cross terms index, and coefficients of the signal and lagging exponentiated envelope terms, respectively. Kc,Lc,Mc andcklm are the nonlinearity order, memory depth, leading cross terms index, and coefficients of the signal and leading exponentiated envelope terms, respectively. The two above mentioned DPD techniques were used in conjunction withCF RW B, so that the change in CFR performance with respect to different predistortion techniques can be evaluated.
5. EXPERIMENTAL SETUP AND RESULTS
(a) (b)
Figure 5. Figures showing the DPA and test and measurement set-up. (a) Photograph of the DPA used as device under test. (b) Test and measurement setup.
For the experimental validation, two signals’ families have been considered: LTE with varying bandwidth, and Multicarrier WCDMA with different bandwidths and number of carriers. Both LTE and multicarrier WCDMA signals were oversampled to attain a sampling frequency of 92.16 MHz.
5.1. Performance of Proposed CFR Technique for LTE Signals
To comply with the LTE standard, the maximum allowableEV M should be less than 8.5% and Adjacent Channel Leakage Ratio (ACLR) should be less than 45 dBc [25]. Similar are the specifications for multicarrier WCDMA signals. The linearization requirements for LTE were achieved byVDP Dtechnique at 7th order of nonlinearity and 3rd order of memory depth. Therefore, the order of nonlinearity and memory depth were not increased any further during the measurements, and same order of nonlinearity and memory depth were used to linearize DPA when driven with by multicarrier WCDMA signals. Table 1 shows the measured values of EV M and ACLR for LTE signals with and withoutVDP D and CF RW B. As can be seen, the combination of theCF RW B technique with VDP D complies the linearity requirements of LTE standards. It is observed that introducing CFR technique causes rise in EVM distortion, but it is important to notice that the ACLR and EVM values measured for the combination of VDP D and CF RW B are well within the requirements of LTE standards. Measured values of ACLR and EVM for LTE signals are also reported in Table 1.
Figure 6(a), Fig. 6(b) and Fig. 6(c) depict the measured power spectrum of 5 MHz, 10 MHz and
Table 1. Measured ACLR and EVM for LTE signals with and without VDP D and CF RW B.
LTE
Signals Measured
EVM %
ACLR (dBc)
−10MHz −5MHz 5 MHz 10 MHz
5 Mhz
Pout 9.3 −46.6 −26.1 −26.6 −47.7
DPD+PA 7 −47.3 −43.8 −43.4 −46.7
DPD+PA+CFR 7.4 −50.1 −49.4 −48.1 −52.5
10 Mhz
Pout 9.5 −49.1 −29.1 −29.7 −48.9
DPD+PA 6.69 −51.3 −46.6 −46.8 −49.8
DPD+PA+CFR 7.53 −52.3 −47.3 −47.1 −51.8
15 MHz
Pout 9.15 −47.8 −26.8 −26.9 −44.9
DPD+PA 6.39 −45.4 −39.0 −40.5 −46.3
(a) (b)
(c)
Figure 6. Measured power spectrum for LTE signals with varying bandwidth. (a) Measured power spectrum for 5 MHz LTE signal. (b) Measured power spectrum for 10 MHz LTE signal. (c) Measured power spectrum for 15 MHz LTE signal.
15 MHz LTE signal (16-QAM modulation and PAPR of 9.98 dB), respectively. The power spectrum shown in black lines are the DPA output without applying any DPD and CFR on the LTE reference signal. Green lines represent the spectrum of the DPA output when only VDP D is applied to linearize the DPA, and the red lines are the power spectrum whenVDP D in conjunction withCF RW B is applied to the reference LTE signals.
As previously illustrated (i.e., Fig. 3(a) and Fig. 3(b)), theCF RW B technique is able to reduce the PAPR of the complex signals by nearly 4 dB. Consequently, the DPA can be driven with a higher input power when CF RW B is applied, thus allowing for a relevant efficiency improvement. In particular, when the DPA was driven with this higher input power the average efficiency was enhanced by nearly 25%, while maintaining similar values of ACLR and EVM. From Fig. 6(a)–Fig. 6(c), it is worth to notice that ACLR performance of the DPA output for signals where CF RW B is in conjunction with VDP D deteriorates with respect to the increase in the bandwidth of input signal. The reason for such behaviour can be ascribed to the change in oversampling ratios of the input signals. In our case, to achieve a sampling frequency of 92.16 MHz, signals with 5 MHz, 10 MHz and 15 MHz bandwidth were oversampled 8, 8 and 4 times, respectively.
5.2. Performance of CF RW B for Multicarrier WCDMA Signals
this section are concurrent to the procedures followed in Section V-A. Table 2 and Table 3 summarize the measured performance ofCF RW B in conjunction withGM PDP D for multicarrier WCDMA signals with varying bandwidths.
Table 2. Measured ACPR and EVM for 2-carrier (10 MHz) WCDMA signals withGM PDP D.
2C-WCDMA (21 dBm)
EVM (%)
ACPR (dBc)
(MHz) ∆PAE
(%)
−10 −5 5 10
Pout 12.31 −43.6 −28.5 −27.4 −44.3 −
DPD+PA 7.52 −52.5 −51.8 −51.3 −53.5 −
DPD+PA+CFR 7.85 −52.4 −50.5 −50.2 −52.8 +10.8
2C-WCDMA
(24 dBm) −10 −5 5 10
Pout 11.69 −43.7 −33.5 −31.99 −45.7 −
DPD+PA 6.82 −52.8 −52.3 −51.98 −52.6 −
DPD+PA+CFR 7.23 −51.6 −50.3 −50.8 −52.0 +15.6
2C-WCDMA
(26 dBm) −10 −5 5 10
Pout 11.53 −43.5 −37.4 −37.4 −44.6 −
DPD+PA 7.63 −52.6 −51.28 −51.6 −52.8 −
DPD+PA+CFR 7.81 −51.2 −50.3 −50.4 −51.9 +21.3
Table 3. Measured ACPR and EVM for 4-Carrier (20 MHz) WCDMA signals with GM PDP D.
4C-WCDMA (21 dBm)
EVM (%)
ACPR(dBc)
(MHz) ∆PAE
(%)
−10 −5 5 10
Pout 12.52 −38.2 −36.9 −34.7 −35.6 −
DPD+PA 6.24 −50.5 −51.9 −51.3 −51.5 −
DPD+PA+CFR 7.15 −47.2 −45.6 −45.2 −47.3 +14.4
4C-WCDMA
(24 dBm) −10 −5 5 10
Pout 11.87 −37.1 −35.7 −36.2 −37.6 −
DPD+PA 7.13 −51.8 −51.6 −51.4 −51.9 −
DPD+PA+CFR 7.25 −47.7 −46.2 −45.9 −47.6 +21.9
4C-WCDMA
(26 dBm) −10 −5 5 10
Pout 11.2 −35.8 −34.13 −35.2 −37.0 −
DPD+PA 6.86 −51.6 −51.2 −51.8 −51.9 −
(a) (b)
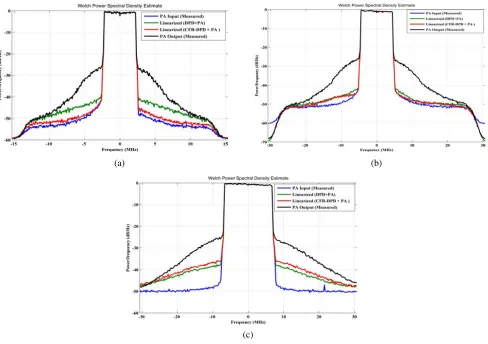
Figure 7. Measured power spectrum for WCDMA signals with varying bandwidth and different number of carriers. (a) Power spectrum of 2-carrier (10 MHz) WCDMA signal. (b) Power spectrum of 4-carrier (20 MHz) signal.
In these tables, column 2C-WCDMA and 4C-WCDMA represent two and four carriers WCDMA signals, respectively. Moreover, DPD+PA represents the DPA output when the input signals were treated only by GM PDP D. DPD+PA+CFR is the DPA output when the input signals were processed by CF RW B and GM PDP D. Also in this case, the average power of the input signal treated with CF RW B was increased by an amount equivalent to PAPR reduced by CF RW B. The measured output spectrums of the considered cases are plotted in Fig. 7(a) and Fig. 7(b). In these figures, brown line show the spectrum of reference input signal (without CFR or DPD applied), while the blue one represents the spectrum of input signal after applying onlyCF RW B (but with increased average power). The red line is the DPA output corresponding to reference input signal, whereas black line depicts the DPA output with onlyCF RW B applied. Finally, green and cyan lines are the power spectral lines whenGM PDP D was applied to DPA output with and withoutCF RW B, respectively.
After analyzing the spectrum, it is evident that GM PDP D in conjunction with the CF RW B technique is able to linearize the DPA to meet the ACPR requirements of the multicarrier WCDMA standards. Column ∆PAE in Table 2 and Table 3 reports the DPAs’ power added efficiency improvements registered when bothCF RW B and GM PDP D are applied together to the input signals. It expresses the increment in PAE when CFR and DPD are applied in conjunction, rather than applying the DPD alone. As can be noted, the proposed method allows to notably ameliorate the DPA efficiency without significantly worsening the modern communication standard parameters, such as ACPR and EVM. More in detail, the application of CFR effectively deteriorates the performance of the DPA in terms of OOB and EVM distortions, but in our case these distortions were well within the permissible limits of WCDMA standards. On the other hand, introduction ofCF RW B in conjunction with GM PDP D allowed us to increase the average input power of the DPA and drive it closer to saturation, which in return enhanced the overall efficiency of the DPA by up to 25%.
6. CONCLUSION
EVM and ACPR requirements of above mentioned communication standards. It is also shown that PAPR reduction, achieved by applying CFR technique, allows to increase the input power of the DPA, which consequently permits the DPA output to be driven in deeper saturation, resulting in improvement of the overall power added efficiency, which in this study was achieved up to 25%.
REFERENCES
1. Shanzhi, C. and J. Zhao, “The requirements, challenges, and technologies for 5G of terrestrial mobile telecommunication,”Communications Magazine, IEEE Vol. 52, No. 5, 36–43, 2014. 2. Paterson, K. G. and V. Tarokh, “On the existence and construction of good codes with low
peak-to-average-power ratios,” IEEE Trans. In-form. Theory, Vol. 46, No. 6, 1974–1987, Sep. 2000. 3. Breiling, H., S. H. Muller-Weinfurtner, and J. B. Huber, “SLM peak-power reduction without
explicit side information,”IEEE Communication Letter, Vol. 5, No. 6, 239–241, Jun. 2001. 4. Armstrong, J., “Peak-to-average power reduction for OFDM by repeated clipping and frequency
domain filtering,” Electron. Letter, Vol. 38, No. 5, 246–247, Feb. 2002.
5. Vaananen, O., J. Vankka, and K. Halonen, “Effect of clipping in wideband CDMA system and simple algorithm for peak windowing,” Proc. World Wireless Congress, San Francisco, CA, 614– 619, May 2002.
6. Sperlich, R., Y. Park, G. Copeland, and J. S. Kenney, “Power amplifier linearization with digital pre-distortion and crest factor reduction,” IEEE MTT-S International Microwave Symposium Digest, Vol. 2, 669–672, Jun. 2004.
7. Giofre, R., L. Piazzon, P. Colantonio, F. Giannini, V. Camarchia, I. Mustazar, M. Pirola, R. Quaglia, and C. Ramella, “GaN MMICs for microwave backhaul: Doherty vs. combined class-AB power amplifier,” 10th European Microwave Integrated Circuits Conference (EuMIC), 33–36, 7–8 Sept. 2015.
8. Lashkarian, N., H. Tarn, and C. Dick, “Crest factor reduction in multi-carrier WCDMA transmitters,” IEEE 16th International Symposium on Personal, Indoor and Mobile Radio Communications, 321–325, 2005.
9. Deepak Nair, M. V., R. Giofre, P. Colantonio, and F. Giannini, “Sequential asymmetric superposition windowing for crest factor reduction and its effects on Doherty power amplifier,” Integrated Nonlinear Microwave and Millimetre-wave Circuits (INMMiC), Oct. 2015.
10. Deepak Nair, M. V., R. Giofre, L. Piazzon, P. Colantonio, and F. M. Ghannouchi, “Effects of windowing based crest factor reduction technique on digitally predistorted PAs for multicarrier WCDMA,”Wireless Symposium (IWS), Mar. 2015.
11. Jiang, W., B. Xing, J. Wang, Y. Ni, C. Peng, X. Zhu, and W. Hong, “Performance improvement of power amplifiers with digital linearization technology,” Proceedings of Asia-Pacific Microwave Conference, 1–4, Dec. 2007.
12. Zeng, Z., D. Xie, and Y. Huang, “A crest factor reduction method in digital predistortion for improvement of power efficiency,” International Conference on Computer Science and Electronics Engineering, 636–639, Mar. 2012.
13. Mbaye, A., G. Baudoin, A. Gouba, Y. Louet, and M. Villegas, “Combining crest factor reduction and digital predistortion with automatic determination of the necessary crest factor reduction gain,” European Microwave Conference (EuMC), 837–840, Oct. 2014.
14. Amiri, M. V., M. Helaoui, N. Boulejfen, and F. M. Ghannouchi, “Optimized spectrum constrained crest factor reduction technique using polynomials,” IEEE Transactions on Communications, Vol. 63, No. 7, 2555–2564, Jul. 2015.
15. Amiri, M. V., S. A. Bassam, M. Helaoui, and F. M. Ghannouchi, “Partitioned distortion mitigation in LTE radio uplink to enhance transmitter efficiency,”IEEE Transactions on Microwave Theory and Techniques, Vol. 63, No. 8, 2661–2671, Aug. 2015.
17. Farabegoli, A., B. Sogl, J. E. Mueller, and R. Weigel, “Advanced transmitters with combined crest factor reduction and digital predistortion techniques,”IEEE Radio and Wireless Symposium, 133–135, Jan. 2014.
18. Chen, G., R. Ansari, and Y. Yao, “Improved peak windowing for PAPR reduction in OFDM,” IEEE 69th Vehicular Technology Conference, 2009, 1–5 , Apr. 2009.
19. Nader, C., P. N. Landin, W. V. Moer, and N. Bjorsell, “Peak-power controlling technique for enhancing digital pre-distortion of RF power amplifiers,”IEEE Transactions on Microwave Theory and Techniques, Vol. 60, 3571–3581, Sep. 2012.
20. Roy, T. K. and M. Morshed, “Performance analysis of low pass FIR filters design using Kaiser, Gaussian and Tukey window function methods,”International Conference on Advances in Electrical Engineering, 1–6, Dec. 2013.
21. Younes, M. and F. M. Ghannouchi, “Behavioral modeling of concurrent dual-band transmitters based on radially-pruned Volterra model,”IEEE Communications Letters, Vol. 19, No. 5, 751–754, May 2015.
22. Morgan, D. R., M. Zhengxiang, K. Jaehyeong, and M. G. Zierdt, “A generalized memory polynomial model for digital predistortion of RF power amplifiers,”IEEE Transactions on Signal Processing, 3852–3860, Oct. 2006.
23. Tehrani, A. S., C. Haiying, S. Afsardoost, T. Eriksson, M. Isaksson, and C. Fager, “A comparative analysis of the complexity/accuracy tradeoff in power amplifier behavioral models,” IEEE Transactions on Microwave Theory and Techniques, Vol. 58, No. 6, 1510–1520, May 2010. 24. Giofr´e, R., L. Piazzon, P. Colantonio, and F. Giannini, “A closed-form design technique for
ultra-wideband Doherty power amplifiers,” IEEE Transactions on Microwave Theory and Techniques, Vol. 62, No. 12, 3414–3424, Dec. 2014.