Western University Western University
Scholarship@Western
Scholarship@Western
Electronic Thesis and Dissertation Repository
6-26-2019 11:00 AM
Evaluating zircon strain chronometry of a Grenville Front
Evaluating zircon strain chronometry of a Grenville Front
deformation fabric through microstructural analysis and quartz
deformation fabric through microstructural analysis and quartz
piezometry
piezometry
Kaitlyn Petkau
The University of Western Ontario Supervisor
Jiang, Dazhi
The University of Western Ontario Joint Supervisor Moser, Desmond
The University of Western Ontario Graduate Program in Geology
A thesis submitted in partial fulfillment of the requirements for the degree in Master of Science © Kaitlyn Petkau 2019
Follow this and additional works at: https://ir.lib.uwo.ca/etd Part of the Geology Commons
Recommended Citation Recommended Citation
Petkau, Kaitlyn, "Evaluating zircon strain chronometry of a Grenville Front deformation fabric through microstructural analysis and quartz piezometry" (2019). Electronic Thesis and Dissertation Repository. 6335.
https://ir.lib.uwo.ca/etd/6335
This Dissertation/Thesis is brought to you for free and open access by Scholarship@Western. It has been accepted for inclusion in Electronic Thesis and Dissertation Repository by an authorized administrator of
Abstract
Zircon strain chronometry can theoretically show correlation of isotopic ages with
microstructural fabrics to place an absolute age on the timing of deformation. However, the
general applicability of zircon strain chronometry to problems in regional continental tectonics is
still being tested and this study is the first effort to apply the approach to the ~1 Ga (billion year
old) Grenville Province of the Precambrian Canadian Shield. Samples were analyzed from the
1747 +6/-5 Ma Wanapitei Complex, a poly-deformed mafic metaplutonic body that preserves
fabric evidence for several stages in the tectonic history of the Grenville Front. This study is the
first to combine in situ strain measurements of zircon with independent measurements of past
differential stress using quartz grain size piezometry. Zircon grains in Wanapitei Complex
samples exhibiting the latest, D3, ductile deformation were analyzed using electron backscatter
diffraction whereas grain size piezometry was completed on a cross-cutting dyke and a marginal
gneiss. It was determined that the stress conditions in the Grenville Front near the Wanapitei
Complex were not sufficient to deform the generally small (< 50 microns) zircon grains seen in
thin sections and result in discordance that would date deformation. Future work targeting
significantly larger zircon grains as well as other accessory phases such as baddeleyite and
monazite would more thoroughly test the viability of U-Pb strain chronometry in the Grenville
Front region.
Keywords
Summary for Lay Audience
The Grenville Front is an area of complex deformation near Sudbury, Ontario resultant
from events that occurred around 1 billion years ago. This thesis explores whether it is possible
to date this deformation with increased confidence than previous work. The method examined in
this thesis is zircon strain chronometry. Zircon strain chronometry is an underexamined method
whereby plastically deformed zircons can be used to provide ages to the events in which the
zircons were deformed. It was determined through this study that the conditions of deformation
in the Grenville Front were not sufficient to cause zircon strain and therefore zircon strain
chronometry is not an applicable method in this case. Justifications for these findings and
Acknowledgements
First and foremost, I’d like to thank my supervisors, Dazhi Jiang and Desmond Moser, for their help throughout this process. I thank them both for their patience and understanding during the last 2.5 years as well as the support and guidance they have provided me. I’d also like to thank Amy Wickham. Amy has been an important part of my graduate experience and I truly
appreciate her support in the last year.
In addition, my thanks go out to my fellow classmates that have been instrumental to my success. I’d like to thank Lucy Lu for joining me in the field and helping me immensely with the Matlab component of my results. Lucy has provided a great amount of support as I have been working towards this degree. Giancarlo Jones helped me learn the ropes of the ZAPLab. He answered many of my questions about zircon and equipment in the ZAPLab. I also appreciate Giancarlo taking the time to discuss his research with me which I was able to reference in my studies.
I would not have been able to complete my research without Ivan Barker’s technical assistance in the ZAPLab. I appreciate his time and effort in guiding me through the analyses process.
I’d like to thank my trivia team, Giancarlo Jones, Ankit Bhandari, Gabriel Arcuri and Philip Reger for the fun and distraction, it was greatly appreciated, even though we lost 99% of the time.
Table of Contents
Abstract... ii
Keywords... ii
Summary for Lay Audience ... iii
Acknowledgements ... iv
Table of Contents ... v
List of Tables ... vii
Table of Figures ... viii
List of Appendices ... xi
Chapter 1 ... 1
1 Objectives and Geological Background ... 1
1.1 Introduction ... 1
1.2 The Grenville Province (Orogeny and Geology) ... 2
1.3 The Grenville Front Tectonic Zone in the Sudbury area and Polyphase Deformation... 5
1.4 Study Area and Sample Setting (Wanapitei Complex) ... 11
Chapter 2 ... 16
2 Review of methods ... 16
2.1 Microstructural Investigation of in situ Zircon ... 16
2.2 Methods of stress determination: A review of theory and methods ... 22
2.2.1 Using recrystallized grain size to determine stress ... 22
2.2.2 Stipp and Tullis (2003) ... 24
2.2.3 Austin and Evans (2007)... 27
2.2.4 Shimizu (2012) ... 29
Chapter 3 ... 33
3 Materials and Methods ... 33
3.1 Sample preparation and imaging ... 33
3.2 Zircon selection and analysis ... 34
3.3 Grain size analysis ... 36
Chapter 4 ... 38
4 Results ... 38
4.1 Microstructural Investigation ... 38
4.1.1 Wcc-4m – Garnet Amphibolite ... 38
4.1.2 Wcc-2 – Garnet-Biotite Amphibolite ... 47
4.1.3 Wcc 4G – Deformed Granitic Dyke ... 54
4.1.4 W2-2 – Garnet-Biotite Quartzofeldspathic Gneiss... 58
4.2 Quartz Grain size measurements ... 70
4.2.2 W2-2 – Garnet-Biotite Quartzofeldspathic Gneiss... 72
Chapter 5 ... 73
5 Interpretations ... 73
5.1 Interpretation of Microstructural Analysis... 73
5.2 Stress Estimates from Quartz Piezometers ... 75
5.2.1 Determination of parameters ... 75
5.2.2 Stress Estimates: Wcc 4G ... 78
5.2.3 Stress estimates: W2-2... 79
5.2.4 Piezometry Summary ... 80
Chapter 6 ... 84
6 Discussion ... 84
6.1 Microstructural Response of Zircon and Implications for Isotopic Dating of the Grenville Front ... 84
6.2 Conclusions and Future Recommendations ... 87
References... 90
List of Tables
Table of Figures
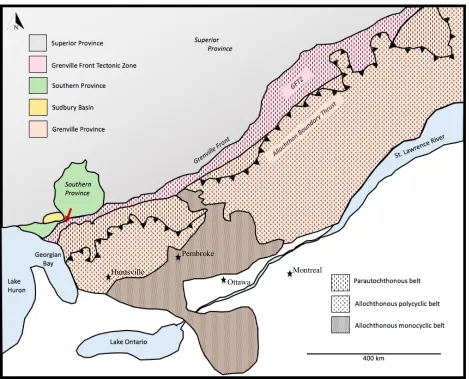
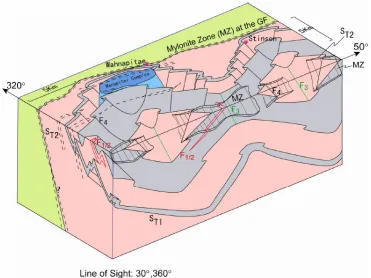
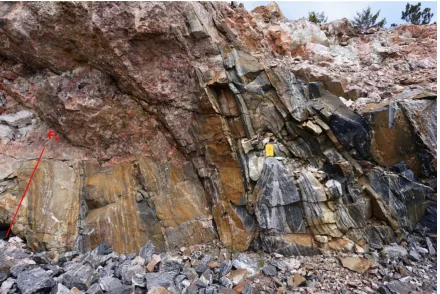
Figure 1-1. Lithotectonic map compiled from Carr et al. (2000) and Li (2012) using lithotectonic divisions by Rivers et al. (1989). Red arrow indicates study location. ... 4 Figure 1-2. Block diagram from Li (2012) showing deformation structures in three dimensions. . 6 Figure 1-3. F1/2 rootless intrafolial fold in the Wanapitei region. Solid line indicates axial trace,
dashed line indicates ST1/2 transposition foliation. Fold hinge orientation 30à213. ... 7
Figure 1-4. Tight F4 folding in Wanapitei region. ST1 makes up fold surface. Axial trace trends
NE-SW. ... 8 Figure 1-5. Isoclinal F4 fold overprinting isoclinal F1/2 in Wanapitei country rock. Solid lines
indicate axial trace. F4 axial trace trends NE-SW. ... 9
Figure 1-6. F4 fold with larger interlimb angle and F4 parasitic fold in migmatitic gneiss with
syn-D3 pegmatitic intrusion. Approx. 12 km SE of study area. ... 9
Figure 1-7. F4 fold overprinting F1/2 in country gneiss. Solid lines indicate axial trace, dashed line
shows F1/2 fold surface. ... 10
Figure 1-8. Pegmatite dyke intruding D3 fold surface in migmatitic gneiss. ... 11
Figure 1-9. Structural map of area surrounding the Wanapitei Complex modified from Li (2012). ... 12 Figure 1-10. Wanapitei Complex amphibolite. (A) Massive garnet amphibolite. (B) Garnet
amphibolite with plagioclase pressure shadows. (C) Massive garnet amphibolite adjacent to highly strained amphibolite. ... 13 Figure 1-11. Migmatized garnet-biotite gneiss of the country rock. ... 14 Figure 1-12. Pegmatite dyke (red dotted line) folded by D3 (F4) in marginal gneiss east of the
Wanapitei Complex. F1/2 and ST1 overprinted by F4. Pegmatite dyke emplacement estimated
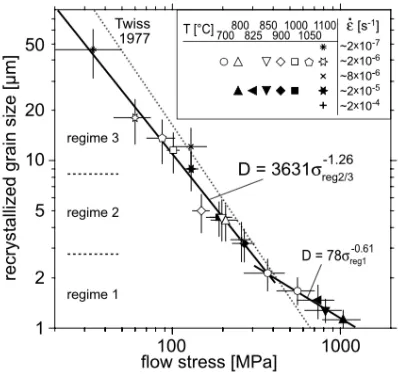
to be 953 ± 33 Ma (Li, 2012). ... 15 Figure 2-1. Yield and tensile strengths of zircon. ... 21 Figure 2-2. Recrystallized grain size piezometer for quartz (Stipp and Tullis, 2003). ... 25 Figure 2-3. Theoretical comparison of mean, median and mode in a log-normal distribution. .... 31 Figure 3-1. Left: Map of sample locations. Right: Stereonet representing field measurements of
ST2 foliation and D3 fold hinges. ... 33
Figure 3-2. Quartz grains measured in Wcc 4G using NIS Element "auto-detect" function. White polylines indicate auto-detected grain boundaries used for measurements. ... 36 Figure 3-3. Eqdia calculation (Nikon, NIS Elements Advanced Research: User’s Manual Ver.
4.00)... 37 Figure 4-1. Photomicrographs of sample Wcc 4M in plane polarized light (left) and cross
polarized light (right). B: biotite, H: hornblende, P: plagioclase, G: garnet. Scale bar = 1000 µm... 39 Figure 4-2. MicroGIS map of accessory minerals in sample Wcc 4M. Zircons >10 um. ... 40 Figure 4-3. MicroGIS map of zircons imaged with BSE and EBSD in sample Wcc 4M. ... 41 Figure 4-4. (A) Euhedral {100} igneous zircon with sector zoning. (B) Subhedral equant
metamorphic zircon with sector zoning. (C, D) Igneous core with metamorphic mantle. Mantle fractured by expansion of high-U core. (E, F) Complex metamict core exhibiting traces of igneous zoning, metamorphic rims are intensely fractured. ... 43 Figure 4-5. Grain 16910, metamorphic zircon. A: Band contrast image with fir-tree zoning. B:
EBSD map colour coded by phase. C: EBSD map colour coded by misorientation
Figure 4-6. Grain 24937, baddeleyite. A: CL image; brittle fractures identified by arrows. B: EBSD map colour coded by phase. C: EBSD map colour coded by misorientation
(misorientation < 3°). D: Misorientation profile along line shown in C, arrows correspond to
fractures. E: Pole figure plot of grain orientation. ... 46
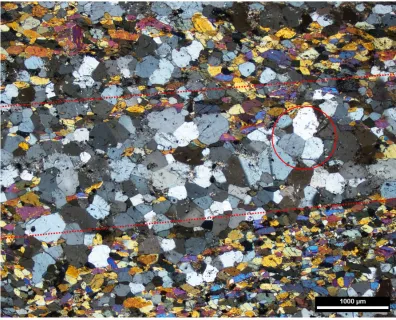
Figure 4-7. Photomicrographs of sample Wcc 2 in plane polarized light (left) and cross polarized light (right). B: biotite, H: hornblende, P: plagioclase, G: garnet. Scale bar = 1000 µm. ... 48
Figure 4-8. Compositionally contrasting bands in Wcc 2 marked by dotted line. In circle: plagioclase exhibiting triple junction grain boundary. Scale bar = 1000 µm. ... 48
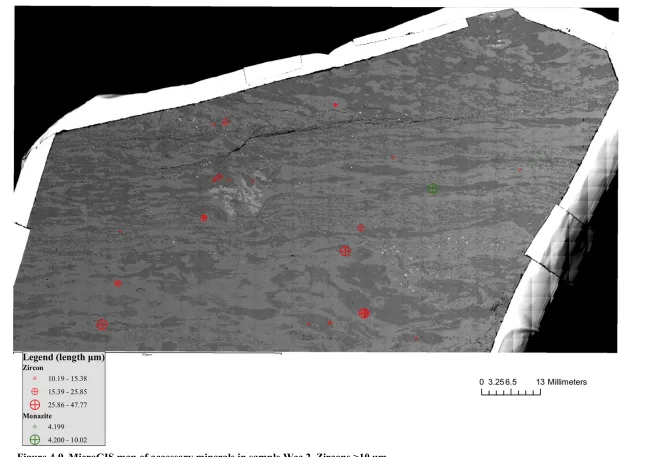
Figure 4-9. MicroGIS map of accessory minerals in sample Wcc 2. Zircons >10 um... 49
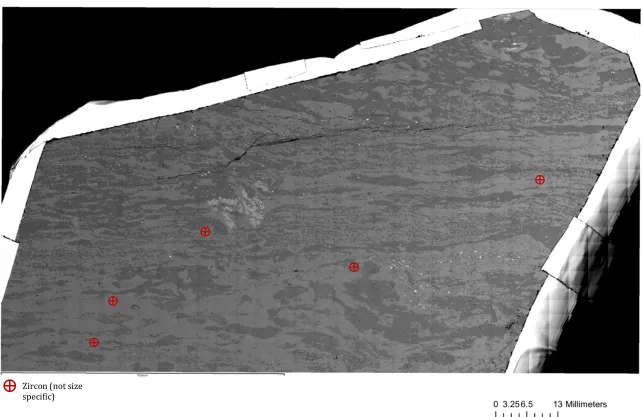
Figure 4-10. MicroGIS map of zircons imaged with BSE and EBSD in sample Wcc 2. ... 50
Figure 4-11. (A, B) Anhedral, sub-rounded metamorphic zircons. (C, D) Featureless metamorphic zircons exhibiting triple-grain junctions. (E) Igneous core mantled by fractured metamorphic zircon. ... 51
Figure 4-12. Grain 17451, aggregate of four metamorphic zircons. A: Band contrast image; triple junction at arrow. B: EBSD map colour coded by misorientation (misorientation < 2°). B: EBSD map colour coded by misorientation (misorientation < 2°). D: Misorientation profile along line shown in C. ... 52
Figure 4-13. Grain 17451, metamorphic zircon. A: EBSD map with Inverse Pole Figure (IPF) colouring of zircon grains. B: Pole figure plot of grain orientation colour coded with IPF colouring. ... 53
Figure 4-14. Photomicrograph of sample Wcc 4G. Q: quartz, Kf: potassium feldspar. Scale bar = 1000 µm. ... 55
Figure 4-15. MicroGIS map of accessory minerals in sample Wcc 4G. Zircons >10 um. ... 56
Figure 4-16. MicroGIS map of zircons imaged with BSE in sample Wcc 4G. ... 57
Figure 4-17. (A) Metamict zircon. (B) Metamict zircon with relict concentric zoning. ... 58
Figure 4-18. Photomicrographs of sample W2-2 in plane polarized light (left) and cross polarized light (right). B: biotite, G: garnet, Q: quartz, P: plagioclase. Scale bar = 1000 µm. ... 59
Figure 4-19. 5 mm garnet in sample Wcc 2 surrounded by quartz corona. G: garnet, Q: quartz, B: biotite. Scale bar = 1000 µm. ... 60
Figure 4-20. MicroGIS map of accessory minerals in sample W2-2. Zircons >10 um. ... 61
Figure 4-21. MicroGIS map of zircons imaged with BSE and EBSD in sample W2-2. ... 62
Figure 4-22. (A) Metamorphic zircon with sector zoning. (B, C, D) Metamict cores mantled by complexly zoned metamorphic zircon. Radial fractures due to expansion of cores. ... 63
Figure 4-23. Grain 801, metamorphic zircon with metamict core. A: Band contrast image; brittle fractures identified by arrows, metamict core not indexed by EBSD. B: EBSD map colour coded by phase showing micro-zircon. C: EBSD map colour coded by misorientation (misorientation < 2.5°). D: Misorientation profile along line shown in C. ... 64
Figure 4-24. Grain 801, metamorphic zircon with metamict core. A: EBSD map with Inverse Pole Figure (IPF) colouring of zircon grains. B: Pole figure plot of grain orientation colour coded with IPF colouring. ... 65
Figure 4-25. EBSD map of almandine garnet in W2-2, cumulative misorientation < 4°. ... 66
Figure 4-26. Pole figure plots of almandine garnet surrounding Grain 1770. ... 66
Figure 4-28. Grain 3011, monazite. A: Band contrast image. B: EBSD map colour coded by phase. C: EBSD map colour coded by misorientation (misorientation within monazite < 3°). D: Misorientation profile along line shown in C. E: Pole figure plots of monazite. ... 68 Figure 4-29. Misorientation map (left) and SE image (right) shows misorientation corresponding to brittle fractures (1,2), micro-zircons can be seen in SE image (3)... 69 Figure 4-30. IPF colour coded pole figures of micro-zircon. ... 69 Figure 4-31. Grain size distribution of sample Wcc 4G measured with NIS Elements. ... 71 Figure 4-32. Recrystallization features of Wcc 4G. 1: Qtz subgrain exhibiting undulose
extinction, 2,3: Qtz subgrains. 4: Recrystallized qtz grains exhibiting 120° triple junction. 71 Figure 4-33. Grain size distribution of sample W2-2 measured with NIS Elements. ... 72 Figure 5-1. Stress estimates based on quartz piezometry of sample Wcc 4G. A: Estimated stress
based on Stipp and Tullis (2003), B: Estimated stress based on Austin and Evans (2007) with P = 810 ± 100 MPa and T = 684 ± 50ºC, D: Estimated stress based on Shimizu (2012) with T = 684 ± 50ºC. Shaded region indicates range of results due to different methods of recrystallized grain size measurement. ... 78 Figure 5-2. Stress estimates based on quartz piezometry of sample W2-2. A: Estimated stress
based on Stipp and Tullis (2003), B: Estimated stress based on Austin and Evans (2007) with P = 810 ± 100 MPa and T = 684 ± 50ºC, D: Estimated stress based on Shimizu (2012) with T = 684 ± 50ºC. Shaded region indicates range of results due to different methods of recrystallized grain size measurement. ... 79 Figure 5-3. Differential stress of Wcc 4G and W2-2 predicted by Stipp and Tullis (2003)
compared to quartzite flow laws of Gleason and Tullis (1995), Luan and Paterson (1992) and Rutter and Brodie (2004) at a geothermal gradient of 20°C/km and strain rate of 10-12s-1
and estimated results of natural mylonites. Shaded region is the flow law of Lu and Jiang (2019) with strain rate between 10-13s-1 and 10-11s-1.Modified from Lu and Jiang (2019). .. 82
Figure 5-4. Differential stress of Wcc 4G and W2-2 predicted by Austin and Evans (2007) compared to quartzite flow laws of Gleason and Tullis (1995), Luan and Paterson (1992) and Rutter and Brodie (2004) at a geothermal gradient of 20°C/km and strain rate of 10-12s-1
and estimated results of natural mylonites. Shaded region is the flow law of Lu and Jiang (2019) with strain rate between 10-13s-1 and 10-11s-1.Modified from Lu and Jiang (2019). .. 82
Figure 5-5. Differential stress of Wcc 4G and W2-2 predicted by Shimizu (2012) compared to quartzite flow laws of Gleason and Tullis (1995), Luan and Paterson (1992) and Rutter and Brodie (2004) at a geothermal gradient of 20°C/km and strain rate of 10-12s-1 and estimated
results of natural mylonites. Shaded region is the flow law of Lu and Jiang (2019) with strain rate between 10-13s-1 and 10-11s-1.Modified from Lu and Jiang (2019). ... 83
List of Appendices
Appendix A. Imaging ...(Attached) Appendix B. Feature Lists ...(Attached)
Wcc 4M Feature List ...1
Wcc 2 Feature List ...110
Wcc 4G Feature List ...114
W2-2 Feature List ...132
Appendix C. Quartz Grain Statistics ...(Attached) Wcc 4G Grain Statistics ...1
W2-2 Grain Statistics ...19
Appendix D. GPS Coordinates ...(Attached) Samples ...1
Folds ...2
Foliations ...3
Chapter 1
1 Objectives and Geological Background
1.1 Introduction
The Grenville Front Tectonic Zone (GFTZ) is a region of complex polyphase deformation that is
yet to be completely understood with regard to the absolute age of different deformation fabrics.
Previous work by Li (2012) in the Grenville Front near Sudbury and the northeast Britt Domain
has established a sequence of deformation through overprinting relationships. The present thesis
sets out to test whether or not deformation conditions were sufficient to deform the accessory
geochronology mineral zircon such that it could be used to date the deformational event in which
the zircon was strained. This thesis investigates the microstructures associated with the regional
deformation in the GFTZ and estimates the deformation differential stresses using grain size
distribution of co-existing quartz in order to evaluate the deformation effect on zircon. The
significance of this study is twofold. First, while the Grenville orogeny has been studied for
decades, this will be the first investigation of quartz piezometry in the GFTZ. Estimating stress
in the Grenville Front adds to our interpretation of the Grenville orogeny and will help build a
clearer tectonic history. Second, these results further our general understanding of deformation
geochronology and its potential for dating lithosphere tectonic fabrics. I will introduce and
compare three piezometer calibrations for stress determination using grain size as well as
evaluate the limitations of using zircon to date deformation.
This thesis is organized in the following way. Chapter 1 will present the geological
background of the project and a description of the study area. Chapter 2 will be a review of the
determination. Chapter 3 will explain the materials and methods used in this thesis. Chapter 4
will present the results of the microstructural investigation and quartz grain size measurements.
Chapter 5 will include interpretations of stress estimates using quartz piezometers and discuss
the applicability of dating Grenvillian deformation with zircon. Finally, the Chapter 6 discussion
will summarize the findings of this report.
1.2 The Grenville Province (Orogeny and Geology)
The Grenville Province resulted from a series of accretionary and collisional events associated
with the collision of the North American craton, Laurentia, with magmatic arcs and continental
terranes linked with the assembly of supercontinent Rodinia (e.g. Rivers, 1997; Tollo et al. 2004;
McLelland et al., 2010). These events have been resolved into three separate orogenies. The
early- to mid-Mesoproterozoic Elziverian and Shawinigan orogenies (1250-1190 Ma and
1190-1140 Ma, respectively) which affected accreted terranes in the southwestern Grenville Province
and the late-Mesoproterozoic to early-Neoproterozoic Grenvillian orogeny which is further
subdivided into two orogenic phases: the Ottawan Phase (ca. 1080-1020) and the Rigolet Phase
(ca. 1000-980) (Rivers, 1997, 2008). The Grenville Province lacks overprinting from regional
metamorphism since the Grenville orogeny and thus is inherently useful in unravelling the
orogeny’s complicated tectonic history (Tollo et al., 2004).
The Grenville Front represents the northernmost boundary of penetrative deformation
resulting from the Grenville orogeny and separates the Grenville Province from the Southern and
Superior Provinces near Sudbury, Ontario (Lumbers, 1971). Rivers et al. (1989) divided the
Grenville orogen into three litho-tectonic belts, the Parautochthonous Belt, the Allochthonous
the Grenville Front is the Parautochthonous Belt. The Parautochthonous Belt represents the
reworked rocks of the foreland, increasing in metamorphic grade southeastward from the
Grenville Front. The Allochthon Belt follows the moderate to shallow southeast dipping
Allochthon Boundary Thrust and overlies the Parautochthonous Belt. It is characterized by its
exotic nature and evidence of having undergone pre-Grenvillian orogenic cycles. The Allochthon
belt is subdivided into a polycyclic and a monocyclic domain. The Allochthon Polycyclic Belt
shows evidence of tectonic activity from orogenies pre-dating the Grenville Orogeny. The
Monocyclic Belt Boundary Zone is a major shear zone that separates the polycyclic terrane of
the Allochthon Polycyclic Belt from the monocyclic rocks of the Allochthon Monocyclic Belt,
Figure 1-1. Lithotectonic map compiled from Carr et al. (2000) and Li (2012) using lithotectonic divisions by Rivers et al. (1989). Red arrow indicates study location.
Pembroke
Montreal Ottawa
1.3 The Grenville Front Tectonic Zone in the Sudbury area and
Polyphase Deformation
The Grenville Front is exposed for ~2000 km in a northeast trend at 065° to 070° and consists mostly of gneisses and migmatites with considerable amounts of anorthosite and other plutonic
rocks that have been subjected to deformation and metamorphism (Rivers et al., 1989; Davidson,
1984). The Grenville Front also includes lesser amounts of metavolcanics and metasedimentary
rocks (e.g. Davidson, 1984). The Grenville Front Tectonic Zone (GFTZ), a high-strain zone
adjacent to the Front (Lumbers, 1971; Wynne-Edwards, 1972), will be studied in detail in this
thesis. The GFTZ has a complex history of polyphase deformation, extensive uplift, faulting,
mylonitization, and metamorphism (Corfu and Easton, 2000). Li (2012) identified that three
major deformational phases have affected this region between 1079 and 953 Ma. The
deformational phases are referred to as D1, D2 and D3. It is important to note that each
deformational phase consists of a progressive deformational event that may develop many
generations of structures. In the Grenville Front, the three deformational phases of the Grenville
Front are associated with a total of four generations of folding and two generations of
transposition foliation. The final phase of deformation, associated with the Rigolet phase of the
Grenville orogeny (Li, 2012), gave rise to the features that are recognized today as the GFTZ.
The structural features in the GFTZ are summarized in Li’s (2012) block diagram (Figure 1-2)
The first phase of deformation (D1) includes two generations of isoclinal folding (F1, F2)
and the formation of a transposition foliation (ST1) as a result of the Ottawan orogenic phase (Li,
2012). F1 and F2 are generally rootless intrafolial folds. Due to their similar styles, F1 and F2 can
only be distinguished when an overprinting relationship is observed. When this overprinting
relationship is indeterminable, they are referred to as F1/2 (Figure 1-3). The orientation of F1/2
varies with ST1 foliation and overprinting by later fold generations. When overprinting is not
observed, F1/2 and ST1 are shallowly dipping. These fabrics are consistent with the features of
the high-grade nappe association (HGNA) described by Williams and Jiang (2005) and therefore
D1 is interpreted to be reflect a crustal scale shear zone (Li, 2012). Li (2012) identified the
formation of ST1 in D1 to be between 1080 and 1030 Ma.
The second phase of deformation (D2), resulting from NW-SE extension, produced
northwest-trending regional scale folds (F3) (Culshaw et al., 1994; Li, 2012). F3 folds are
generally open to tight with larger interlimb angles than F1/2 (Li 2012). F3 folds cannot be
observed on outcrop due to their large amplitudes usually greater than 5 km; F3 folds are visible
in satellite images and regional maps (ex. Figure 1-8) (Rivers et al. 1989; Davidson, 1995; Harris
et al., 2002; Schwerdtner et al., 2016). Li (2012) constrained the timing of F3 folds in D2 to be
between 1028 and 1018 Ma.
The last dominant phase of deformation (D3) was a result of NW-SE shortening in the
Rigolet orogenic phase (Li, 2012). This phase is the last major phase of deformation to affect this
region; the folds, foliation, and mylonitization resulting from D3 define the high shear zone that
is recognized as the GFTZ. This tectonic shortening resulted in the development of mylonitic
foliation at the Front and overprinting of the previous fold generations (F1-F3) with folds of Figure 1-3. F1/2 rootless intrafolial fold in the Wanapitei region. Solid line indicates axial trace, dashed line indicates ST1/2 transposition foliation. Fold hinge
1-4,1-5) and are typically chevron style. Localized high strain zones of the D3 generation are
common and, in such zones, F4 is transposed resulting in a second generation of transposition
foliation (ST2), parallel to the axial plane of F4. D3 also resulted in a NE-SW trending mylonite
zone adjacent to the Grenville Front. More distally, F4 folds have larger interlimb angles (Figure
1-5). The overprinting of D3 on D2 is not usually observable on an outcrop scale due to the
difference in fold-scale (Li, 2012). However, D3/D1 overprinting can be distinguished by the
difference in fold style (Figures 1-5,1-7). The style and consistent orientation of F4 imply that it
was a separate and overprinting event on F3 (Li, 2012), corroborating the hypothesis that the
GFTZ was a result of polyphase deformation (Brocoum and Dalziel, 1974) rather than
progressive top-to-the-NW shearing (La Tour, 1981). Li (2012) suggested the timing of
deformation and mylonitization in D3 to be between 1000 and 953 Ma.
Figure 1-6. F4 fold with larger interlimb angle and F4 parasitic fold in migmatitic gneiss with syn-D3 pegmatitic intrusion. Approx. 12 km SE of study area.
Lumbers (1971) reports an assortment of dykes that are common in the GFTZ. Quartz
monzonite dykes cut early and mid-Precambrian rocks and are deformed and recrystallized by
the subsequent polyphase deformation. They are found within a kilometer NW and SE of the
Grenville Front boundary. Recrystallized and deformed granite pegmatite dykes are present
within a few kilometres SE of the boundary. In the gneissic country rock of the study area,
recrystallized and deformed granite pegmatite dykes were emplaced syn-tectonically with D3
deformation (Figure 1-8).
1.4 Study Area and Sample Setting (Wanapitei Complex)
This study includes samples from the Wanapitei Complex and surrounding country rock. The
Wanapitei Complex is an igneous pluton described as a 6 km by 2.5 km oval-shaped body with
long axis trending northeast and is located about 0.4 km southeast of the Grenville Front near
Sudbury, Ontario (Rousell and Trevisiol, 1988) (Figure 1-9). The Wanapitei Complex was
mapped by Rousell and Trevisiol (1988) as primarily injection breccia, which is a magmatic
breccia formed during intrusion (Tǎ maș, 2002; as cited in Tǎ maș and Milési, 2002), with some
felsic dykes and hornblende gabbro in the southwestern two-thirds and recrystallized gabbro,
hornblende gabbro, gabbronorite and norite in the northeastern most section. The complex has
been subjected to amphibolite facies metamorphism (Figure 1-10). The crystallization age of
zircon geochronology, the zircons from the complex have a Grenvillian-aged lower intercept age
on a concordia plot (996 Ma) (Prevec, 1995). Geochronology was completed on extracted zircon
grains described as having subhedral to anhedral prismatic forms. Due to the pre-Grenvillian
emplacement of the Wanapitei Complex, this complex is of particular interest when unravelling
the deformational history of the GFTZ.
Li (2012) proposed constraints on the timing of deformation in the GFTZ and confirmed
that the Wanapitei Complex metagabbro was subjected to all three phases of deformation. Li
(2012) correlated regional structures dated by Corrigan et al. (1994) and Ketchum et al. (1998) in
the Shawanaga and Parry Sound Domains, ~100 km southeast of the Wanapitei Complex, to
Grenvillian structures in the GFTZ. Along with U-Pb dating of zircons in four samples (two of a
dioritic dyke in the GFTZ, one of the Wanapitei Complex and one of a pegmatite dyke east of
the Wanapitei Complex), Li (2012) proposed the timing of deformation in the GFTZ to be: D1
(ST1 foliation): 1079-1030 Ma, D2 (F3 folds): 1028-1018 Ma and, D3 (F4 and mylonite zones):
1000-953 Ma. U-Pb dating of separated zircons was completed by targeting of distinct growth
zones using cathodoluminescence (CL) imaging. In the Wanapitei Complex sample, Li (2012)
Figure 1-10. Wanapitei Complex amphibolite. (A) Massive garnet amphibolite. (B) Garnet amphibolite with plagioclase pressure shadows. (C) Massive garnet amphibolite adjacent to highly strained
amphibolite.
A B
recrystallization of relict igneous grains due to their irregular shapes and patchy zonation. U-Pb
geochronology of these zircon grains suggested the timing of this deformation within the
complex to be 1079-953 Ma. Two spots on one grain revealed an igneous age of more than 1800
Ma which was interpreted to be an inherited grain from the country rock. One additional spot on
an igneous zircon with partial recrystallization corresponded to the crystallization age of the
complex. The complex is crosscut by mafic and felsic dykes that were subjected to the same
deformation as the complex (Li, 2012).
The country rock of the complex is comprised of supracrustal rocks most likely derived
from the Huronian Supergroup (Ames et al., 2005), the age of the country rock is unknown. In
the area, country rock is primarily garnet-biotite gneiss and migmatized garnet-biotite gneiss and
metasedimentary rocks with pegmatitic intrusions (Figure 1-10, 1-11).
In this thesis, microstructural investigations are conducted on four samples from D3 high
strain zones. Samples Wcc-2 and Wcc-4m are hornblende metagabbro collected from the
Wanapitei Complex (Li, 2012), sample Wcc-4g is a granitic dyke that is believed to have
crosscut the complex pre/syn-D3 deformation (Li, 2012), and W2-2 is a garnet-biotite gneiss
collected from the country rock. The next chapters will explore these samples in detail to assess
the feasibility of constraining a higher resolution temporal history of D2 and D3 deformation in
the area by in situ zircon analysis and stress estimates of the deformation conditions.
Chapter 2
2 Review of methods
A comprehensive characterization of the Grenville Front deformation requires investigation to
take place at multiple scales. Work by Li (2012) described the regional deformation of the
Wanapitei area and performed U-Pb zircon geochronology on several samples. In situ
microstructural analysis of the textures and zircons from samples in this area will allow the
re-interpretation of earlier zircon ages within their deformational context as well as the
investigation of additional coeval phases. If zircon grains show evidence of deformation,
discordant dates have a significant probability of defining the timing of deformation in the
Wanapitei Complex. Lack of strain, however, would indicate that deformation did not reach the
extent to cause permanent deformation in zircon grains or that zircon crystallization post-dated
deformation. Correlation of zircon deformation to structural features and corresponding
discordant ages would allow for more confident estimations of the timing of deformation. If they
do not exhibit structural evidence of the deformational events of the Grenville orogeny, the
discordant dates interpreted to be the timing of deformation by Li (2012) may not be accurate. A
stress estimation of the samples using quartz piezometry will provide insight into the factors that
control zircon deformation.
2.1 Microstructural Investigation of in situ Zircon
Zircon (ZrSiO4) can be examined microstructurally and chemically to reveal information about
both the zircon and its host rock’s history. It is one of the most common accessory minerals used
dating old events that the radiometric dating of other trace elements cannot. Additionally,
zircon’s high resistance to chemical and mechanical alteration makes it very durable and able to
survive considerable metamorphism. This makes zircon a prime target for isotopic dating in
deformed and metamorphosed rock such as that found in the Grenville Front Tectonic Zone
(GFTZ).
The importance of microstructural analysis of chemical and orientation variations in
grains in tandem with U-Pb dating has become universally acknowledged as the internal
morphology of zircon is highly variable and can provide insight about the formation of the
mineral (e.g. Gagnevin et al., 2010). Electron microscope imaging using cathodoluminescence
(CL) or back-scattered electrons (BSE) can be used to decipher different growth domains and
internal textures, thus allowing conclusions to be made on the origin of the zircon, strain and
chemical alteration (Hanchar and Miller, 1993; Corfu et al., 2003). The integration of these
microanalytical techniques combined with in situ geochronology has resulted in the capacity to
date tectonothermal events with improved accuracy. Analysis of metamorphic growth zones
using high-resolution ion-microprobe has allowed temporal constraints to be made in
polymetamorphic zircon (e.g. Möller et al., 2003; Liu et al., 2013; Liati et al., 2016).
Additionally, investigations of the effects of plastic deformation on trace element mobility has
determined that U-Pb isotopic age may be reset through enhanced trace element diffusion
(Reddy et al., 2006; Piazolo et al., 2016); and therefore, used to date deformational events (e.g.
Moser et al., 2009; Piazolo et al., 2012; Kovaleva et al., 2016; Kovaleva et al., 2017). The
method of dating strained lattice domains in zircon is referred to as zircon strain chronometry
(e.g. Moser et al., 2009). There is a significant interest in the relationship between plastic
it can be difficult to confirm the peak-metamorphism origin of metamorphic zircons and
correlate them accurately to a target event (Möller et al. 2007; Kohn et al., 2015). Therefore,
constraining the relationships of zircon strain chronometry is key to dating areas of multiple
metamorphisms and specific deformational events with zircon.
A study by Reddy et al. (2006) was the first to identify crystal-plastic deformation of
zircon under crustal conditions and deformation enhanced fast-diffusion of trace elements in
zircon. This led to the recognition of the importance of intra-grain deformation in isotopic dating.
Moser et al. (2009) demonstrated that in zircon grains exhibiting crystal-plastic deformation, Pb
loss can occur at an accelerated rate compared to in a pristine lattice (e.g. Moser et al., 2009).
Elemental redistribution occurs through pipe diffusion along dislocation arrays. Pb and other
trace elements diffuse rapidly along these arrays while isolated dislocations or closed networks
act as structural sinks where trace elements pile up (Piazolo et al., 2016). In this process, Pb is
“lost” from the dislocation, resulting in a discordant age of deformation. Zircon strain
chronometry has been completed in cases of lattice distortion related to impact events (Moser et
al., 2009; Moser et al., 2011); seismicity (Kovaleva and Klötzi, 2017); and in deformation due to
regional tectonics (Piazolo et al., 2012; MacDonald et al., 2013). This new avenue holds the
potential to improve the geochronological resolution of tectonic events significantly. However,
the accuracy of this method and the prevalence of zircon lattice strain in regional tectonics are
currently unconfirmed.
Piazolo et al. (2012) identified three lattice distortion patterns in deformed zircon
porphyroclasts (0.8 – 1.5 mm); similar patterns are described in smaller zircon grains (10 – 50
µm) by Kovaleva et al. (2014). Type I lattice distortion involves gradual lattice bending with
within a single grain (Kovaleva et al., 2014). Type II distortion is an indent-type pattern in which
distortion is concentrated in a concentric pattern around a contact point that results in half-circle
shaped deformation zones of ~0.8-1°/µm (Piazolo et al., 2012) or ~25-40° of misorientation within a single grain (Kovaleva et al., 2014). Type III distortion is described as localized
crystal-plastic deformation due to internal heterogeneities or coupling with a strong host; Type III
distortion forms a network of low angle boundaries and subgrain boundaries separating grains
with 3-10° of internal distortion. The U-Pb system of deformed grains in Piazolo et al. (2012) displayed discordance broadly correlating to an amphibolite facies reworking, with most precise
dating from Type I and II patterns and a broader range in values from Type III patterns. Kovaleva
et al. (2017) also concluded that gradually bent Type I and Type II patterns may accurately date
ductile deformation of zircon. However, caution must be used when dating deformed zircon
grains due to the large variability in U-Pb ages (Piazolo et al. 2012).
Despite the usefulness of zircon strain chronometry, this method of age determination is
only pertinent in areas where zircon lattice distortion is observed and can be sufficiently
analysed.For example, in a study from the Lewisian gneiss complex of northwest Scotland,
MacDonald et al. (2013) found that only 5% of 99 zircon grains exhibited lattice distortion, a
fraction of which were able to be linked temporally to a deformational event. Defining sample
criteria and determining the governing conditions of lattice strain in zircon are essential to
establish the applicability of zircon strain chronometry and the circumstances under which it can
be employed. Moser et al. (2009) outlined sample criteria required for zircon strain chronometry;
(1) Zircon must be devoid of radiation damage that occurs below the closure temperature of
analytical and spatial resolution so that a correlation of discordance with zircon microstructure
can be established. Samples should also be devoid of fractures, high- and low-angle boundaries
and pores, and analyses should be done ~5 µm from the deformation front and 5-10 µm from
boundaries to avoid contamination of results (Kovaleva et al., 2017). The factors that control
lattice distortion also need to be investigated to determine how widespread its applicability is.
Possible factors on the presence and pattern of zircon lattice distortion within natural shear zones
include: temperature, distribution, magnitude and direction of differential stress, grain shape and
host matrix (Kovaleva et al., 2014), internal mechanical weakness and grain orientation
(Kovaleva et al., 2016; Kovaleva et al., 2018).
Yield strength is the stress that exceeds the elastic limit of a mineral and the point at
which permanent plastic deformation occurs (Passchier and Truow, 1996). The yield strength of
a mineral is affected by temperature and strain rate; therefore, the yield strength of zircon at
crustal conditions is an important foundation for defining the parameters that control zircon
lattice distortion. Although zircon is universally recognized as a strong mineral (bulk modulus
203±13 GPa), zircon is more susceptible to differential stress than expected, with a lower shear
modulus than olivine (Morozova et al., 2017). Experiments have explored the yield and tensile
strengths of zircon at room temperature and temperatures higher than 980°C, there is a gap of
knowledge currently regarding zircon lattice strength between these temperatures (Figure 2-1).
Yield strengths have been defined as Y=1830 MPa by shock compression at room temperature
(Mashimo et al., 1983), and 400 – 5000 MPa at room temperature in the confining pressures
range between 1 and 32 GPa using a diamond anvil cell (Morozova et al., 2017). Wygant (1951)
identified the yield of dislocation creep of zircon in a high-T torsion apparatus to be 8.9 MPa at
elevated-temperature tensile strength of zircon to be 60 MPa and 25 MPa at 980°C and 1200°C,
respectively. Similarly, Glenny (1956) found tensile strengths of 42 MPa at 980°C and 21 MPa
at 1200°C. In these tests, tensile strength was defined as the maximum tensile stress the material
could withstand before brittle fracture/rupture. Given this definition and the general stress-strain
curve, the tensile strength may be treated as an approximate boundary between the plastic
behaviour of zircon and brittle failure. Therefore, tensile strength is considered an upper limit of
stress in zircon plastic deformation.
This study explores the possibility of better correlating the dates previously obtained to
the final D3 deformation. In situ investigation of zircon within D3 structures using
microstructural imaging will allow their internal morphology within specific kinematic features
to be studied, drawing conclusions on the presence and conditions of zircon lattice distortion.
Zircon grains deformed in D3 would provide the potential to date this phase of deformation with
more accuracy than previous work. This study will also enhance the current knowledge of the
factors that influence lattice strain in zircon.
2.2 Methods of stress determination: A review of theory and
methods
2.2.1 Using recrystallized grain size to determine stress
The Grenville Front Tectonic Zone (GFTZ) is the locus of a series of deformational
events resulting from the Grenville orogeny. Deformation and metamorphism in the GFTZ are
widespread and can be seen at various scales. On a microstructural scale, the effects of
deformation can be observed through recrystallized grain size. Recrystallization is a
microstructural response to deformation that lowers the internal free energy of a mineral by
producing new finer grains (Passchier and Truow, 1996). Recrystallization is separated into two
forms. First, dynamic recrystallization is synchronous with deformation and results in grain size
reduction. Dynamic recrystallization is interpreted to occur through two distinct processes: (1)
subgrain rotation and (2) grain boundary migration (Lloyd, 1994). Subgrain rotation occurs when
a grain is progressively strained and the increase in misorientation angle results in the formation
of a new grain boundary. The critical angle for quartz where this formation occurs is
and low temperatures while Grain boundary migration generally occurs at higher temperatures
(Winter, 2010). Grain boundary migration produces irregularly shaped grains as a result of
relatively strain-free grains with a low density of defects consuming grains with higher defect
density (Lloyd, 1994). Second, static recrystallization, or annealing, is a recrystallization process
that occurs at elevated temperatures devoid of deformation (Urai et al., 1986). During annealing,
grain growth results in polygonal grains with straight boundaries (Heilbronner and Tullis, 2002).
This process reduces the surface area of affected grains thus lowering the internal energy state of
the grains (Otani and Wallis, 2006). Dynamic recrystallization occurs to reduce the effects of
strain and thus can be used to interpret the deformational history of a rock including flow stress
and deformation temperature (e.g. Stipp et al., 2002; Stipp et al., 2010). The recrystallized grain
size of several samples will be used to investigate the microstructural effects of deformation
produced by the Grenville orogeny and extrapolate this information to draw conclusions on the
microstructural response of other minerals in D3 deformation.
Paleopiezometry utilizes structural characteristics of a rock to estimate the differential
stresses at the time of deformation. In this instance, recrystallized grain size piezometry will be
utilized. Twiss (1977) introduced the original theory behind grain size piezometry. In the
theoretical equation, Twiss (1977) described a relationship where recrystallized grain size and
subgrain size were dependent on differential stress and insensitive to temperature. The general
form of recrystallized grain size piezometers based on Twiss’ (1977) theory is:
!" = $ ∙ &'( (1)
where ds is steady state recrystallized grain size in µm, s is stress in MPa and A and m are
empirically determined constants (Austin and Evans, 2007). Since the grain size piezometer’s
including quartz (Stipp and Tullis, 2003), olivine (Ross et al., 1980), halite (Guillopé and Poirier,
1979), calcite (Schmid et al., 1980), and feldspar (Post and Tullis, 1999). New models for grain
size piezometry have also been introduced (e.g. Austin and Evans, 2007; Shimizu, 1998).
Differences in piezometric models and calibrations arise from debates related to dependence of
recrystallized grain size on internal and external factors such as: grain growth kinetics,
temperature, creep activation energy, grain size distribution of the deforming aggregate and
operating recrystallization mechanisms (e.g. Stipp et al., 2003; De Bresser et al., 2001; Austin
and Evans 2007; Shimizu, 2008, 2012). Though the relationship between recrystallized grain size
and stress state has been extensively studied, no universally accepted relation exists presently.
Additionally, piezometers have usually been calibrated based on experimental results and have
unknown accuracy when extrapolated to natural samples. Three prominent studies are the
paleopiezometers of Stipp and Tullis (2003) and Shimizu (2012); and the paleowattmeter of
Austin and Evans (2007). These three relations will be reviewed and compared in the following
section.
2.2.2 Stipp and Tullis (2003)
While conducting a calibration of the paleopiezometer of Twiss (1977), Stipp and Tullis (2003)
were the first to recognize the importance of the different mechanisms of dynamic
recrystallization in piezometric calibrations. Stipp and Tullis (2003) used the dislocation creep
regimes of Hirth and Tullis (1992) to investigate the dependence of grain size on differential
stress in different dynamic recrystallization mechanisms.
Hirth and Tullis (1992) identified that deformed quartz is accommodated by three
regimes of dislocation creep. Each regime is associated with characteristic microstructures
rate. Under this regime, grain boundary migration (GBM) acts as the dominant recrystallization
mechanism. The transition to Regime 2 occurs with an increase in temperature or a decrease in
strain rate. This, in turn, means a decrease in flow stress. In Regime 2, recrystallization is
controlled by subgrain rotation (SGR). Lastly, a further increase in temperature or decrease in
strain rate results in the transition to Regime 3. Regime 3, or general recrystallization, describes
the operation of both mechanisms at once.
Using a Griggs apparatus to deform Black Hills quartzite, Stipp and Tullis (2003)
observed recrystallized grain sizes between 3.2 ± 0.7 and 46 ± 15 µm with microstructures
corresponding to Regime 2 and 3. Combining that data with unpublished data from Bishop
(1996; presented in Post and Tullis, 1999, as cited in Stipp and Tullis, 2003) (Figure 12), it was
determined that dynamic recrystallization under Regime 1 results in a different slope
(piezometric exponent, m) than Regimes 2 and 3. Regimes 2 and 3 fit the same relation and had
no change in slope at the Regime 2/3 transition. Stipp and Tullis (2003) hypothesized this
variance could be due to different dominant recrystallization mechanisms.
In Stipp and Tullis (2003) recrystallized grain size was expressed by two equations:
Regime 1 ) = 10-./0±2.--∙ &'2.3-±2.24 (2)
Regimes 2 and 3 ) = 105.63±2.78∙ &'-.73±2.-5 (3)
where D is the root mean square (RMS) average grain size in µm and & is flow stress in MPa.
This piezometer was deemed effective for the grain sizes recorded in Stipp and Tullis (2003) (~3
to 45 µm). Stipp and Tullis (2003) did not identify any dependence of recrystallized grain size on
temperature or the 9-βquartz transition. Stipp et al. (2006) added that there is no independent
effect of water content or strain rate on recrystallized grain size. Therefore, it was concluded that
recrystallized grain size was dependent on flow stress (&) and the dominant recrystallization
mechanism.
More recently, Stipp and Tullis (2010) revisited the 2003 quartz grain size piezometer
with natural samples. The natural data set granted the ability to examine a much larger range of
grain size distribution than in experimental samples. The recrystallized grain size distribution of
natural quartz samples in Stipp and Tullis (2010) ranged from ~2.5 µm to 2.8 mm. It was found
that distinct grain size distribution peaks separated by minima correlated to the dominant
operation of one of three main recrystallization mechanisms, bulging recrystallization (BLG),
subgrain rotation recrystallization (SGR), and grain boundary migration (GBM). When these
results were compared to the 2003 piezometer (Stipp and Tullis), it was determined that all three
regimes of Hirth and Tullis (1992) are mostly contained within the BLG grain size fraction of
Stipp and Tullis (2010). Therefore, the earlier piezometer can only be reliably applied to grain
size distributions resulting from BLG recrystallization. Stipp and Tullis (2010) found that the
piezometer could apply reasonably well to SGR but resulted in significant underestimates of
needed for each recrystallization mechanism as well as the necessity for additional research of
natural samples at larger grain sizes. Cross et al. (2015) also presented a recrystallized grain size
distribution of quartz from a natural mylonite (10 to 100 µm) that matched within error to Stipp
and Tullis (2003). Due to sample features reviewed in Chapter 4 and 5 Stipp and Tullis (2003)’s
Regime 2/3 quartz piezometer which will be used with consideration of its limitations.
2.2.3 Austin and Evans (2007)
Austin and Evans (2007) introduced the paleowattmeter as a scaling relation between
dynamically recrystallized grain size and stress at a steady state. Austin and Evan’s model
postulates that recrystallized grain size is a factor of both strain rate and stress, while most
paleopiezometry only considers the latter. The paleowattmeter suggests that recrystallized grain
size is dependent on the rate of mechanical work done during dislocation creep. Dislocation
creep is a deformation mechanism in which dislocation glide is balanced by recovery
mechanisms. Whereas dislocation glide increases the density of free dislocation and the energy
within the system, recovery mechanisms (i.e. subgrain formation and recrystallization) lower the
internal free energy of the system so that a steady-state creep can be sustained. The
paleowattmeter is contingent on the assumption that the internal energy increase due to
dislocation glide is only partly dissipated by recovery and the remaining internal energy increase
is related to the recrystallized grain size. Work done by diffusion creep is wholly dissipated. The
steady state grain size occurs when there is a balance between the rates of dynamic grain size
reduction and normal grain growth. Austin and Evan’s model includes a dependence of
recrystallized grain size on temperature, consistent with multiple paleopiezometers. However,
paleowattmeter predicts average grain size at a steady-state (100% recrystallization) (Austin and
Evans, 2009) and may therefore not be applicable to partially recrystallized samples (Kidder et
al., 2016). The paleowattmeter is not dependent on the operating recrystallization mechanism
(Austin and Evans, 2009).
Recrystallized grain size as expressed in Austin and Evans (2007) is as follows:
!"-:; = <=>?@ ( BC=
DE);BGHI
JKL̇NOPQ (4)
where: ds is steady state grain size in µm, Kg is the grain growth rate parameter in µm-ps-1, Qg is
the activation energy of grain growth in kJ/mol, R is the universal gas constant in J×K-1×mol-1, T
is absolute temperature in K, p is the exponent in the normal grain growth law
(non-dimensional), c is a geometric constant (non-(non-dimensional), R is the average specific grain
boundary energy in J/mol2, S is the fraction of work done by dislocation creep that is not
dissipated (non-dimensional), & is differential stress in MPa and ṪUV"W is the strain rate of
dislocation creep in s-1.
Experimentally determined flow laws describe the rheological behaviour of a mineral and
must be used to relate the dislocation creep strain rate (ṪUV"W) to the differential stress. There are a
few different dislocation creep flow laws for quartzite (e.g. Gleason and Tullis, 1995; Luan and
Paterson, 1992; Hirth et al., 2001; Rutter and Brodie, 2004). Austin and Evans (2007) originally
employed the quartz flow law of Hirth et al. (2001). The variation in quartz flow laws is mainly a
result of differingQ values (activation energy); i.e. 223 ± 56 kJ/mol (Gleason and Tullis, 1995), 152 ± 71 kJ/mol (Luan and Paterson, 1992), 135 ± 15 kJ/mol (Hirth et al., 2001), and 242 ± 24 kJ/mol (Rutter and Brodie, 2004). Lu and Jiang (2019) introduced a new quartz flow that
reconciles the difference between Q values among previous laws. In place of the activation
enthalpy for dislocation creep is the activation energy of the system (Q) plus the product of the
activation volume (V) and pressure (P). It was previously believed that the pressure effect was
not significant in flow law equations pertaining to the deformation in the crust due to the small
range of pressure at which deformation occurs (i.e. activation enthalpy @ activation energy).
However, Lu and Jiang (2019) found that the magnitude of difference in confining pressure in
previous experiments can account for over 10% variation in Q and therefore considering the PV
term is critical. The use of the activation enthalpy, as well as the inclusion of water fugacity in
the flow law, accounts for the influence of pressure on strain rate.
My results will use the updated flow law of Lu and Jiang (2019):
Ṫ = (6.0 ± 5.0)Z10'-6[
\7.8exp (`:abcd )&4 (5)
where: fwis water fugacity in MPa, Q is activation energy in J/mol (Q = 132±5 kJ/mol as
determined by Lu and Jiang (2019) as an average of existing experimental data), P is pressure in
MPa,V is the activation volume for wet quartzite in cm3/mol (35.3 cm3/mol), &is differential
stress in MPa, R is the universal gas constant in J×K-1×mol-1 and T is temperature in K.
2.2.4 Shimizu (2012)
Shimizu (1998) introduced a new piezometry model based on the nucleation and growth model
of dynamic recrystallization, the piezometer relates the SGR nucleation rate and grain growth by
GBM as functions of stress and temperature and therefore applies to Regime 3 recrystallization.
In subsequent work (Shimizu, 2008, 2012) this piezometer has been calibrated and revised, as
outlined below.
Shimizu’s major criticisms of previous piezometers included consideration of the change
effects of surface energy on grain growth. Firstly, Shimizu (2008) stipulated that different
piezometers are required for 9 and β quartz due to the change in activation energy of oxygen
diffusion and grain boundary diffusion at the 9-β transition as they are both temperature
dependent processes. Shimizu (2008) uses the coefficient of volume diffusion (Dv) and the
diffusion coefficient at the grain boundary (Dgb) from Farver and Yund (1991a) and Giletti and
Yund (1984) to determine Qv and Qgb of β quartz. For 9 quartz, Shimizu (2008) uses the Dv of
Farver and Yund (1991b), Dgb is assumed to be continuous at the transition temperature, and the
ratio of Qv to Qgb in 9 quartz is assumed to be equal to that of βquartz. The separation of this
piezometer into two distinct relations results in a change in the temperature dependence of flow
stress at the 9-β transition. Shimizu (2008) identified that recrystallized grain size shows a low
dependence on temperature at high temperatures (>800°C) and a higher dependence at lower
temperatures. Secondly, Shimizu (2008) argues shortcomings in previous methods of grain size
data collection. Shimizu (2008) notes the fact that grain size distribution is not considered in
earlier piezometers. Conventionally, the mean recrystallized grain size is used for quartz
piezometers. However, in the case of steady-state recrystallized samples, grain size distribution
is typically log-normal, meaning that the highest volume grain size may not align with the
average grain size (i.e. Figure 2-3). Shimizu (2008) argues that in that case, the median
recrystallized grain size would be more representative of the steady-state grain size of most
samples. Considering this claim, the difference in the median and mean recrystallized grain size
Lastly, in Shimizu (2012) the influence of surface energy (grain boundary energy) was
incorporated into the Shimizu model. Surface energy drives grain coarsening in static state by
means of larger grains growing at the expense of smaller grains. Therefore, surface energy acts
as a drag force in strain-energy-driven GBM. The influence of surface energy on grain growth
rate is accounted for in a non-dimensional constant (B) in the calibration of Shimizu (2012)’s
piezometer which has the general form:
U
e= f° h K ij
';
exp h− ∆`
(cdj (6)
where f° = m(\n°=o
en°p )
-/( (7)
and ∆r = rse − rH (8)
d is steady state grain size in µm, b is the length of the Burgers vector in m, B is a
non-dimensional scaling factor, s is differential stress in Pa, µ is shear modulus in Pa, p is the non-dimensional stress exponent of recrystallized grain size, w is grain boundary width in m, Do
gb is a
constant, Dov is a constant, m is a non-dimensional scaling parameter, Qgb is the activation
energy of grain boundary diffusion in J×mol-1, Q
c is the activation energy of dislocation creep in Figure 2-3. Theoretical comparison of mean, median and mode in a
J×mol-1, R is the universal gas constant in J×K-1×mol-1 and T is temperature in K. With these
modifications, and the correction of a numerical error in Shimizu (2008), recrystallized grain size
expressed in Shimizu (2012) became:
9-quartz ! = 9.98 ∙ 107∙ &'-.76exp(-7.4 vw/(xW
cd ) (9)
β-quartz ! = 1.82 ∙ 105∙ &'-.76exp (8.76 z{ |}Q
cd ) (10)
where d is the steady-state grain size in µm, & is differential stress in MPa, R is the universal gas
constant in J×K-1×mol-1 and T is temperature in K.
The Shimizu piezometer is deemed suitable for high-temperature samples recrystallized
by SGR and GBM. However, this relation is not suitable to rocks deformed at low-temperature
Chapter 3
3 Materials and Methods
Figure 3-1 indicates the sample locations chosen for this thesis. The rationale was to choose
samples of varying stress state and composition to evaluate the ability to use U-Pb zircon strain
chronometry to date Grenvillian deformation. Foliation in the area was primarily identified as
NE-SW trending transposition foliation (ST2). Samples were chosen from these D3 structures.
The southwestern two-thirds of the complex are obstructed by swamp/marsh area and private
properties, the northeastern most section is poorly exposed. Therefore, field work was limited to
the northeastern most area of the complex along HWY 537 (~500 m west of highway).
3.1 Sample preparation and imaging
Figure 3-1. Left: Map of sample locations. Right: Stereonet representing field measurements of ST2 foliation and D3 fold hinges.
537
Wcc 4M, Wcc 4G and Wcc 2 are samples collected by Li (2012). W1-1/W1-2, W2-1/W2-2 and
W3 were collected for this thesis, sample descriptions are listed in Table 1. The samples were cut
perpendicular to D3 foliations and prepared as 30-micron thin sections, with the exception of
Wcc 2, which was viewed under scanning electron microscope as a rock slab, thin sections for
Wcc 2 were later made for optical investigation. Preliminary imaging was done with a
backscattered electron (BSE) map of each sample. The BSE samples were carbon coated for
electrical conductivity. Element composition mapping was also completed for each sample.
Table 1. Sample descriptions.
*Petkau (2017) refers to field work associated with this study
3.2 Zircon selection and analysis
The largest zircon, baddeleyite and monazite grains were chosen for detailed analysis with BSE
and Electron Backscatter Diffraction (EBSD) as these were the best targets for follow-up U-Pb
dating. The BSE imaging displays the variation of average atomic number in a phase and internal
elemental variations by grayscale, which can correlate to different growth phases or zones of
secondary recrystallization or alteration. BSE images were taken using a Hitachi SU6600 FEG-Sample Collection Rock Type Mineralogy Foliation (strike/dip) Lineation (plunge/trend) Cut
Wcc 4M Li (2012) Wanapitei metagabbro
(1747 +6/-5 Ma) Hbl, plag, bt, ilm, gt not oriented N/A
perp to foliation, defined by biotite
Wcc 4G Li (2012) Granitic dyke (age unknown) Qtz, albite, ilm, trace
biotite not oriented N/A
perp to foliation, defined by quartz ribbons
W3 Petkau (2017) Biotite garnet gniess (age unknown) Qtz, bt, grt, trace ky N/A Not measured in field parallel to lineation Petkau (2017) Qtz, bt, grt, trace ky
perp to foliation, defined by
coarse grained quartz layers parallel to lineation
perp to foliation, weakly
defined by bt 2-1 parallel to lineation
2-2 perp to lineation perp to foliation, weakly
defined by bt 1-1 parallel to lineation
1-2 perp to lineation
Qtz, bt, grt, trace ky
N/A
Petkau (2017) Biotite garnet gniess (age unknown)
Biotite garnet gniess
(age unknown) 085/79
Wanapitei metagabbro
(1747 +6/-5 Ma) not oriented Li (2012) Hbl, plag, trace bt, ilm and gt
W2-1/W2-2 W1-1/W1-2 WCC-2
260/32 stretching lineation
SEM (Field Emission Gun Scanning Electron Microscope) with an emission current of 3.6
microA and an accelerating voltage of 15 kV. Working distance was 9800 µm, at 80x
magnification.
EBSD was also used to map internal variations in lattice orientation and crystallinity
(order). The EBSD method entails using a series of computations to determine the phase and
orientation of samples at a set spatial resolution (step size ~ 0.1-0.15 µm). Interaction of the
incident beam with the sample results in an output of a pattern of diffracted electrons (EBSP)
which consists of Kikuchi bands at different angles and intensities that correspond to lattice
planes orientation, spacing and diffraction efficiency (intensity) comparable to an X-ray pattern
(Reddy et al., 2007). The EBSP is then analyzed by EBSD post-processing software (Oxford
Instruments HKL Channel 5) that detects and analyses these properties of Kikuchi bands using
the Hough transform and compares the output to a reference library, set up by the user, of model
EBSP characteristics. This allows the sample to be indexed by phase and orientation with an
angular resolution of ~0.5° following the methods in Moser et al. (2011). The “Tango” program
allows the user to make measurements and maps based on information indexed during EBSD.
“Tango” was used to map the internal misorientation of individual grains within the samples. A
specific point within the target is chosen as a reference point, following which the relative
misorientation throughout the grain is presented using a colour gradient. The misorientation
profile shows the relative lattice misorientation of a line drawn through the crystal (noise ~0.5°).
By examining the internal orientation within a grain, lattice distortion, if present, can be
identified. The “Mambo” program can also be used to observe crystallographic orientation and
normals to display relative crystallographic orientation. Data were plotted in “Mambo” using
lower hemisphere, equal area projections.
Target zircon grains are those of igneous origin with significant lattice distortion
(>0.3°/µm (Piazolo et al., 2012); ~3-40° cumulative misorientation per grain (Kovaleva et al.,
2014)).
3.3 Grain size analysis
Samples were then investigated under a Nikon Eclipse LV100POL polarizing microscope. Using
the Nikon NIS Elements Imaging Software, quartz grain size measurements were made on
samples Wcc 4G and W2-2. The auto-detect tool is an automatic drawing tool that identifies
grains based on a manually placed probe; manual adjustment is then used to confirm the grain
boundaries (e.g. Figure 3-2). The estimated random error of measurement is ± 2.97 µm (based on
reproducibility n=50, σ=2.97 µm).
The .xls reports generated by NIS Elements measure features including area, grain size,
minimum feret length, and maximum feret length. Grain size was measured as the equivalent
diameter (Eqdia) of a circle with the same area (Figure 3-3). Elongation was calculated as the
ratio between maximum and minimum feret length.