A Study of Antenna Elements Configuration and User’s Hand Effects
on a Four-Element Dual-band Sub-6 GHz MIMO Antenna
Ahmed M. Elshirkasi1, Azremi Abdullah Al-Hadi1, *, Mohd F. Mansor2, Ping Jack Soh1, and Rizwan Khan1
Abstract—This paper evaluates the performance of different configurations of MIMO antenna operating in the 5G band with the effect of user’s hand in data mode and suggests an optimized configuration to mitigate hand effects. A dual-band four-element MIMO antenna is used. All antenna elements (AEs) are identical planar inverted-F antenna (PIFAs) with a lower frequency band (LB) from 3.3 to 3.8 GHz and an upper frequency band (UB) from 5.2 to 6 GHz. In addition, four different configurations to place the AEs on the chassis are selected including worst and optimized configurations as well two intermediate cases. Results show that similar values of ECC are produced for both cases without and with user hand. These values are less than 0.20 on most frequency range, except the worst case configuration which has some high ECC values close to unity. Unlike ECC, TE is severely affected by user’s hand as well as by the different configuration. TE of each AE under hand effect is degraded differently according to the thickness of hand tissue that covers it. TE in the optimized configuration without user’s hand ranges between 50 and 95% in both frequency bands. However, this range deteriorates when user’s hand effect is considered, between 40% and 15% in LB, and from 35% to 41% in the UB. Multiplexing efficiency analysis reveals that MIMO performance is mainly determined by TE, and the impact of the low ECC is insignificant. This indicates that improving the performance depends on improving the TE of AEs and optimizing their positions on the chassis to reduce interaction with user’s hand. Moreover, the loss in ergodic capacity due to user’s hand compared with free space is increased from 5 to 40% in the LB, and it is more stable in the UB and ranging between 12 and 17%.
1. INTRODUCTION
Deploying multiple antennas on both sides of a wireless link is one of the key technologies used in modern wireless communication systems to achieve high performance in terms of data rate, link reliability, and interference suppression [1–3]. However, the performance of multiple-input-multiple-output (MIMO) antennas depends on the propagation environment as well as the design of antenna elements (AEs) and their positions on the chassis [4, 5]. AEs of MIMO antenna should be low correlated and highly efficient; therefore, optimizing MIMO AEs in terms of design and location on the chassis is an essential issue to improve performance [6, 7]. Moreover, the performance of MIMO antennas of mobile terminal is limited by the effect of user’s body (hands and head) when the device is used in data or talk modes [8]. The body tissues absorb radiated power and change the radiation pattern of antenna elements, besides potentially shifting their resonant frequencies and bandwidths [9]. The effects of user body on MIMO antennas have been investigated for different MIMO designs, frequency bands, and evaluation metrics, for example [10–14].
Received 6 May 2019, Accepted 11 July 2019, Scheduled 19 August 2019
* Corresponding author: Azremi Abdullah Al-Hadi ([email protected]).
1 Advanced Communication Engineering (ACE) Center of Excellence, School of Computer and Communication Engineering,
Universiti Malaysia Perlis, Kangar, Perlis 01000, Malaysia. 2 Centre of Advanced Electronic and Communication Engineering,
This work investigates the performance of a four-element MIMO antenna under different AE configurations on the chassis with user’s hand effect in data mode. The MIMO antenna is investigated in two frequency bands, as follows. First is in the Lower band (LB) from 3.3 to 3.8 GHz, which contains LTE bands 42 and 43 [15] and is widely investigated for use for 5G MIMO applications [16, 17]. Second is the upper frequency band (UB) ranging from 5 to 6 GHz, which is another potential band for 5G [18]. A standard hand phantom model in data mode is used in this investigation, and its dimensions and properties are specified by the cellular telecommunication and internet association (CTIA) [19]. However, some researchers showed that the performance of MIMO antenna under user’s hand effect widely differed from user to user according to their weights and heights. In [20], an experimental study was performed including three commercial devices namely laptop, tablet, and smart phone on frequency range from 0.3 to 3 GHz. This study involved four volunteers using the devices in different modes. In [21], user’s effect on ten-port mobile terminal operating at 28 GHz was investigated using 12 volunteers. Results in both works showed that absorption varied considerably between users. Optimizing the spacing between AEs aimed at achieving maximum capacity in MIMO systems has been proposed in [22] and [23] by applying genetic and hybrid genetic-Taguchi algorithms, respectively, considering the spatial correlation and mutual coupling between AEs. In addition to that, the work in [24] has also proposed a Galaxy-based search algorithm to optimize the spacing between AEs and maximize MIMO capacity. However, these optimization algorithms have been applied in free space without considering the effects of user’s body.
The performance of the MIMO antenna in this paper under different configurations and in the vicinity of user’s hand is evaluated in terms of the envelope correlation coefficient (ECC) metric. In addition, the performance of the AEs separately is quantified by the total efficiency (TE) of each AE which is an equivalent indicator to the mean effective gain (MEG) since TE is theoretically twice the MEG in a uniform environment [25]. ECC and TE are used to construct the channel matrix and to study the capacity performance in terms of multiplexing efficiency, ergodic capacity and water-filling capacity.
The organization of this paper is as follows. The next section presents the design of AEs and their different configurations on the chassis. Section 3 presents the results of the ECC and TE, followed by the capacity performance analysis in Section 4. Finally, Section 5 concludes the work.
2. ANTENNA DESIGN AND CONFIGURATIONS
The investigated MIMO antenna in this paper is based on the design in [26]. It consists of four symmetrical metallic planar inverted-F antenna (PIFA) elements. PIFA type is simple to design, easy to fabricate, and has good bandwidth and can be designed in a compact space which make it attractive for 5G handset [27]. The antenna elements are designed and simulated using CST Microwave Studio. Each PIFA has a total volume of 18.5×8.5×4 mm3 and designed on a Rogers RT/Duroid 5880 substrate which is 1.575 mm thick. Figure 1 shows placement of the antenna on the chassis of a mobile phone and the standard hand grip setup in data mode.
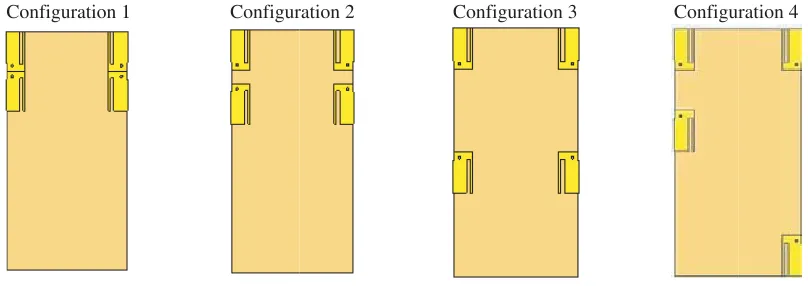
Optimizing the locations of the AEs is first performed by locating AE1 and AE2 at the two top corners of the chassis. Next, different locations for AE3 and AE4 are determined by dividing the longitudinal axis of the chassis into five intervals, each with a length of 18.5 mm prior to studying the performance of each configuration. The four configurations shown in Figure 2 are selected for further study in this work to investigate the effects of varying the longitudinal distance parameter Dshown in Figure 1 when being held in a user’s hand. Configuration 1 represents the worst case scenario when the adjacent elements are placed next to each other on the longitudinal axis (withD= 0 mm). Meanwhile, the longitudinal distanceDfor AE3 and AE4 is increased uniformly in Configurations 2 and 3. Finally, different possible values of longitudinal distance for the two (left and right) elements are selected so that the effect of user’s hand in Configuration 4 is minimized when the device is held in data mode. This avoids the thick hand tissues and accordingly maximizes the MIMO performance.
The numerical values of D (in millimeters and free space wavelength, λ) for the four different configurations are listed in Table 1. It is worth mentioning that the value of D in this table for each configuration is an averaged value from the two operating frequency bands.
(a) (b)
Figure 1. (a) Dimensions of the chassis and AEs (in mm). (b) Standard hand grip in data mode.
Configuration 1 Configuration 2 Configuration 3 Configuration 4
Figure 2. The four different configurations of the AEs on the chassis studied in this work.
frequency bands. Meanwhile, in Configuration 3, LB has D values of less than 0.5 mm, whereas these values are above 0.5 mm in the upper band (UB). Configuration 4 has two longitudinal distances optimized to reduce user’s hand effect; the long distance starts from 0.81 at 3.3 GHz and increases to reach 1.47 at 6 GHz. In contrast, the short one is less than 0.5 mm in both bands.
Figure 4 shows S-parameters of the optimal configuration in both without and with user’s hand cases. It should be mentioned here thatS11=S22=S33=S44due to similar design of ports. However, the ports interact differently with the hand, and consequently theses S-parameters are different under
Table 1. Longitudinal distance, D.
Location D (mm) Average D (perλ)
LB UB
1 0.00 0.00 0.00
2 5.90 0.07 0.11
3 36.40 0.43 0.68
4 left 17.90 0.21 0.33
Figure 3. Longitudinal distance Din terms of the free space wavelength, λ, for the four configurations in both frequency bands.
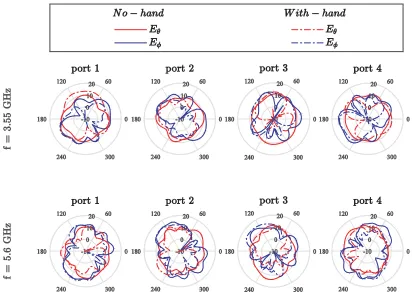
Figure 5. Radiation pattern of the optimal configuration without and with user’s hand inxy-plane at the center frequency of each band.
user’s hand effect. The radiation pattern of ports in optimal configuration is shown in Figure 5 without and with user’s hand. The figure shows the radiation pattern in xy-plane at the center frequencies of both bands, i.e., 3.55 GHz and 5.6 GHz.
3. RESULTS OF ANTENNA PARAMETERS
This section presents the results of the antenna’s MIMO parameters, namely ECC and TE. These two parameters will be used in Section 4 to build the channel matrix and to study capacity performance.
3.1. Envelope Correlation Coefficient (ECC)
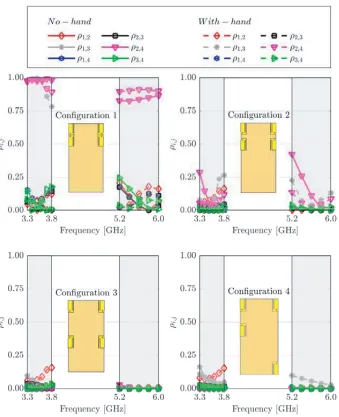
The ECC between two AEs, i and j (ρij), defines the level of correlation between the two AEs. Improved MIMO performance requires MIMO antenna with low ECC [28]. A four-element MIMO antenna has a total of six ECCs, and how the performance of ECC changes with the different AE configuration/placement and by the user’s hand is illustrated in Figure 6. In Configuration 1, a high coupling between adjacent AEs is obvious. When D is 0 mm, ρ1,3 and ρ2,4 are very high with values about 0.97 in LB and 0.83 in UB without accounting for the user’s hand. These values are almost the same under the presence of the user’s hand in both frequency bands, except that at the higher edge of LB, ρ1,3 and ρ2,4 are slightly decreased to 0.78 and 0.89, respectively. In contrast, the ECC between other AEs in the same configuration is less than 0.25 in both bands without and with the influence of the user’s hand.
Figure 6. ECC of different AE configurations without and with user’s hand.
3.2. Total Efficiency (TE)
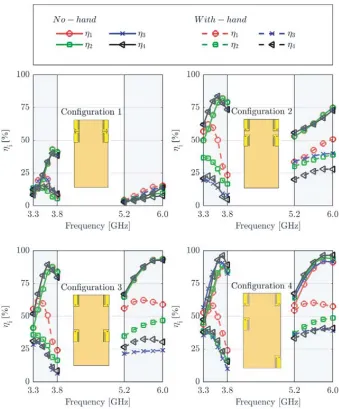
Total efficiencies of the AEs are illustrated in Figure 7. It is obvious that the TE is affected by the locations of AEs on the chassis, and this effect is compounded further by the effect of the user’s hand. Without the user’s hand, all AEs are generally similar in terms of TE within the same configuration. However, the TEs of the four AEs when being placed in the proximity of a user’s hand phantom varies depending the interaction between each AE and the thickness of the hand tissue. The thicker the hand covers a certain AE in each configuration, the more deterioration in TE is observed. Moreover, the results also show that LB is more affected by the effect of the user’s hand than in UB, except for Configuration 1. This configuration is the worst in terms of TE among all configurations. This is expected, as this is the worst case scenario investigated. TE in the LB increases linearly with frequency from 8.1% to 41.0%. However, the vicinity of the user’s hand reduces this range to be limited between 5.4% and 14.9% only. In UB of the same configuration, TEs of all AEs for both cases (without and with user’s hand) are lower than values obtained in the LB. The TE is observed to increase with frequency, with an initial TE of 3.7% at its lowest and increases to 23.1% at the upper frequency limit.
Figure 7. Total efficiency performance of different AE configurations without and with user’s hand effect.
hand, the TEs for all AEs are similar and increase linearly from 50.4% at the lowest frequency to a peak value around 83.7%. However, it is observed that the user’s hand causes severe degradation to the TE. This degradation depends on the location of the AE and the hand part that it interacts with. For instance, AEs 3 and 4 suffer from the most degradations due to blockage by thicker sections of the hand, with TE ranging from 19.0% to around 4.6%. On the contrary, TEs of AEs in the UB without users hand are initially 56.0% and increase up to 75.5%. However, it is also found that AE4 is the most affected AE by the hand, with its TE ranging from 20.1 to 27.8%. The other three AEs maintain an improved TE, with the highest value of 50.9% of AE1 at 6 GHz.
locations on the chassis can be optimized to avoid the thick hand tissues held in the data mode. The TE for this configuration is observed initially with a value of 40.3% and decreased steadily to 10.1%. Mitigation of the user’s hand effect by changing locations of AEs 3 and 4 is more obvious in the UB in Configurations 3 and 4. AE3 in Configuration 3 indicates an average TE of 23.5%, and by optimizing the location of this element, its TE is increased to 40.3% on average. Meanwhile, the average TE of AE4 is about 30.6% in the UB for Configuration 3. Optimizing the location of this AE on the chassis results in its TE increasing to 40.8%.
4. CAPACITY RESULTS
Next, the capacity performance of different configurations and how this capacity is affected by the user’s hand is studied in this section. The channel matrix model based on [29–31] is first discussed. In this model, several assumptions are made. Firstly. the same number of AEs is assumed on both sides on the link. Secondly, the transmitter side is assumed to have ideal uncorrelated AEs. Third, the receiver side uses two parameters of the studied antenna, i.e., ECC and TE, to build the receiver correlation matrixR. This matrix R is used to modify an independent and identically distributed (IID) Rayleigh channel matrix to add the effects of the designed MIMO antenna to the ideal channel matrix. Finally, the elements of the IID channel matrix are assumed to be zero mean circularly symmetric complex Gaussian (ZMCSCG) random variables with unity variance [16].
Mathematically, the channel matrix has the following structure [32]:
H=R1/2Hw (1)
where Hw is the white channel matrix whose entries are IID, and Ris the receiver correlation matrix built as follows:
R=Λ1/2RΛ¯ 1/2 (2)
whereΛ is a diagonal matrix whose nonzero entries are the TE of AEs defined as:
Λ= diag(η1, η2, ..., ηM) (3)
where ηi, i = 1,2, ..., M is the TE of the ith AE; M is the number of AEs; and ¯R is the complex correlation matrix whose diagonal entries are 1, and the (i, j)th non-diagonal element is the complex correlation coefficient between AEs iand j.
Assuming that the transmitter does not know about the channel state information (CSI) and that the transmitted power is equally divided among transmit AEs, the ergodic capacity can be calculated from the formula [33]:
c=E
log2
det
IN + ρ
MH(H)H
(4)
whereE is the averaging operator,ρthe signal to noise power ratio (SNR),M the number of AEs, and
Hthe channel matrix described in Equation (1).
4.1. Multiplexing Efficiency
Multiplexing efficiencyηmuxis a MIMO antenna performance metric defined as the signal to noise ratio SNR of the IID system (ρ0) divided by the SNR of the real system (ρT). Mathematically, these SNRs give the same ergodic capacity, as follows [32]:
ηmux= ρρ0
T ≤1 (5)
or equivalently on a dB scale:
ηmux[dB] =ρ0[dB]−ρT[dB]≤0 (6)
Multiplexing efficiency can be calculated directly according to the following definition:
Elog2
det
IN+ ρ0
MHw(Hw)H cergodic IID =E log2 det
IN+ρT
MH(H)H
cergodic design
number of realizations. This process is repeated in a for loop until the two sides of Equation (7) are equal (within a certain error range). ThenρT andρ0 are used to calculateηmuxas in Equation (5). This method gives exact results of ηmux for any ρ0. However, calculation using this method is numerically complex and costly in terms of time. Moreover, this method does not provide direct links between the MIMO antenna parameters, i.e., TE and ECC with ηmux. Another simpler calculation method with direct link to the antenna parameters can be derived for the cases of high SNR as follows [32]:
ηmux= M
M
i=1 ηi
det( ¯R) (8)
Equation (8) shows that ηmux is a function of two multiplied terms. The first is MMi=1ηi
, which
represents the geometric mean of TEs, and it captures the performance of AEs separately. The second term is Mdet( ¯R), which is related to the correlation between AEs in the form of the Mth root of
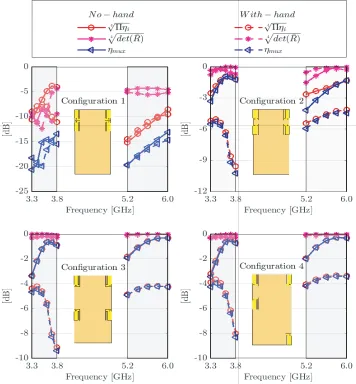
the determinant of the complex correlation matrix. This term is close to 1 (or 0 dB) when the ECC values of MIMO antenna are close to zero. Equation (8) also affirms the fact that optimizing these two terms leads to a better capacity performance. Figure 8 illustrates the performance ofηmux of different configurations without and with user’s hand. Since ηmux depends on TE and ECC, the results are presented to show the contributions of each term, as well as the total ηmux.
Configuration 1 has the lowest multiplexing efficiency performance due to its low TE and high ECC. Moreover, both TE and ECC terms contribute to the degradation ofηmux, which ranges between
−20 and−13 dB for both cases (without and with user’s hand). With the improvement in the TE and ECC in Configuration 2, ηmux becomes much higher than Configuration 1. The degradation inηmuxis mainly caused by the TE performance. Therefore, ηmux for this configuration behaves similarly with the characteristics of its TE, especially when being evaluated with the effect of the user’s hand. The performance in the LB is more degraded: without user’s hand ηmux increases from around −3.3 dB to
−1 dB. However, with user’s hand, this range degraded to between−5.5 dB and−10.3 dB. Meanwhile, in the UB, multiplexing efficiency without user’s hand is observed between −4.2 dB and−1.3 dB, whereas the effects of the hand cause further reduction inηmux to between −6.0 dB and −4.4 dB.
In Configurations 3 and 4, the degradation in ηmux is mainly contributed by the MMi=1ηi
term. This is due to the very low ECC with close-to-0 dB Mdet( ¯R) term. For Configuration 3 in LB, the multiplexing efficiency without hand increases with frequency from −3.4 dB to −0.9 dB. However, with user’s hand ηmux behaves similarly as TE and drops from 4.7 dB to−9.4 dB. On the other hand, ηmux for Configuration 4 in the LB is higher, ranging between −3.3 dB and −6.8 dB (without hand)
and from−4.2 dB to −8.1 dB (with hand effects). Meanwhile, ηmux without user’s hand in the UB of both Configurations 3 and 4 is between −1.9 dB and −0.4 dB. This is reduced when the hand effect is included to be between −4.9 dB and −4.3 dB in Configuration 3. Using optimized AE locations in Configuration 4, however,ηmux is improved by more than 1 dB.
4.2. Ergodic Capacity
Multiplexing efficiency studies the capacity performance of MIMO antenna from the perspective of SNR. On the other hand, ergodic capacity is a parameter that evaluates the MIMO link in terms of its bit rate performance (bit/s/Hz). Ergodic capacity is calculated from Equation (4) using the channel model in Equation (1) by averaging 50,000 channel realizations with an SNR of 20 dB at every frequency point. The channel model in Equation (1) depends on ECC and TE. Due to the very high ECC and low TE in Configuration 1, the ergodic capacity of this configuration is low. Most values of ergodic capacity of this configuration is less than 11.5 bit/s/Hz, which is the capacity of 2×2 IID MIMO channel with an SNR of 20 dB.
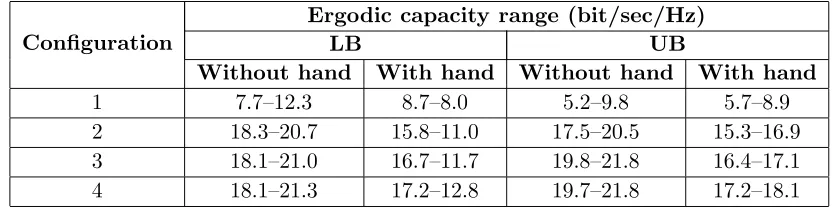
For other configurations, the relatively lower ECC and higher TE result in a higher ergodic capacity. In addition to that, the characteristic of the ergodic capacity is similar to the TE behavior as a consequence of the larger contribution from the high TE and relatively insignificant contribution from the low ECC in the channel model. The ergodic capacities of different configurations are shown in Figure 9, and the numerical values of the ergodic capacity range are summarized in Table 2.
Table 2. Ranges of ergodic capacity without and with user’s hand for different AE configurations.
Configuration
Ergodic capacity range (bit/sec/Hz)
LB UB
Without hand With hand Without hand With hand
1 7.7–12.3 8.7–8.0 5.2–9.8 5.7–8.9
2 18.3–20.7 15.8–11.0 17.5–20.5 15.3–16.9
3 18.1–21.0 16.7–11.7 19.8–21.8 16.4–17.1
Figure 9. Ergodic capacity of different AE configurations with and without user’s hand effect.
The effects of the user’s hand on the ergodic capacity can be observed more clearly in Figure 10, where the loss caused by the hand is presented as a percentage relative the capacity without hand, as follows:
Ergodic capacity loss due to user’s hand = cwithout hand−cwith hand cwithout hand ×
100 (9)
Results of capacity loss are shown in Figure 10. The negative values in Configuration 1 at several frequencies in both bands indicate that the presence of user’s hand increases the capacity at these frequencies in comparison to that without hand. However, it should be noted that the capacity of this configuration is very low without hand, as shown in Figure 9. Therefore, the lower capacity loss is a small difference between the two already very low capacity values.
Figure 10. Loss in ergodic capacity due to user’s hand for the four AE configurations.
Table 3. Ergodic capacity loss due to user’s hand for different AE configurations.
Configuration Ergodic capacity loss due to user hand (%)
LB UB
1 −13.0–34.6 −8.7–10.0
2 13.6–46.6 12.7–17.6
3 7.8–44.1 17.3–21.4
4 5.2–40.1 12.8–17.1
4.3. Water-Filling Capacity
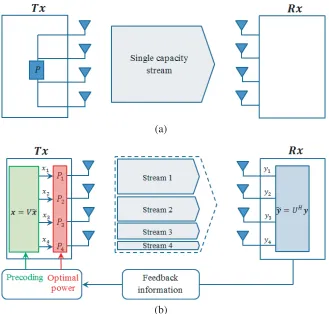
The conventional ergodic capacity in Equation (4) assumes that the channel state information (CSI) is unknown at the transmitter, thus equal power is divided between the AEs on the transmission side. In contrast, the water-filling algorithm uses the CSI received through the feedback channel to split the available channels into multiple parallel streams (eigenmodes) by precoding each transmitted symbol and assigning higher transmit power to stronger eigenmodes. This operation is performed using digital signal processing (DSP) techniques on both sides of the link. Figure 11 compares the two transmit schemes (equal and non-equal power assignment).
(a)
(b)
Figure 11. Two MIMO transmission schemes. (a) Equal transmit power allocation (one capacity stream), and (b) unequal transmit power allocation using the water-filling scheme (multiple parallel capacity streams).
can be decomposed using singular value decomposition (SVD) to three matrices, as follows [34]:
H=UΣVH (10)
where U and V are unitary matrices, i.e., UHU = I, VHV = I. The operator (·)H is the Hermitian operator, I the identity matrix, and Σ a diagonal matrix whose diagonal entries σ1, σ2, ..., σM are singular values in decreasing order. The transmitted vector of symbols ˜x is precoded by multiplying it by V, which is received through the feedback channel to produced precoded vector x. Vector x is received under the assumption of a narrowband channel as:
y=Hx+n=UΣVHx+n (11)
wherenis the noise vector whose entries are assumed uncorrelated. The received vectoryis multiplied from the left hand side byUH, and the precoded vectorx is represented back asVx˜, as follows:
UHy=UHHx+UHn
˜
y=UHUΣVHVx˜+ ˜n (12)
From the properties of unitary matrices U and V, the received symbols of vector ˜y become uncoupled as:
˜
y=Σx˜+ ˜n (13)
Each received symbol in Equation (13) is ˜yi =σix˜i+ ˜ni, whereσi is the corresponding singular value with the transmitted symbol xi.
The capacity of each measured or simulation-realized channel matrix under water-filling algorithm is given by:
c=
M
m=1 log2
1 +λ
2
mPm
σ2
where λm is the m-th eigenvalue of H(H)H, Pm the transmit power assigned to the m-th AE, σ2 the noise power, andM the number of AEs, which is assumed in this work to be the same on both sides of the link. The transmit power Pm is optimized to achieve maximum capacity under the constraint that the assigned powers do not exceed the total available powerPtot, limited as:
M
m=1
Pm =Ptot (15)
Maximizing c in Equation (14) under the constraint of Equation (15) results inPm of: Pm=
1 β −
σ2 λ2
m
+
(16)
where termβ is:
β = ⎛ ⎜ ⎜ ⎝
λ2
m
σ2 1 +λ
2
mPm
σ2 ⎞ ⎟ ⎟
⎠ (17)
and function (x)+= max(x,0).
reduces the MIMO order from four ports to two only. On the other hand, the capacities resulting from the other three configurations are contributed by the four eigenmodes, with a different contribution from each eigenmode, depending on its strength. The percentage of capacity share by each eigenmode is shown in Figure 13. It it noticed that despite a general decrease in capacity when being assessed with the user’s hand, the share of each eigenmode behaves similarly when being evaluated without the user’s hand. Specifically, the capacity share by eigenmodes 1 and 2 in Configuration 1 is about around 60% and 40%, respectively, whereas eigenmodes 3 and 4 share negligible amount of capacity (with maximum value of 5% by eigenmode 3 at 6 GHz without user’s hand). For other configurations, eigenmodes 1, 2, 3, and 4 share about 40, 30, 20, and 10%, respectively, with some fluctuations around these levels. In addition to that, curves of Configurations 2, 3, and 4 in Figure 12 also indicate that the capacity carried by these eigenmodes (especially for the first and second eigenmodes) are more stable across frequency than the total capacity especially in the LB with user’s hand effect.
5. CONCLUSION
This paper presents a detailed study on the effects of the user’s hand in data mode using different configurations of antenna elements on the performance of a dual-band four-element MIMO antenna. The antenna elements for this MIMO antennas are designed in four different configurations, which include the worst and optimized cases, besides two intermediate cases. The antenna performance is first studied in terms of envelop correlation coefficient (ECC) and total efficiency (TE), which are then used to build the correlation matrix on the receiver and consequently, the channel matrix of the link. The capacity of the link is then investigated in terms of multiplexing efficiency, ergodic capacity, and water-filling capacity. Results of the three different configurations (except for Configuration 1, representative of the worst case scenario) show that ECC values in both without and with user’s hand cases are below 0.2 throughout most of both frequency bands. However, the total efficiency of antenna elements has been severely affected by user’s hand, especially in the lower band. For the MIMO capacity, results indicate that the degradation in performance is mainly caused by TEs of AEs. The impact of the low ECC is insignificant, suggesting the importance of improving the total efficiency of the antenna elements in improving the performance of MIMO mobile terminals. This can be done by carefully locating different antenna elements strategically on the chassis to ensure the least interaction with user’s hand. In addition, water-filling capacity analysis shows that the worst case configuration has only two eigenmodes which means that it acts like a 2-port MIMO antenna due to the high correlation between adjacent AEs, but the other three configurations have 4 eigenmodes carrying the channel capacity. Moreover, these eigenmodes, especially eigenmodes 1 and 2, have more stable capacity with frequency than the total capacity. Future work will focus on studying the performance of the MIMO mobile terminal in the vicinity of user’s body using different data and call modes, prior to a proposal for a systematic design procedure for performance optimization in these modes.
REFERENCES
1. Varzakas, P., “Average channel capacity for Rayleigh fading spread spectrum MIMO systems,”Int. J. Commun. Syst., Vol. 19, No. 10, 1081–1087, 2006.
2. Ast´ely, D., E. Dahlman, A. Furusk¨ar, Y. Jading, M. Lindstr¨om, and S. Parkvall, “LTE: The evolution of mobile broadband,”IEEE Commun. Mag., Vol. 47, No. 4, 44–51, 2009.
3. Fan, W., X. Carre˜no, P. Ky¨osti, and J. Ø. Nielsen, “Over-the-air testing of MIMO-capable terminals,” IEEE Vehicular Technology Magazine, Vol. 10, No. 2, 38–46, June 2015.
4. Yanakiev, B., J. Ø. Nielsen, M. Christensen, and G. F. Pedersen, “On small terminal antenna correlation and impact on MIMO channel capacity,” IEEE Trans. Antennas Propag., Vol. 60, No. 2, 689–699, 2012.
5. Gesbert, D., M. Shafi, D. Shiu, P. J. Smith, and A. Naguib, “From theory to practice: An overview of MIMO space-time coded wireless systems,” IEEE J. Sel. Areas Commun., Vol. 21, No. 3, 281– 302, 2003.
6. Song, H. J., et al., “Evaluation of vehicle-level MIMO antennas: Capacity, total embedded efficiency, and envelope correlation,” 2014 IEEE-APS Topical Conference on Antennas and Propagation in Wireless Communications (APWC), 89–92, 2014.
7. Nielsen, J. Ø., B. Yanakiev, S. C. Del Barrio, and G. F. Pedersen, “Channel models for capacity evaluation of MIMO handsets in data mode,”IET Microwaves, Antennas Propag., Vol. 11, No. 1, 1–9, 2017.
8. Harrysson, F., A. Derneryd, and F. Tufvesson, “Evaluation of user hand and body impact on multiple antenna handset performance,” 2010 IEEE Antennas and Propagation Society International Symposium (APSURSI), 1–4, 2010.
European Conference on Antennas and Propagation (EuCAP), IEEE, 2016.
12. Helander, J., K. Zhao, Z. Ying, and D. Sj¨oberg, “Performance analysis of millimeter-wave phased array antennas in cellular handsets,”IEEE Antennas Wirel. Propag. Lett., Vol. 15, 504–507, 2016. 13. Zhao, K., J. Helander, D. Sj¨oberg, S. He, T. Bolin, and Z. Ying, “User body effect on phased array in user equipment for the 5G mmWave communication system,” IEEE Antennas Wirel. Propag. Lett., Vol. 16, 864–867, 2017.
14. Zhang, S., X. Chen, I. Syrytsin, and G. F. Pedersen, “A planar switchable 3-D-coverage phased array antenna and its user effects for 28-GHz mobile terminal applications,”IEEE Trans. Antennas Propag., Vol. 65, No. 12, 6413–6421, 2017.
15. Li, Y. and G. Yang, “Dual-mode and triple-band 10-antenna handset array and its multiple-input multiple-output performance evaluation in 5G,”Int. J. RF Microw. Comput. Eng., Vol. 29, No. 2, e21538, 2019.
16. Li, Y., Y. Luo, and G. Yang, “12-port 5G massive MIMO antenna array in sub-6 GHz mobile handset for LTE bands 42/43/46 applications,”IEEE Access, Vol. 6, 344–354, 2018.
17. Rohani, B., K. Takahashi, H. Arai, Y. Kimura, and T. Ihara, “Improving channel capacity in indoor 4×4 MIMO base station utilizing small bidirectional antenna,” IEEE Trans. Antennas Propag., Vol. 66, No. 1, 393–400, 2018.
18. Di Paola, C., I. Syrytsin, S. Zhang, and G. F. Pedersen, “Investigation of user effects on mobile phased antenna array from 5 to 6 GHz,” 2018 IEEE 12th European Conference on Antennas and Propagation (EuCAP), 5 pages, April 2018.
19. Ying, Z., “Antennas in cellular phones for mobile communications,” Proc. IEEE, Vol. 100, No. 7, 2286–2296, 2012.
20. Andersen, J. B., L. Fellow, J. Ø. Nielsen, and G. F. Pedersen, “Absorption related to hand-held devices in data mode,”IEEE Trans. Electromagn. Compat., Vol. 58, No. 1, 47–53, 2016.
21. Syrytsin, I., S. Zhang, G. Pedersen, K. Zhao, T. Bolin, and Z. Ying, “Statistical investigation of the user effects on mobile terminal antennas for 5G applications,” IEEE Trans. Antennas Propag., Vol. 65, No. 12, 6596–6605, 2017.
22. Recioui, A. and H. Bentarzi, “Genetic algorithm based MIMO capacity enhancement in spatially correlated channels including mutual coupling,” Wirel. Pers. Commun., Vol. 63, No. 3, 689–701, 2012.
23. Recioui, A. and H. Bentarzi, “Capacity optimization of MIMO wireless communication systems using a hybrid genetic-taguchi algorithm,”Wirel. Pers. Commun., Vol. 71, No. 2, 1003–1019, 2013. 24. Recioui, A., “Application of a galaxy-based search algorithm to MIMO system capacity
optimization,” Arab. J. Sci. Eng., Vol. 41, No. 9, 3407–3414, 2016.
25. Zhao, K., “Mobile antenna systems for 4G and 5G applications with user body interaction,” KTH Royal Institute of Technology, 2017.
26. Khan, R., A. Abdullah Al-Hadi, P. J. Soh, M. T. Ali, S. S. Al-Bawri, and Owais, “Design and optimization of a dual-band sub-6 GHz four port mobile terminal antenna performance in the vicinity of user’s hand,” Progress In Electromagnetics Research C, Vol. 85, 141–153, 2018.
27. Haraz, O. M., M. Ashraf, and S. Alshebeili, “Single-band PIFA MIMO antenna system design for future 5G wireless communication applications,” 2015 IEEE 11th International Conference on Wireless and Mobile Computing, Networking and Communications (WiMob), 608–612, 2015. 28. Moradi Kordalivand, A., T. A. Rahman, and M. Khalily, “Common elements wideband MIMO
29. Tian, R., B. K. Lau, and Z. Ying, “Multiplexing efficiency of MIMO antennas with user effects,”
2012 IEEE Antennas and Propagation Society International Symposium (APSURSI), 1–2, 2012. 30. Tian, R., B. K. Lau, and Z. Ying, “Multiplexing efficiency of MIMO antennas in arbitrary
propagation scenarios,” 2012 6th European Conference on Antennas and Propagation (EUCAP), 373–377, 2012.
31. Zhao, K., E. Bengtsson, Z. Ying, and S. He, “Multiplexing efficiency of high order MIMO in mobile terminal in different propagation scenarios,” 2016 10th European Conference on Antennas and Propagation (EuCAP), 1–4, 2016.
32. Tian, R., B. K. Lau, and Z. Ying, “Multiplexing efficiency of MIMO antennas,” IEEE Antennas Wirel. Propag. Lett., Vol. 10, 183–186, 2011.
33. Goldsmith, A.,Wireless Communications, Cambridge University Press, 2005.