OncoTargets and Therapy 2018:11 4701–4709
OncoTargets and Therapy
Dove
press
submit your manuscript | www.dovepress.com 4701
O r i g i n a l r e s e a r c h
open access to scientific and medical research
Open access Full Text article
characterization of microrna expression in
primary human colon adenocarcinoma cells
(sW480) and their lymph node metastatic
derivatives (sW620)
Wei Yan Wenchao Yang Zhongcai liu guoyang Wu
Department of general surgery, Zhongshan hospital, Xiamen University, Xiamen, Fujian 361004, People’s republic of china
Background and objective: Metastasis is the major cause of cancer-related deaths in patients with colon cancer, however, the exact molecular mechanism is unclear. MicroRNAs (miRNAs) play an important role in the pathogenesis and progression of cancer. Therefore, in this study, we aimed to identify differentially expressed miRNAs in two colon carcinoma cell lines: SW480, derived from primary colon carcinoma and SW620, derived from lymph node metastasis, which were obtained from the same patient.
Materials and methods: Three independent samples of cancer cells were collected from SW480 and SW620 cells, respectively. An miRNA microarray platform, miRCURY LNA™ microRNA array with 1,223 probes containing 3,000 capture probes, was used to determine the miRNA expression profiles of these two cell lines. Differentially expressed miRNAs were validated by quantitative reverse transcription-polymerase chain reaction (qRT-PCR).
Results: The raw data were submitted to the Gene Expression Omnibus database (GSE72412). Thirteen miRNAs were differentially expressed between SW480 and SW620 cells, of which, seven miRNAs (920, 636, 766-3p, 545-5p, hsa-miR-195-3p, hsa-miR-125a-3p, and hsa-miR-196b-3p) were found to be upregulated and six miRNAs (hsa-miR-3613-3p, hsa-miR-29b-3p, hsa-miR-1297, hsa-miR-141-5p, hsa-miR-200c-3p, and hsa-miR-141-3p) were found to be downregulated. Target analysis of the predicted miRNAs showed that these genes were primarily involved in protein binding, cell adhesion, and cancer metastasis. Furthermore, qRT-PCR validated the results of miRNA microarray.
Conclusion: This is the first systematic analysis of the differences of miRNAs between SW480 and SW620 cells. The results provide useful information to explore potential biomarkers of miRNAs for predicting colon cancer metastasis.
Keywords: microRNA, colon cancer, metastasis, microarray
Introduction
Colon cancer is one of the most common types of cancers and metastasis is the leading cause of death in patients with colon cancer.1 However, the molecular
mechanism involved in the metastasis is not yet clear. Many studies demonstrate that microRNAs (miRNAs) play an important role in the pathogenesis and pro-gression of cancer.2 miRNAs are small noncoding RNAs that suppress target gene
expression at the posttranscriptional level by binding to the 3′-untranslated region of the target mRNA.3 Although miRNAs have been found to promote or suppress
tumor metastasis, the exact role of miRNAs in colon cancer metastasis remains to
correspondence: guoyang Wu Department of general surgery, Zhongshan hospital, Xiamen University, hubin south road 201-209, siming District, Xiamen 361004, Fujian, People’s republic of china email w13400677116@aliyun.com
Journal name: OncoTargets and Therapy Article Designation: Original Research Year: 2018
Volume: 11
Running head verso: Yan et al
Running head recto: Differential expression of miRNA in colon cancer cell lines DOI: 169233
OncoTargets and Therapy downloaded from https://www.dovepress.com/ by 118.70.13.36 on 25-Aug-2020
For personal use only.
Dovepress Yan et al
be uncovered. Functional studies indicate that miRNAs have important functions in tumor progression, especially recurrence, drug resistance, and metastasis.4 Majority of the
researchers have provided strong evidence that miRNAs play an important role during tumorigenesis and tumor progression.5–8
With this background that the miRNAs are involved in tumor development and progression, in this study, we hypothesized that miRNAs also play a key role in colon cancer metastasis. The metastatic potential of SW620 cells, derived from lymph node metastasis, is known to be higher than that of SW480 cells, derived from primary colon cancer tissues of the same patient, which have been used as model cell lines for analyzing the metastatic ability.9,10 Therefore,
we hypothesized that the genes expressed, such as miRNAs, which differ between SW480 and SW620 cells, could be related to tumor metastasis. Until now, there are no system-atic reports with respect to the miRNA expression profile of the two recognized cell lines with distinct metastatic capacity. In this study, we profiled the miRNAs of the SW620 and SW480 colon cancer cell lines.
Materials and methods
cell culture
The human colon cancer cell lines SW480 and SW620 were purchased from the American Tissue Culture Collec-tion (Manassas, VA, USA) and were routinely maintained in RPMI-1640 medium (HyClone, Logan, UT, USA) supplemented with 10% fetal bovine serum (Thermo Fisher Scientific, Waltham, MA, USA), 100 U/mL penicillin sodium and 100 mg/mL streptomycin sulfate at 37°C in a humidi-fied air atmosphere containing 5% CO2. Cells were used in logarithmic growth phase.
rna extraction
Total RNA was isolated using TRIzol (Thermo Fisher Scientific) and purified with RNeasy mini kit (Qiagen) according to manufacturer’s instructions. RNA quality and quantity were measured by using NanoDrop spectrophotom-eter (ND-1000; NanoDrop Technologies, Thermo Fisher Scientific, Waltham, MA, USA) and RNA integrity was determined by gel electrophoresis.
labeling of mirna and array
hybridization
RNA labeling and array hybridization were performed according to Exiqon’s manual. First, after quality control, the miRCURY LNA™ Hy3™/Hy5™ Power labeling kit
(Exiqon, Vedbaek, Denmark) was used according to the manufacturer’s guideline for miRNA labeling by following steps: 1) 1 µL RNA in 2.0 µL of water was combined with 1.0 µL of calf intestinal alkaline phosphatase (CIAP) buffer and CIAP (Exiqon). The mixture was incubated for 30 min at 37°C; 2) the reaction was terminated by incubation for 5 min at 95°C. Then, 3.0 µL of labeling buffer, 1.5 µL of fluorescent label (Hy3™), 2.0 µL of dimethyl sulfoxide, and 2.0 µL of labeling enzyme were added into the mixture. The labeling reaction was incubated for 1 h at 16°C; and 3) the labeling reaction was terminated by incubation for 15 min at 65°C. Then, the Hy3™-labeled samples were hybridized on the miRCURY LNA™ microRNA Array (v.18.0) (Exiqon) according to the array manual steps as follows: 1) the total 25 µL mixture from Hy3™-labeled samples with 25 µL hybridization buffer was first denatured for 2 min at 95°C and then incubated on ice for 2 min; 2) then, hybridized on the microarray for 16–20 h at 56°C in a 12-Bay Hybridiza-tion Systems (HybridizaHybridiza-tion System – Nimblegen Systems, Inc., Madison, WI, USA); and 3) following hybridization, the slides were prepared and washed several times using wash buffer kit (Exiqon). Eventually, the slides were scanned using the Axon GenePix 4000B microarray scanner (Axon Instruments, Foster City, CA, USA).
Data analysis
The raw data were submitted to the Gene Expression Omni-bus database (GSE72412) (http://www.ncbi.nlm.nih.gov/ geo/). The scanned images were then imported into GenePix Pro 6.0 software (Axon Instruments) for grid alignment and data extraction. The replicated miRNAs were averaged and those with intensities $30 in all samples were chosen to calculate the normalization factor. The data expressed were normalized using the median normalization. After normaliza-tion, significant differentially expressed miRNAs between the two groups were identified using fold change and p-value. Differentially expressed miRNAs between the two samples were filtered through fold change. Finally, hierarchical clustering was performed to show distinguishable miRNA expression profiling among samples.
Quantitative reverse
transcription-polymerase chain reaction (qrT-Pcr)
Cells of human colon cancer cell lines SW480 and SW620 in the logarithmic growth period were collected. Following the isolation of total RNA, cDNA were synthesized using a miDETECT A Track™ miRNA qRT-PCR Starter kit (RIOBIO Biotechnology Co., Ltd., Guangzhou, People’sOncoTargets and Therapy downloaded from https://www.dovepress.com/ by 118.70.13.36 on 25-Aug-2020
Dovepress Differential expression of mirna in colon cancer cell lines
Republic of China). All the miRNAs’ primers (miDETECT A Track™ miRNA qPCR Primer Set), including hsa-miR-920, hsa-miR-636, hsa-miR-766-3p, hsa-miR-545-5p, hsa-miR-195-3p, hsa-miR-125a-3p, hsa-miR-196b-3p, miR-3613-3p, miR-29b-3p, miR-1297, hsa-miR-141-5p, hsa-miR-200c-3p, and hsa-miR-141-3p, and control primer (miDETECT A Track™ U6 qPCR Primer Set) were also purchased. We performed qRT-PCR on an ABI 7500 real-time PCR system (Thermo Fisher Scientific) according to the manufacturer’s protocol by miDETECT A Track™ miRNA qRT-PCR Kit (RIOBIO Biotechnology Co., Ltd.). Dissociation curve analysis was used to verify the generation of a single product. U6 was used as a reference gene, and all reactions were repeated three times. Data were analyzed using the ABI 7500 Prism sequence detection software (Thermo Fisher Scientific) and the relative expression was calculated using the 2-ΔΔCq method.
statistical analysis
Statistical analysis was performed using SPSS statistical software (version 17.0; SPSS, Inc., Chicago, IL, USA). The significant difference between the two groups was analyzed by one-way analysis of variance using paired t-test. Data are
expressed as mean±standard deviation. A p-value ,0.05 was considered as a significant difference.
Results
miRNA expression profiles between
sW620 and sW480 cells
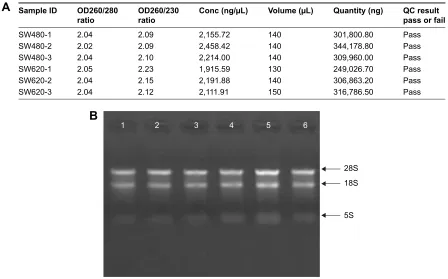
To identify the difference in miRNA expression between SW620 and SW480 cells, we used the miRNA microarray platform, miRCURY LNA™ microRNA Array with 1,223 probes containing 3,000 capture probes, and screened differentially expressed miRNAs. First, three independent cell samples were collected from SW480 and SW620 cells, respectively. Total RNA were extracted from the total six samples (SW480-1, SW480-2, SW480-3, SW620-1, SW620-2, and SW620-3). For spectrophotometer, the ratio of optical density (OD) (A260/A280) should be close to 2.0 for pure RNA (ratios between 1.8 and 2.1 are acceptable). The OD A260/A230 ratio should be more than 1.8. We vali-dated the RNA quantification and assure the quality of RNA (Figure 1). Furthermore, we obtained a good quality control chip distribution after chip hybridization: 1) The probe dis-tribution of each chip between six total RNAs of samples is not consistent before standardization, and the median of each chip is at the same level and the distribution of the probe is
4&UHVXOW SDVVRUIDLO 4XDQWLW\QJ
9ROXPH/ &RQFQJ/
2' UDWLR 2'
UDWLR 6DPSOH,'
3DVV
6:
3DVV
6:
3DVV
6:
3DVV
6:
3DVV
6:
3DVV
6:
6
6
6
%
$
Figure 1 rna quality control in total six cell samples. (A) RNA quantification and quality assurance by NanoDrop ND-1000. (B) rna integrity and gDna contamination test by denaturing agarose gel electrophoresis. lanes 1, 2, 3, 4, 5, and 6: total rna of samples sW480-1, sW480-2, sW480-3, sW620-1, sW620-2, and sW620-3.
Abbreviation: OD, optical density.
OncoTargets and Therapy downloaded from https://www.dovepress.com/ by 118.70.13.36 on 25-Aug-2020
Dovepress Yan et al
6: 6: 6: 6: 6: 6:
/RJ
UDWLR
%HIRUHQRUPDOL]DWLRQ
±
6: 6: 6: 6: 6: 6:
/RJ
UDWLR
$IWHUQRUPDOL]DWLRQ
Figure 2 The distribution of the probe on the chip between six total rnas of samples sW480-1, sW480-2, sW480-3, sW620-1, sW620-2, and sW620-3. The box plot reflects the distribution of the probe on the chip, which can be used to compare the effect of the probe before and after the standardization. The probe distribution of each chip is not consistent before standardization, and the median of each chip is at the same level and the distribution of the probe is close after the middle value standardization.
H
H
H
H±
H± H H H
6:
6:
H± H±
H
H
H
H±
H± H H H
6:
6:
H± H±
H
H
H
H±
H± H H H
6:
6:
H± H±
H
H
H
H±
H± H H H
6:
6:
H± H±
H
H
H
H±
H± H H H
6:
6:
H± H±
H
H
H
H±
H± H H H
6:
6:
H± H±
H
H
H
H±
H± H H H
6:
6:
H± H±
Figure 3 The distribution of the probe on the chip (scatter plot) between six total rnas of samples sW480-1, sW480-2, sW480-3, sW620-1, sW620-2, and sW620-3. The scatter plot reflects the repeatability between the chips or the groups. The better the repeatability is, the closer the diagonal line is.
OncoTargets and Therapy downloaded from https://www.dovepress.com/ by 118.70.13.36 on 25-Aug-2020
Dovepress Differential expression of mirna in colon cancer cell lines
Table 1 Pearson correlation coefficient to measure repeatability between six total rnas of samples sW480-1, sW480-2, sW480-3, sW620-1, sW620-2, and sW620-3
Correlation coefficient matrix
sW480-1 sW480-2 sW480-3
sW480-1 1 0.9764724 0.9510951
sW480-2 0.9764724 1 0.974108
sW480-3 0.9510951 0.974108 1
sW620-1 sW620-2 sW620-3
sW620-1 1 0.933746 0.8112635
sW620-2 0.933746 1 0.8383431
sW620-3 0.8112635 0.8383431 1
sW480 sW620
sW480 1 0.9546237
sW620 0.9546237 1
Notes: The closer to 1 the correlation coefficient is, the better the repeatability is.
close after the middle value standardization (Figure 2 ); 2) The scatter plot reflects the repeatability between the chips or the groups. The better the repeatability is, the closer the diagonal line is (Figure 3); 3) The closer to 1 the correlation coefficient is, the better the repeatability is (Table 1). Eventually, we found that 13 differentially expressed miRNAs (including seven upregulated [920, 636, hsa-miR-766-3p, hsa-miR-545-5p, hsa-miR-195-3p, hsa-miR-125a-3p,
9ROFDQRSORW6:YV6:
± ±
/RJIROGFKDQJH
±/RJ
S
YDOXH
9DOXH &RORUNH\DQG
KLVWRJUDP
±
&RXQW
KVDPL5S KVDPL5FS KVDPL5ES KVDPL5S KVDPL5S KVDPL5 KVDPL5ES KVDPL5S KVDPL5 KVDPL5 KVDPL5S KVDPL5DS KVDPL5S
6:B6: 6:B6: 6:B6: 6:B6: 6:B6: 6:B6:
$
%
Figure 4 Significantly differentially expressed miRNAs in SW620 cells compared with SW480 cells. (A) Volcano plot: 13 red points represent the 13 significantly differentially expressed mirnas according to fold change .1.5 and p,0.05. (B) Heatmap and hierarchical clustering of 13 significantly differentially expressed miRNAs.
Abbreviation: mirna, microrna.
and hsa-196b-3p] and six downregulated known miR-NAs [hsa-miR-3613-3p, hsa-miR-29b-3p, hsa-miR-1297, hsa-miR-141-5p, hsa-miR-200c-3p, and hsa-miR-141-3p], respectively) in the SW620 cells in contrast to the SW480 cells. Figure 4 and Table 2 summarize the 13 miRNAs that show the significant differences.
Validation of differentially expressed
mirnas
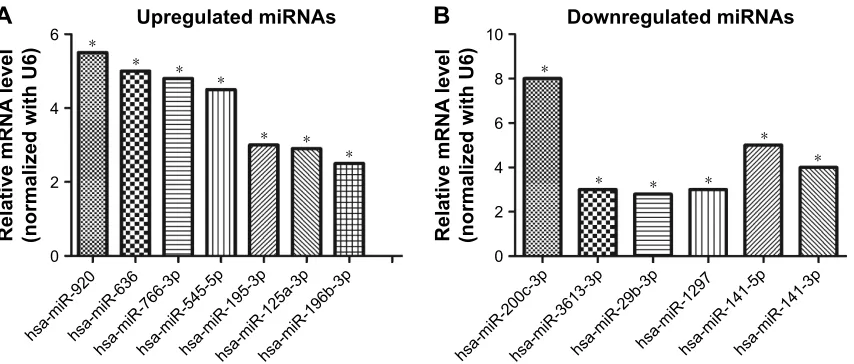
miRNA-specific qRT-PCR was performed to validate the differentially expressed miRNAs. The expression levels of hsa-miR-920, hsa-miR-636, hsa-miR-766-3p, hsa-miR-545-5p, hsa-miR-195-3p, hsa-miR-125a-3p, and hsa-miR-196b-3p were found to be significantly upregulated in SW620 (Figure 5A), whereas those of hsa-miR-3613-3p, 29b-3p, 1297, 141-5p, hsa-miR-200c-3p, and hsa-miR-141-3p were found to be downregu-lated (Figure 5B). These results agree with the results of the miRNA microarray analysis.
analysis of the predicted target genes of
differentially expressed mirnas
To investigate the potential function of predicted target genes, we analyzed the differentially expressed miRNAs by searching previously published studies regarding the particular genes’
OncoTargets and Therapy downloaded from https://www.dovepress.com/ by 118.70.13.36 on 25-Aug-2020
Dovepress Yan et al
Table 2 The list of differentially expressed mirnas between sW620 cells and sW480 cells
miRNAs Fold change Type of regulation p-value
hsa-mir-920 1.930594 Up 0.039586
hsa-mir-636 1.53241 Up 0.027953
hsa-mir-766-3p 1.939967 Up 0.014147
hsa-mir-545-5p 1.587454 Up 0.025508
hsa-mir-195-3p 1.62515 Up 0.037874
hsa-mir-125a-3p 1.605793 Up 0.004376
hsa-mir-196b-3p 1.686959 Up 0.006909
hsa-mir-3613-3p 1.663110 Down 0.039586
hsa-mir-29b-3p 2.066123 Down 0.001667
hsa-mir-1297 1.550251 Down 0.022966
hsa-mir-141-5p 1.796777 Down 0.030168
hsa-mir-200c-3p 1.695634 Down 0.047333
hsa-mir-141-3p 2.133825 Down 0.010694
Notes:p,0.05, fold change .1.5.
Abbreviation: mirna, microrna.
8SUHJXODWHGPL51$V
5HODWLYHP51$
OHYHO
QRUPDOL]HGZLWK8
KVDPL5KVDPL5
KVDPL5SKVDPL5SKVDPL5SKVDPL5DSKVDPL5ES
'RZQUHJXODWHGPL51$V
5HODWLYHP51$
OHYHO
QRUPDOL]HGZLWK8
KVDPL5FSKVDPL5SKVDPL5ESKVDPL5KVDPL5SKVDPL5S
$
%
Figure 5 Validation of mirna microarray results by qrT-Pcr. (A) seven upregulated mirnas in sW620 cells compared with sW480 cells. (B) six downregulated mirnas in sW620 cells in contrast to sW480 cells. U6 was used as a normalization control. Data represent the mean±standard deviation of three biological replicates. *p,0.05.
Abbreviations: mirna, microrna; qrT-Pcr, quantitative reverse transcription-polymerase chain reaction.
functions. We could predict tumor-associated gene targets of the significantly differentially expressed 13 miRNAs. Analysis of predicted miRNAs’ targets showed that these genes were primarily involved in protein binding, cell adhesion, and cancer metastasis. Tables 3 and 4 summarize the results.
Discussion
In this study, we used SW480 and SW620 cell lines that have different metastatic capabilities (Table 5) and we hypothesized that miRNAs that differ between SW480 and SW620 cells could be related to the formation of cancer metastasis. There-fore, we investigated the miRNA expression profiling between SW480 and SW620 cells using an miRCURY LNA™ miRNA array platform and identified some differentially expressed miRNAs between them. According to our results, seven
miRNAs were found to be upregulated and six were found to be downregulated in SW620 cells in contrast to SW480 cells, whose functions are known to be closely associated with tumor metastasis. Thirteen differentially expressed miRNAs (including seven upregulated [hsa-miR-920, hsa-miR-636, 766-3p, 545-5p, 195-3p, hsa-miR-125a-3p, and hsa-miR-196b-3p] and six downregulated known miRNAs [hsa-miR-3613-3p, hsa-miR-29b-3p, hsa-miR-1297, hsa-miR-141-5p, hsa-miR-200c-3p, and hsa-miR-141-3p], respectively) were identified and qRT-PCR was performed to validate the array results. Furthermore, we analyzed our results on the miRNAs with target genes and found that many target genes are related to tumor progression and metastasis in previously published peer-reviewed literature.
Chen et al found that the risk allele for rs16405 dis-rupted a binding site for human miR-920 which would negatively regulate beta-transducin repeat-containing protein (betaTrCP) and proposed an miR-920-mediated betaTrCP regulation model depending on rs16405 genotype, which may influence the risk of hepatocellular carcinoma (HCC). The molecular mechanism was, at least in part, found to be hsa-miR-920-mediated regulation, which is possibly involved in the pathogenesis of HCC.11 Jang et al revealed
that miR-636 might function as a tumor suppressor miRNA affecting HCC tumorigenesis via downregulation of Ras, and that ANT2 suppression by shRNA could exert an anticancer effect by restoring the expression of miR-636 in HCC.12 Some
studies demonstrate that targeting DNMT3B by miR-766 and other miRNAs, decreased methylation of tumor sup-pressor genes, such as SFRP1, SFRP2, WIF1, and DKK2, and returned the expression of these tumor suppressor genes
OncoTargets and Therapy downloaded from https://www.dovepress.com/ by 118.70.13.36 on 25-Aug-2020
Dovepress Differential expression of mirna in colon cancer cell lines
Table 3 Putative target genes of the seven upregulated mirnas
miRNAs Target gene Molecular function
hsa-mir-920 betaTrcP involved in cancer pathogenesis
hsa-mir-636 ras, anT2 Tumorigenesis
hsa-mir-766-3p sF2, DnMT3B, sirT6 cancer progression
hsa-mir-545-5p rig-i, cyclin D1a, cDK4 cell proliferation, invasion
hsa-mir-195-3p PVT1, notch, FgF-18, sMaD7, Tlr2, YaP1, gaBaraPl1
cell proliferation, migration, and invasion and apoptosis, angiogenesis and autophagy, cell colony formation abilities, remodeling of the extracellular matrix, and inflammatory pathway mediators hsa-mir-125a-3p ThP-1, nF1, Bcl-2, foxp3, e2F2, erralpha cell differentiation and apoptosis and cancer progression
hsa-mir-196b-3p p65, Meis2, and PPP3cc Tumor development and drug resistance
Abbreviation: mirna, microrna.
Table 4 Putative target genes of the six downregulated mirnas
miRNAs Target gene Molecular function
hsa-mir-3613-3p McPiP1, cTl1, slc44a1 cell proliferation
hsa-mir-29b-3p sirT1, Mcl-1, DnMT3B, cDc42,
TeT1, akt3, VegF, c-Myc
regulates oxidative stress, cell transformation, eMT, metastasis, cell migration and invasion, and angiogenesis/tumorigenesis
hsa-mir-1297 hMga2, eZh2, cox-2, TriB2,
c/eBPalpha, PTen
associated with metastasis of cancer, cell proliferation, invasion, and apoptosis
hsa-mir-141-5p FUs, eWs, BMi1, hOTair Tumor growth and metastasis, cell proliferation and migration hsa-mir-200c-3p c-Myc, Msn, MaD2l1, KiM-1,
BMi1, ZeB1-as1, lUcaT1, Foxf2
cellular proliferation, migration, and invasiveness, regulates cancer progression, eMT, and drug resistance
hsa-mir-141-3p sKa2, gaB1, ZeB2, hgFr Tumor growth and metastasis
Abbreviations: mirna, microrna; eMT, epithelial–mesenchymal transition.
Table 5 information about sW620 and sW480 cell line from american Tissue culture collection (aTcc)
SW620 SW480
aTcc number ccl-227™ ccl-228™
link address http://www.atcc.org/Products/all/ccl-227.aspx http://www.atcc.org/Products/all/ccl-227.aspx
Organism Homo sapiens, human Homo sapiens, human
Tissue colon; derived from metastatic site: lymph node colon
Morphology epithelial epithelial
culture properties adherent adherent
Disease Dukes’ type c, colorectal adenocarcinoma Dukes’ type B, colorectal adenocarcinoma
age 51 years 50 years
gender Male, caucasian Male, caucasian
Tumorigenic Yes Yes
effects Tumors developed within 21 days at 100% frequency (5/5) in nude mice inoculated subcutaneously with 10 (7) cells
Tumors developed within 21 days at 100% frequency (5/5) in nude mice inoculated subcutaneously with 10 (7) cells applications This cell line is a suitable transfection host This cell line is a suitable transfection host
which can contribute to lethal effect on colon cancer cells and reducing tumorigenicity of these cells.13 In addition,
miR-766-3p can promote cell proliferation by targeting the expression of SF2 in renal cell carcinoma (RCC), which is significantly associated with poor survival in a large cohort of RCC specimens.14 miR-545 is found to be involved in
tumor proliferation and progression and is associated with overall survival and progression-free survival in patients with cancer.15–17 Furthermore, miR-195 is associated with the
progression of fibrosis and remodeling of the extracellular
matrix, which can regulate cell proliferation, migration, angiogenesis, and autophagy.18–20 In addition, miR-125a may
represent a novel therapeutic target for the treatment of osteo-sarcoma and some findings have suggested that the detected miR-125a-5p levels in plasma could be used as a potential biomarker in early Kawasaki disease diagnosis.21,22 The
acti-vation of miR-125a confers resistance to BRAF(V)(600E) melanoma cells to BRAF inhibitors.23 Furthermore,
miR-196b significantly contributes to leukemia development,24
and miR-29b could inhibit glioma cell migration and invasion
OncoTargets and Therapy downloaded from https://www.dovepress.com/ by 118.70.13.36 on 25-Aug-2020
Dovepress Yan et al
and inhibit breast cancer cell angiogenesis.25,26 miR-1297
inhibits the growth and metastasis of colorectal cancer.27
miR-141 functions as a tumor suppressor in colorectal cancer SW480 cells,28 and miR-200c regulates cancer progression,
epithelial–mesenchymal transition, and drug resistance.29,30
Conclusion
In conclusion, we used miRNA microarray technology to analyze the different miRNA expression profiling between SW620 and SW480 cells and found that 13 miRNAs were significantly deregulated. The expression levels of miRNAs were validated by qRT-PCR, and the results were found to be consistent with the results detected by microarray analysis. Target gene predictions indicated that differentially expressed miRNAs play an important role in the metastasis of colon cancer. However, further study on these miRNAs and their functions in the tumorigenesis of colon cancer is necessary.
Acknowledgments
This work was supported by National Nature Science Foun-dation of China (Grant No 81172285) and Natural Science Foundation of Fujian Province, People’s Republic of China (Grant No 2018J01392 and 2018J01390).
Disclosure
The authors report no conflicts of interest in this work.
References
1. Wasserman I, Lee LH, Shia J, et al. SMAD4 loss in colorectal cancer: correlation with recurrence, chemoresistance, and immune infiltrate. J Clin Oncol. 2017;35(Suppl 4):587.
2. Lian W, Stoletov K, Jovel J, et al. Development of a miRNA-based signature to predict human cancer metastasis. Cancer Res. 2017; 77(Suppl 13):1044.
3. Farh KK, Grimson A, Jan C, et al. The widespread impact of mamma-lian microRNAs on mRNA Repression and Evolution. Science. 2005; 310(5755):1817–1821.
4. Pencheva N, Tavazoie SF. Control of metastatic progression by microRNA regulatory networks. Nat Cell Biol. 2013;15(6):546–554. 5. Wu CW, Storey KB. Regulation of Smad mediated microRNA
tran-scriptional response in ground squirrels during hibernation. Mol Cell Biochem. 2018;439(1–2):151–161.
6. Zhou J, Hu M, Wang F, Song M, Huang Q, Ge B. miR-224 controls human colorectal cancer cell line HCT116 proliferation by targeting Smad4. Int J Med Sci. 2017;14(10):937–942.
7. Rupaimoole R, Slack FJ. MicroRNA therapeutics: towards a new era for the management of cancer and other diseases. Nat Rev Drug Discov. 2017;16(3):203–222.
8. Li B, Xu WW, Han L, et al. MicroRNA-377 suppresses initiation and progression of esophageal cancer by inhibiting CD133 and VEGF. Oncogene. 2017;36(28):3986–4000.
9. Tanaka S, Hosokawa M, Yonezawa T, Hayashi W, Ueda K, Iwakawa S. Induction of epithelial-mesenchymal transition and down-regulation of miR-200c and miR-141 in oxaliplatin-resistant colorectal cancer cells. Biol Pharm Bull. 2015;38(3):435–440.
10. Leibovitz A, Stinson JC, McCombs WB 3rd, McCoy CE, Mazur KC, Mabry ND. Classification of human colorectal adenocarcinoma cell lines. Cancer Res. 1976;36(12):4562–4569.
11. Chen SG, He Y, Ding J, et al. An insertion/deletion polymorphism in the 3′ untranslated region of β-transducin repeat-containing protein (beta-TrCP) is associated with susceptibility for hepatocellular carcinoma in Chinese. Biochem Biophys Res Commun. 2010;391(1):552–556. 12. Jang JY, Lee YS, Jeon YK, Lee K, Jang JJ, Kim CW. ANT2
suppres-sion by shRNA restores miR-636 expressuppres-sion, thereby downregulating Ras and inhibiting tumorigenesis of hepatocellular carcinoma. Exp Mol Med. 2013;45(1):e3.
13. Afgar A, Fard-Esfahani P, Mehrtash A, et al. MiR-339 and especially miR-766 reactivate the expression of tumor suppressor genes in colorec-tal cancer cell lines through DNA methyltransferase 3B gene inhibition. Cancer Biol Ther. 2016;17(11):1126–1138.
14. Chen C, Xue S, Zhang J, et al. DNA-methylation-mediated repression of miR-766-3p promotes cell proliferation via targeting SF2 expression in renal cell carcinoma. Int J Cancer. 2017;141(9):1867–1878. 15. Gu Y, Zhang M, Peng F, et al. The BRCA1/2-directed miRNA signature
predicts a good prognosis in ovarian cancer patients with wild-type BRCA1/2. Oncotarget. 2015;6(4):2397–2406.
16. Song B, Ji W, Guo S, et al. miR-545 inhibited pancreatic ductal adenocarcinoma growth by targeting RIG-I. FEBS Lett. 2014;588(23): 4375–4381.
17. Du B, Wang Z, Zhang X, et al. MicroRNA-545 suppresses cell prolif-eration by targeting cyclin D1 and CDK4 in lung cancer cells. PLoS One. 2014;9(2):e88022.
18. Wu D, Li Y, Zhang H, et al. Knockdown of Lncrna PVT1 enhances radiosensitivity in non-small cell lung cancer by sponging Mir-195. Cell Physiol Biochem. 2017;42(6):2453–2466.
19. Mo J, Zhang D, Yang R. MicroRNA-195 regulates proliferation, migra-tion, angiogenesis and autophagy of endothelial progenitor cells by targeting GABARAPL1. Biosci Rep. 2016;36(5):e00396.
20. Du J, Zheng R, Xiao F, et al. Downregulated MicroRNA-195 in the bicuspid aortic valve promotes calcification of valve interstitial cells via targeting SMAD7. Cell Physiol Biochem. 2017;44(3):884–896. 21. Tao T, Shen Q, Luo J, et al. MicroRNA-125a regulates cell
prolifera-tion via directly targeting E2F2 in osteosarcoma. Cell Physiol Biochem. 2017;43(2):768–774.
22. Li Z, Jiang J, Tian L, et al. A plasma mir-125a-5p as a novel biomarker for Kawasaki disease and induces apoptosis in HUVECs. PLoS One. 2017;12(5):e0175407.
23. Koetz-Ploch L, Hanniford D, Dolgalev I, et al. MicroRNA-125a promotes resistance to BRAF inhibitors through suppression of the intrinsic apoptotic pathway. Pigment Cell Melanoma Res. 2017;30(3): 328–338.
24. Popovic R, Riesbeck LE, Velu CS, et al. Regulation of mir-196b by MLL and its overexpression by MLL fusions contributes to immortalization. Blood. 2009;113(14):3314–3322.
25. Shi C, Ren L, Sun C, et al. miR-29a/b/c function as invasion suppressors for gliomas by targeting CDC42 and predict the prognosis of patients. Br J Cancer. 2017;117(7):1036–1047.
26. Li Y, Cai B, Shen L, et al. MiRNA-29b suppresses tumor growth through simultaneously inhibiting angiogenesis and tumorigenesis by targeting Akt3. Cancer Lett. 2017;397:111–119.
27. Wang Y, Xue J, Kuang H, Zhou X, Liao L, Yin F. microRNA-1297 inhibits the growth and metastasis of colorectal cancer by suppressing cyclin D2 expression. DNA Cell Biol. 2017;36(11):991–999. 28. Long ZH, Bai ZG, Song JN, et al. miR-141 inhibits proliferation
and migration of colorectal cancer SW480 cells. Anticancer Res. 2017;37(8):4345–4352.
29. Mutlu M, Raza U, Saatci Ö, Eyüpoğlu E, Yurdusev E, Şahin Ö. miR-200c: a versatile watchdog in cancer progression, EMT, and drug resistance. J Mol Med (Berl). 2016;94(6):629–644.
30. Hur K, Toiyama Y, Takahashi M, et al. MicroRNA-200c modulates epithelial-to-mesenchymal transition (EMT) in human colorectal cancer metastasis. Gut. 2013;62(9):1315–1326.
OncoTargets and Therapy downloaded from https://www.dovepress.com/ by 118.70.13.36 on 25-Aug-2020
OncoTargets and Therapy
Publish your work in this journal
Submit your manuscript here: http://www.dovepress.com/oncotargets-and-therapy-journal OncoTargets and Therapy is an international, peer-reviewed, open access journal focusing on the pathological basis of all cancers, potential targets for therapy and treatment protocols employed to improve the management of cancer patients. The journal also focuses on the impact of management programs and new therapeutic agents and protocols on
patient perspectives such as quality of life, adherence and satisfaction. The manuscript management system is completely online and includes a very quick and fair peer-review system, which is all easy to use. Visit http://www.dovepress.com/testimonials.php to read real quotes from published authors.
Dovepress
Dove
press
Differential expression of mirna in colon cancer cell lines
OncoTargets and Therapy downloaded from https://www.dovepress.com/ by 118.70.13.36 on 25-Aug-2020