International Journal of Nanomedicine
Quantum dots affect expression of CD133
surface antigen in melanoma cells
Simona Steponkiene1–3 Simona Kavaliauskiene1 Rasa Purviniene4 Ricardas Rotomskis3,5 Petras Juzenas1
1Department of Radiation Biology,
Institute for Cancer Research, Oslo University Hospital, Radiumhospital, Oslo, Norway; 2Faculty of Natural
Sciences, Vilnius University, Vilnius, Lithuania; 3Biomedical Physics
Laboratory of Oncology Institute, Vilnius University, Vilnius, Lithuania;
4Immunology Laboratory of Oncology
Institute, Vilnius University, Vilnius, Lithuania; 5Biophotonics Laboratory,
Laser Research Center, Vilnius University, Vilnius, Lithuania
Correspondence: Petras Juzenas Department of Radiation Biology, Institute for Cancer Research,
Radiumhospital, Oslo University Hospital, Ullernchausseen 70, Montebello NO-0310 Oslo, Norway Tel +47 22 78 12 05 Fax +47 22 78 12 07
Email [email protected]
Background: In novel treatment approaches, therapeutics should be designed to target cancer stem cells (CSCs). Quantum dots (QDs) are a promising new tool in fighting against cancer. However, little is known about accumulation and cytotoxicity of QDs in CSCs.
Methods: Accumulation and cytotoxicity of CdTe-MPA (mercaptopropionic acid) QDs in CSCs were assessed using flow cytometry and fluorescence-activated cell sorting techniques as well as a colorimetric cell viability assay.
Results: We investigated the expression of two cell surface-associated glycoproteins, CD44 and CD133, in four different cancer cell lines (glioblastoma, melanoma, pancreatic, and prostate adenocarcinoma). Only the melanoma cells were positive to both markers of CD44 and CD133, whereas the other cells were only CD44-positive. The QDs accumulated to a similar extent in all subpopulations of the melanoma cells. The phenotypical response after QD treatment was compared with the response after ionizing radiation treatment. The percentage of the CD44
high-CD133high subpopulation decreased from 72% to 55%–58% for both treatments. The stem-like
subpopulation CD44highCD133low/- increased from 26%–28% in the untreated melanoma cells
to 36%–40% for both treatments.
Conclusion: Treatment of melanoma cells with QDs results in an increase of stem-like cell subpopulations. The changes in phenotype distribution of the melanoma cells after the treatment with QDs are comparable with the changes after ionizing radiation.
Keywords: prominin-1, CD44, glycoproteins, flow cytometry, FACS, nanoparticles
Introduction
Cancer exhibits intratumoral heterogeneity at the genetic and epigenetic levels. The existence of functional heterogeneity between different subpopulations of tumor cells has been described in clonogenic and xenotransplantation studies. Defined subpopula-tions of cancer cells possess enhanced tumorigenicity when injected into immunode-ficient mice. Such isolated cells with self-renewal potential have been termed cancer stem cells (CSCs).1,2
CSCs display extensive differentiation potential and can give rise to new tumors. It has been reported that CSCs are more likely to survive chemotherapy or radiotherapy. Low efficiency of chemotherapy is associated with the ability of CSCs to extrude a drug from the cytosol through transcytosis.3 Other studies have documented that CSCs are also more resistant to radiotherapy than nonstem cells.4 Reduced radiosensitivity is associated with activated defense mechanisms against radiation-induced reactive oxygen species and accelerated repopulation of CSCs. It may also turn out that CSCs are located in hypoxic regions, which shift metabolism to glycolysis and hypoxia-induced
Dove
press
O R I g I N A L R E S E A R C H
open access to scientific and medical research
Open Access Full Text Article
International Journal of Nanomedicine downloaded from https://www.dovepress.com/ by 118.70.13.36 on 23-Aug-2020
For personal use only.
Number of times this article has been viewed
This article was published in the following Dove Press journal: International Journal of Nanomedicine
radioresistance. The percentage of CSCs within a tumor could also be a predicting factor to radiosensitivity or chemotherapy.5,6 Enrichment of the stem cell subpopulation has been observed in glioma after irradiation.7 Thus, CSCs could be the main targets in novel cancer therapies. Creating radio- or chemosensitizers that preferentially sensitize CSCs could be a new strategy in drug development.
Quantum dots (QDs) are a new class of nanomaterials with possibility for easy manipulation of surface chemistry and optical or magnetic properties, and are thus suited for targeted anticancer therapies. QDs are about 10–100 times brighter and 100–1000 times more stable against photo-bleaching than organic dyes or fluorescent proteins, and the optical characteristics of a QD can be tuned by adjusting its size.8 It has been reported that QDs can be used for imaging of cancer cells ex vivo and for detection of mesenchymal stem cells.9,10 The QD surface can be manipulated by either directly conjugating them with antibodies and oligonucleotide probes or indirect linking by strategies such as streptavidin– biotin interaction.11 Antibody-conjugated QDs allow specific recognition and tracking of plasma membrane antigens. Snyder et al12 have used QD-CD44 conjugates for CSC detec-tion ex vivo. However, it is not known how QDs accumulate and influence the expression of CSC surface antigens.
In this study, we investigated the effect of QDs on the expression of two putative stem cell markers, plasma membrane-associated glycoproteins CD44 and CD133, by flow cytometry and fluorescence-activated cell sorting (FACS) techniques.
Material and methods
Materials
A pancreatic adenocarcinoma (Mia-PaCa-2) cell line was purchased from the Health Protection Agency Culture Collections. Prostate adenocarcinoma (PC3) and glioblastoma (U87) cells were obtained from the American Type Culture Collection. Melanoma (FEMX-I) cells were originally derived from lymph node metastasis of a patient with
mela-noma at the Norwegian Radiumhospital in 1980.13 CdTe QDs
coated with mercaptopropionic acid (MPA) were purchased from PlasmaChem GmbH (Berlin, Germany) emitting far-red fluorescence (λmax= 710 ± 5 nm).
Cell culturing
Mia-PaCa-2 and U87 cells were cultured in Dulbecco’s Modified Eagle Medium (DMEM). PC3 and FEMX-I cells were cultured in Roswell Park Memorial Institute (RPMI)-1640 medium. Both growth mediums contained 10% fetal
bovine serum (FBS, Fisher Scientific, Oslo, Norway), 100 U/mL penicillin, 100 mg/mL streptomycin, and 2 mM L-Glutamine (Sigma-Aldrich Norway AS, Oslo, Norway). In the case of the U87 cells, the DMEM medium was addi-tionally supplemented with 3% MEM nonessential amino acids (Sigma-Aldrich). The cells were routinely cultivated in 25 cm2 Nunclon culture dishes (VWR International, Oslo, Norway) under standard conditions and were subcultured twice a week and kept in a humidified incubator at 37°C with 5% CO2. For experiments, the cells were harvested by bring-ing them into suspension via trypsinization and by seedbring-ing a necessary amount of cells into Nunclon multiplates.
QD staining
A stock solution of QDs was prepared by dissolving 1 mg QDs in 1 mL phosphate buffered saline (PBS) (Sigma-Aldrich) at pH 7.4 or saline (0.9% w/v NaCl). The stock solution was further diluted to a desired concentration in the growth medium and poured over the cells growing in the multiplates. The medium without QDs was poured in a few wells to have control cells in the same multiplate. After incubation at 37°C for 24 hours, the cells were washed with
ice-cold PBS+ (standard PBS supplemented with 0.9 mM
CaCl2 and 0.5 mM MgCl2 to prevent cell detachment at this step) to remove any free QDs. Immediately after washing, the cells were brought into suspension by trypsinization for further analysis using monoclonal antibodies.
Radiation treatment
Ionizing radiation was used as a positive treatment control with changes in the phenotype of cancer cells. FEMX-I cells were exposed to different doses ranging from 0 Gy to 10 Gy delivered by a Müller X-ray apparatus operated at 220 kV, 20 mA, with a 0.5 mm Cu filter.
Immunostaining and FACS
Up to 106 cells were labeled in PBS solution with mouse antihuman monoclonal CD44 antibody conju-gated with fluorescein isothiocyanate (FITC, BD Bio-sciences, Franklin Lakes, NJ) and mouse antihuman monoclonal CD133 antibody conjugated with phycoeryth-rin (PE, eBioscience, San Diego, CA) for 20 minutes at room temperature. Respective mouse immunoglobu-lin and dye conjugates, IgG2b-FITC (Dako, Glostrup, Denmark) and IgG1-PE (BD Biosciences), were used as unspecific binding controls. Flow cytometric analysis was car-ried out with a FACSort or LSR II analyzer (BD Biosciences). The data were analyzed with FlowJo (Tree Star Inc, Ashland,
Dovepress
Steponkiene et al
International Journal of Nanomedicine downloaded from https://www.dovepress.com/ by 118.70.13.36 on 23-Aug-2020
OR) software. A minimum of 10,000 viable cells were measured per sample. Using forward and side scatter profiles and propidium iodide staining, debris, cell doublets, and dead cells were gated out, respectively. FACS was performed on a BD FACSAria or FACSort Cell Sorter (BD Biosciences). Puri-ties of the sorted populations, as determined by postsorting flow analysis, were generally .90%.
Cytotoxicity assay
The cytotoxicity of the QDs was determined using a methyl-ene blue assay on the FEMX-I cell line. The same amount of cells in each well were seeded in a 96-well plate and incubated with different concentrations of the QDs. After 24 hours of incubation the old medium was carefully aspirated, and the cells were supplemented with fresh medium and left for further growth under standard culture conditions. After 3 days the cells were washed with ice-cold PBS and fixed with
70% ethanol. After 10 minutes, 100 µL of filtered 1% w/v
methylene blue aqueous solution was added to each well. After 20 minutes, the excess dye was removed by washing the wells with distilled water. To elute the dye, 200 µL of 0.2% Triton X-100 solution (Sigma-Aldrich) was added to each well and left overnight at 37°C. The plates were then gently shaken, and the absorbance at 650 nm was measured for each well with a microplate photometer (BioTek Instruments, Winooski, VT). The photometer was blanked on the first column of the wells containing the elution solvent alone. For the determination of the FEMX-I cell viability follow-ing ionizfollow-ing radiation, the cells were grown for 24 hours after irradiation, and cell suspensions were analyzed by a Beckman Coulter viability analyzer (Vi-Cell XR, Beckman Coulter Inc, Brea, CA).
Results
Heterogeneity of four cancer cell lines using putative stem cell markers for CD133 and CD44 was investigated. The cell surface-associated CD44 is an adhesion glycoprotein. The function of CD133 is still unknown, but it has been shown to be involved in the dynamics of membrane protrusions and to mark CSCs. The flow cytometry technique was performed to detect fluorescence from single cells after combined stain-ing with antibody-dye conjugates against CD133 and CD44. All cell lines expressed CD44 to a similar degree, from 96.2% to 99.9% (Figure 1). However, the expression of CD133 was very low among these cell lines (0.001%–0.23%) with slightly higher prevalence in U87 cells (1.94%, Figure 1B). Only FEMX-I cells exhibited high levels of CD133 (99.1%, Figure 1D).
The response to CD markers was not enough to deter-mine heterogeneity of the cell lines. Therefore, we further analyzed the shape of their phenotypical patterns (Figure 1). U87 (Figure 1B) cells show nearly uniform semihorizontal oval-shaped cloud distribution. PC3 (Figure 1A) and Mia-PaCa-2 (Figure 1C) cells show two clouds, indicat-ing two subpopulations: circular-shaped dense cloud with high CD44 expression (CD44high) and a horizontal oval cloud with low/no CD44 expression (CD44low/-).
FEMX-I cells appear to consist of three different sub-populations: CD44highCD133high, CD44highCD133low/-, and
CD44low/-CD133low/- (Figure 1D).
Because FEMX-I cells showed high expression of both CD markers with three distinct subpopulations, we further examined their capability of growing and restoring initial population. Each subpopulation (CD44highCD133high, CD44highCD133low/-, and CD44low/-CD133low/-) was FACS
sorted, isolated, and plated under usual growing conditions. CD44low/-CD133low/- cells did not grow after sorting.
CD44highCD133high cells grew after sorting, but after 10 days of growth the cells did not show significant changes in their phenotypical composition. Immediately after sorting, the subpopulation was composed of ∼95% CD44highCD133high cells and remained unchanged after 10 days of growth (Figure 2B), suggesting that CD44highCD133high sub-population was unable to restore its progeny. However, CD44highCD133low/- cells were able to grow and change their
phenotypical composition. Immediately after sorting, the cells were composed of ∼80% CD44highCD133low/- cells, and
after 10 days of growth this subpopulation was composed of ∼58% CD44highCD133low/- and ∼41% CD44highCD133high cells, thus approaching the phenotypical composition of the unsorted cells (Figure 2C).
To determine treatment effects, first, the survival rate was measured for the FEMX-I cells. The cell viability follows a dose-response relationship: The proliferation decreases with increasing radiation dose or QD concentration (Figure 3). Second, phenotypic responses were measured following these treatments.
It is important to ensure that changes in phenotypical composition are due to the treatment and are not affected by wrong gating or background signals. After the radiation treatment, morphologic alterations in the cells can be seen, such as increased size and roughness (Figure 4A). Cell auto-fluorescence signal also alters after the treatment. The cells show a higher autofluorescence signal on the detector corre-sponding to CD44-FITC (Figure 4B), which must be included as a background signal when gating. The same is true for the
Dovepress Quantum dots affect CD133 expression
International Journal of Nanomedicine downloaded from https://www.dovepress.com/ by 118.70.13.36 on 23-Aug-2020
100 100
Q4 0.286% Q1 0.00%
Q2 0.229%
Q3 99.5% 101
101 102
102
PC-3
103
103 104
104
0
0 Q4 0.215% Q1 0.002%
Q2 1.90%
Q3 97.9% 102
102 103
103
U87
104
104 105
105
100 100
Q4 0.129% Q1 0.00%
CD133 expression Q20.081%
Q3 99.8% 101
101 102
102
Mia-PaCa-2
103
103 104
104
100 100
Q4 0.00% Q1 0.009%
Q2 100.0%
74.39%
0.21% 24.8%
Q3 0.036% 101
101 102
102 103
103 104
104
FEMX-I
CD44 expression
A B
C D
Figure 1 The expression of CD133 and CD44 in different human cancer cell lines. Prostate adenocarcinoma (A), glioblastoma (B), pancreatic adenocarcinoma (C), and melanoma cells (D). The red dots represent the isotype control and the blue dots represent the stained samples.
100 100
Did not grow after sorting
10 days after sorting
Q4 0.121% Q1 0.037%
Q2 71.7%
Q3 28.2% 101
101 102
102 103
103 104
104 A
100 100
Q4 0.496% Q1
0.170%
Q2 95.2%
Q3 4.12% 101
101 102
102 103
103 104
104 B
100 100
Q4 0.644% Q1 0.133%
Q2 41.3%
Q3 57.9% 101
101 102
102 103
103 104
104 C
CD133 expression
CD44 expression
Figure 2 The expression of CD133 and CD44 after fluorescence-activated cell sorting of different subpopulations of FEMX-I cells. Phenotype of the total population of the cells before sorting (A), and phenotype of CD44highCD133high (B) and CD44highCD133low/- (C) subpopulations after 10 days’ growth after sorting. The different colors of the
dots in A, B, and C show the number of overlapping dots: the red dots represent denser areas than the blue dots.
Dovepress
Steponkiene et al
International Journal of Nanomedicine downloaded from https://www.dovepress.com/ by 118.70.13.36 on 23-Aug-2020
0
0 10 20 30
Concentration, µg/mL
Cell survival, % of control
40 50
CdTe-MPA treated X-ray treated
60
0 2 4 6
Dose, Gy
8 10
70 20
40 60 80 100 120
Figure 3 Viability of FEMX-I cells after different treatments: irradiated with different doses of 160 kV X-rays (curve with black quadrates) and incubated with different concentrations of the CdTe-MPA quantum dots for 24 hours (curve with white circles). The viability was calculated as a percentage of the number of the treated cells relative to the number of the control untreated cells. The results are means ± standard deviation from three independent experiments.
100 100
Q4 0.640% Q1 1.41%
Q2 72.3%
Q3 25.7% 101
101 102
102 103
103 104
0 0 200
200 400
400 600
600
FSC-A
SSC-A
800 800
1K
1K
104
CD44 expression A
D
100 100
Q4 2.42% Q1 0.525%
Q2 62.0%
Q3 35.1% 101
101 102
102 103
103 104
104 E
100 100 101
101 102
102
Control 7 Gy 10 Gy
103
103 104
104 B
100 100 101
101 102
102 103
103 104
104 C
100 100
Q4 4.43% Q1 0.275%
Q2 58.8%
Q3 36.5% 101
101 102
102 103
103 104
104 F
CD133 expression
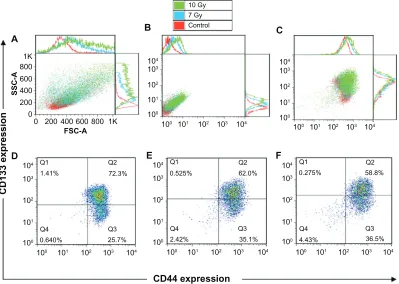
Figure 4 Forward and side scatter chart of the untreated and radiation treated (7 Gy and 10 Gy) FEMX-I cells (A). Flow charts of the same cells without antibody staining (autofluorescence) (B) and with CD133/CD44 markers (C). The expression profiles of CD133 and CD44 shown separately for untreated cells (D) and for cells irradiated with 7 gy (E) and 10 gy (F). The different colors of the dots in D, E, and F show the number of the overlapping dots: The red dots represent denser areas than the blue dots.
detector corresponding to CD133-PE. The addition of the surface membrane markers shows changes in phenotypical composition caused by the treatment (Figure 4C).
The doses (7 Gy and 10 Gy) of ionizing radiation were chosen to induce death of more than half of the cells
( Figure 3). The percentage of the CD44highCD133high subpopu-lation decreased from 72% in the control unirradiated cells to 58%–62% after irradiation, whereas that of the subpopulation
CD44highCD133low/- increased from 26% to 35%–36%. The
percentage of CD44lowCD133low/- subpopulation increased
from 0.6% in the untreated cells to ∼2.4%–4.4% in the cells after irradiation (Figure 4D–F).
To investigate the response of each subpopulation
to the QDs, a 50 µg/mL concentration of the
CdTe-MPA QDs was chosen to be high enough to induce death of approximately half of the cells (Figure 3). A doubled concentration of the QDs was also used to observe any concentration-dependent processes. The intensity histogram of the infrared detector confirms the accumulation of the QDs in the cells ( Figure 5A and B). The number of QD positives was calculated as a percent-age of CD44highCD133high or CD44highCD133low/- cells
(Figure 5C). Approximately 94%–99% cells in each subpopulation exhibited QD fluorescence showing no dif-ference in the QD uptake by these subpopulations.
After the treatment with the QDs, morphologic alterations in the cells could be seen just like after the ionizing radiation: increased cell size, roughness (Figure 6A), and cell autofluorescence (Figure 6B). Again, just like for the
Dovepress Quantum dots affect CD133 expression
International Journal of Nanomedicine downloaded from https://www.dovepress.com/ by 118.70.13.36 on 23-Aug-2020
100
100 Q4 0.121% Q1 0.037%
Q2 71.7%
Q3 28.2%
101
101
102
102
103
103
104
0 0 200
200 400
400 600
600
FSC-A
SSC-A
800 800
1K
1K
104
CD44 expression A
D
100
100 Q4 6.72% Q1 0.144%
Q2 54.3%
Q3 38.8%
101
101
102
102
103
103
104
104 E
100
100
101
101
102
102 Control 50 µg/mL 100 µg/mL
103
103
104
104 B
100
100
101
101
102
102
103
103
104
104 C
100
100 Q4 4.90% Q1 0.254%
Q2 55.0%
Q3 39.9%
101
101
102
102
103
103
104
104 F
CD133 expression
Figure 6 Forward and side scatter chart of the untreated and quantum dot-treated FEMX-I cells (A). Flow charts of the same cells without antibody staining (autofluorescence) (B) and with CD133/CD44 markers (C). The expression profile of CD133 and CD44 shown separately for untreated cells (D) and for quantum dot-treated cells with two concentrations, 50 µg/mL (E) and 100 µg/mL (F). The different colors of the dots in D, E, and F show the number of overlapping dots: The red dots represent denser areas than the blue dots.
CdTe780-A
0
Coun
t
100 101 102 CdTe 94.7%
CdTe 99.9%
103 104
CdTe780-A
100 101 102 103 104 A
Coun
t
B
0
50 µg/mL 20
40
100 µg/mL 60
CdTe positives, % of total cells
80
CD44high CD133high CD44high CD133low/− 100
Figure 5 Accumulation of the CdTe-MPA quantum dots (QDs) in FEMX-I cells. Intensity histograms represent autofluorescence of the control untreated cells (red curve) and the fluorescence of the cells treated with 50 µg/mL (A, blue curve) and 100 µg/mL (B, blue curve) QDs, respectively. The percentage of cells positive for QD fluorescence was 94%–99% in all subpopulations (C).
cells treated with the ionizing radiation, the correct gating for the background signals was performed (Figure 6C). The QD treatment resulted in the appearance of a denser cloud of the cell debris (located in the left lower corner in Fig-ure 6A), confirming that the QDs are cytotoxic to the cells. When compared with the control untreated cells, the cells treated with the lower concentration of the QDs contained 1.4 times more of the CD44highCD133low/- cells
(39% versus 28% in the control) and 1.3 times less of the CD44highCD133high cells (54% versus 72% in the control) (Figure 6D and E).
The percentage of CD44low/-CD133low/- cells increased
after the treatment, which might be associated with QD-induced early apoptosis. Early apoptotic cells are difficult to exclude during dead cell staining with propidium iodide; therefore, apoptotic cells might be present in this flow cytometry plot. The phenotypical composition observed in the cells treated with the higher concentration of the QDs (Figure 6F) was analogous to that of the lower concentra-tion of the QDs. This indicates that concentraconcentra-tion-dependent changes in the phenotypical composition were not observed.
Dovepress
Steponkiene et al
International Journal of Nanomedicine downloaded from https://www.dovepress.com/ by 118.70.13.36 on 23-Aug-2020
Discussion
The property of resistance to radiation therapy is one major clinical criterion to characterize CSCs. The fraction of CSCs in a tumor could be a factor to predict resistance to the therapy.5–7 McCord et al14 have studied responsiveness to radiation in a series of glioma cell lines. Interestingly, the stem cells were more sensitive to radiation than estab-lished cell lines. The authors have concluded that a major determinant of radiosensitivity is the repair of DNA lesions, which depends on the tumor origin from which the cells were isolated. The mechanisms of CSC responsiveness to existing therapies are not yet well understood.
In this study, we have investigated population heterogene-ity of prostate and pancreatic adenocarcinoma, glioblastoma, and melanoma cell lines using putative CSC markers, CD44, an adhesion molecule, and CD133, which has recently been considered as a common marker of CSCs.15 All studied cell lines exhibited high expression of CD44, whereas CD133 was highly expressed only in FEMX-I cells. Therefore, the latter cells were chosen for further examination of their stem-like properties.
Our experiments demonstrate that FEMX-I cells consist of three distinct subpopulations with different CD133 and CD44 expression levels: CD44highCD133high, CD44highCD133low/-, and CD44low/-CD133low/-. Hill16 and
Rappa et al17 have also shown CD133 expression in FEMX-I
cells and stated that downregulation of CD133 in FEMX-I cells results in decreased growth rate and migratory capacity, which suggests CD133 to be essential in tumor formation and regression. Interestingly, we can suggest that the subpopula-tion with lower expression of CD133 antigen represents tum-origenic stem cells, because only CD44highCD133low/- cells
were capable of progeny restoration after their isolation and were also more resistant to the radiation treatment and the toxic effect of CdTe-MPA QDs. After the radiation or QD treatment, the FEMX-I cells maintained a higher fraction of CD44highCD133low/- cells (35%–40%) compared with that
(26%–28%) in the control untreated cells.
The toxicity of CdTe QDs is associated with release of Cd2+ ions and generation of reactive oxygen species
products.18 The concentration of the QDs was chosen to correspond to lethal concentrations of LC40 and LC30, ie, high enough to induce obvious QD-associated cell death and thus to examine whether a QD-resistant sub-population exists. Although no significant differences
in CdTe-MPA accumulation among CD44highCD133high,
CD44highCD133low/-, and CD44low/-CD133low/- subpopulations
were observed, these subpopulations showed different
behavior. The percentage of CD44highCD133low/- cells actually
increased after the QD treatment.
The CD133 was the first identified membrane protein named prominin for its prominent location on the protrusion of cell membranes.15 Rappa et al17 have suggested that the CD133 can be a potential target for antimelanoma therapy.
In our study, we have divided the CD133+ population into
two subpopulations, CD133high and CD133low/-, which showed
different responses to the therapy.
When considering novel targeted therapies it is important to know whether a new therapeutic agent can actually accumu-late in a cell. In this study we show that, although the FEMX-I cell line is heterogeneous, the CdTe-MPA QDs accumulate equally in different cell subpopulations. To our knowledge, this is the first time QD accumulation in different subpopula-tions of cancer stem-like cells has been evaluated.
The other important aspect is to ensure that the therapeutic agent binds to the desired target. Lidke et al19 targeted cancer cells by conjugating QDs to a human epidermal growth factor, a small protein with a specific affinity to its membrane recep-tor. Fluorescence emitted from such QDs allowed continuous observation of the cells. Wang et al20 demonstrated a CSC targeting therapy. Photothermolysis with carbon nanotubes conjugated with anti-CD133 antibody selectively eradicated CD133 positive glioma cells. Current interest in QDs lies in their attractive imaging properties. QDs conjugated with a targeting antibody also have the potential to label and eliminate desired subpopulations of cancer cells.
Conclusion
Our experiments show that the FEMX-I cell line is heteroge-neous and can be divided into subpopulations with higher and lower expressions of CD44 and CD133. The subpopulation with the lower expression of CD133 (CD44highCD133low/-)
displays characteristics of CSCs. It is more resistant to ionizing radiation or QD cytotoxicity and able to restore its progeny. There is no difference in the accumulation of the CdTe-MPA QDs among different FEMX-I subpopulations. These results encourage further investigations on the appli-cability of QDs in CSC targeting therapies.
Acknowledgments
This study was supported by the Research Council of Lithuania Grant No. LIG-15/2010, the EU and Norwegian Grant No. 2004-LT0036-IP-1 NOR. The work of Simona (Petrosiute) Steponkiene was funded by the European Com-mission’s ERASMUS Lifelong Learning Programme (LLP). Petras Juzenas and Simona (Lukoseviciute) Kavaliauskiene
Dovepress Quantum dots affect CD133 expression
International Journal of Nanomedicine downloaded from https://www.dovepress.com/ by 118.70.13.36 on 23-Aug-2020
International Journal of Nanomedicine
Publish your work in this journal
Submit your manuscript here: http://www.dovepress.com/international-journal-of-nanomedicine-journal
The International Journal of Nanomedicine is an international, peer-reviewed journal focusing on the application of nanotechnology in diagnostics, therapeutics, and drug delivery systems throughout the biomedical field. This journal is indexed on PubMed Central, MedLine, CAS, SciSearch®, Current Contents®/Clinical Medicine,
Journal Citation Reports/Science Edition, EMBase, Scopus and the Elsevier Bibliographic databases. The manuscript management system is completely online and includes a very quick and fair peer-review system, which is all easy to use. Visit http://www.dovepress.com/ testimonials.php to read real quotes from published authors. were supported by the Research Council of Norway (Grant
No. 182058), the South-Eastern Norway Regional Health Authority (Grant No. 20100068), and the Norwegian Radium Hospital Research Foundation (Grant No. FU0802). We are grateful to Dr Lina Prasmickaite for helpful advice. The Flow Cytometry Core Facility at the Radiumhospital, by Idun Dale Rein, is acknowledged for help with analyses and sorting.
Disclosure
The authors report no conflicts of interest in this work.
References
1. Shipitsin M, Polyak K. The cancer stem cell hypothesis: in search of definitions, markers, and relevance. Lab Invest. 2008;88:459–463. 2. Bertolini G, Roz L. Highly tumorigenic lung cancer CD133+ cells
display stem-like features and are spared by cisplatin treatment. PNAS. 2009;106:16281–16286.
3. Phillips TM, McBride WH, Pajonk F. The response of CD24-/low/ CD44+ breast cancer-initiating cells to radiation. J Natl Cancer Inst. 2006;98:1777–1785.
4. Woodward WA, Chen MS, Behbod F, et al. WNT/β-catenin mediates radiation resistance of mouse mammary progenitor cells. Proc Natl Acad Sci U S A. 2007;104:618–623.
5. Diehn M, Clarke MF. Cancer stem cells and radiotherapy: new insights into tumor radioresistance. J Natl Cancer Inst. 2006;98:1755–1757. 6. Sheehan JP, Shaffrey ME, Gupta B, et al. Improving the
radiosensitiv-ity of radioresistant and hypoxic glioblastoma. Future Oncol. 2010;6: 1591–1601.
7. Bao S, Wu Q, McLendon RE, et al. Glioma stem cells promote radiore-sistance by preferential activation of the DNA damage response. Nature. 2006;444:756–760.
8. Smith AM, Duan H, Mohs AM, et al. Bioconjugated quantum dots for in vivo molecular and cellular imaging. Advanced Drug Delivery Reviews. 2008;60:1226–1240.
9. Gao X, Cui Y, Levenson RM, et al. In vivo cancer targeting and imaging with semiconductor quantum dots. Nat Biotechnol. 2004;22: 969–976.
10. Muller-Borer BJ, Collins MC, Gunst PR, et al. Quantum dot labeling of mesenchymal stem cells. J Nanobiotech. 2007;5:1–9.
11. Fountaine TJ, Wincovitch SM, Geho DH, et al. Multispectral imaging of clinically relevant cellular targets in tonsil and lymphoid tissue using semiconductor quantum dots. Mod Pathol 2006;19:1181–1191. 12. Snyder EL, Bailey D, Shipitsin M, et al. Identification of CD44v6+/
CD24- breast carcinoma cells in primary human tumors by quantum dot-conjugated antibodies. Lab Invest. 2009;89:857–866.
13. Fodstad O, Kjonniksen I, Aamdal S, et al. Extrapulmonary, tissue-specific metastasis formation in nude mice injected with FEMX-I human melanoma cells. Cancer Res. 1988;48:4382–4388.
14. McCord AM, Jamal M, Williams ES, et al. CD133+ glioblastoma stem-like cells are radiosensitive with a defective DNA damage response compared with established cell lines. Clin Cancer Res. 2009;15: 5145–5153. 15. Mizrak D, Brittan M, Alison MR. CD133: molecule of the moment.
J Pathol. 2008;214:3–9.
16. Hill RP. Identifying cancer stem cells in solid tumors: case not proven.
Cancer Res. 2006;66:1891–1895.
17. Rappa G, Fodstad O, Lorico A. The stem cell-associated antigen CD133 (prominin-1) is a molecular therapeutic target for metastatic melanoma.
Stem Cells. 2008;26:3008–3017.
18. Cho SJ, Maysinger D, Jain M, et al. Long-term exposure to CdTe quantum dots causes functional impairments in live cells. Langmuir. 2007;23:1974–1980.
19. Lidke DS, Nagy P, Heintzmann R, et al. Quantum dot ligands provide new insights into erbB/HER receptor-mediated signal transduction. Nat Biotechnol. 2004;22:198–203.
20. Wang CH, Chiou SH, Chou CP, et al. Photothermolysis of glioblas-toma stemlike cells targeted by carbon nanotubes conjugated with CD133 monoclonal antibody. Nanomedicine. 2011;7:69–79.
Dovepress
Dove
press
Steponkiene et al
International Journal of Nanomedicine downloaded from https://www.dovepress.com/ by 118.70.13.36 on 23-Aug-2020