The contribution of divided attention to tripping while walking
A Research Thesis Presented to
School of Human Movement, Recreation and Performance
Faculty of Arts, Education and Human Development
VICTORIA UNIVERSITY
In fulfilment of the requirement for the degree
Doctor of Philosophy
LISA ANN DELL’ORO
Principal supervisor: A/Prof R. Begg
Co-Supervisor: Dr R. Best
ACKNOWLEDGEMENTS
The completion of this thesis was accomplished through the support of many people, to
whom I wish to express my gratitude.
My parents, Cathy and Chris – I thank you dearly for your enduring support and
encouragement. Your unwavering faith in my ability, your enormous capacity to
empathise and unbeatable methods of motivation were appreciated more than you can
imagine. My parents and parents-in-law, Ronda and Terry – I thank you for assisting
with minding my beautiful boy, Matthew, whilst I embarked upon the mountainous task
of writing the thesis. My husband, Gavin – I thank you for your incredible patience and
support throughout the journey. Finally, my supervisors, Russell and Rezaul – I thank
you for providing endless support and expert critical comment.
Abstract
Falls in older adults has long been recognised as a significant public health problem
requiring urgent intervention. Tripping while walking is one of the most commonly cited
reasons for falls, however, little research has focused so far on foot motion characteristics
and their contribution to the likelihood of tripping while walking. Even fewer studies have
examined tripping on unseen obstacles while obstacle negotiation (i.e. tripping on seen
obstacles) has received more attention. The primary aim of this research was to examine
foot motion during long-term (e.g., 30 minutes) continuous treadmill walking by
measuring minimum toe clearance (MTC), the very small distance the foot clears the
ground during swing phase of gait. Examining MTC of each stride allowed an estimation
of the likelihood of an individual tripping on unseen obstacles while walking. Since
cognitive decline and reduced ability to multitask (reduced divided attention capacity) has
been observed in older adults and has been linked to falls risk, this research also examines
foot kinematics during distracted walking conditions. Foot motion was analysed during
undistracted and distracted walking using various short (turning the head to identify
objects to the left and then the right; reacting to a visual stimulus by pressing a hand-held
button; reaching into a waist pouch to retrieve a handkerchief; and a cough) and
prolonged distractions (counting backwards by threes; and watching a video) that could be
encountered in normal everyday life. This enabled an evaluation of the types of
distractions and situations that might increase the risk of tripping in healthy elderly
females.
This research, therefore: (1) focused on healthy elderly females (n = 18, mean age 71.3
years, SD = 3.6 years) and healthy young females (n = 18, mean age 21.8 years, SD = 3.6
years); (2) utilised a 2D model of the foot to using shoe dimension to calculate MTC at
midswing; (3) calculated probability of tripping for each subject based on individual MTC
distributions; and (4) examined MTC descriptive statistics during undistracted walking at a
self-selected comfortable walking speed on the treadmill for ~20 minutes and during
Descriptive statistics of individual MTC distributions, which included between 906 to
1253 strides per subject, were examined. For undistracted walking, the elderly adults had
lower measures of all variables in the lower end of the MTC distribution, namely minimum
(minMTC) (1.08cm vs. 1.42cm, p<.05), first percentile (PC1MTC) (1.35cm vs. 1.68cm, p<.05), fifth percentile (PC5MTC) (1.50cm vs. 1.81cm, p<.05), and first quartile (Q1MTC)
(1.80cm vs. 2.00cm, p<.05). The higher skewness of MTC distributions (0.60 vs. 0.33,
p<.05) in the elderly, however, suggests some attempt was made to reduce the frequency of MTC in the lower portion of the distribution. It was discovered that an individual’s
calculated frequency of tripping was approximately once every second stride when MTC
was approximately equal to the individual’s MTC distribution central tendency (median).
Elderly subjects had greater calculated probability of tripping (PT) between MTC(y) =
0.9cm – 2.0cm (p<.05). The elderly also had higher intra-individual variability in MTC as measured by interquartile range (IQRMTC) (0.44cm vs. 0.28cm, p<.01). For normal
undistracted walking, the elderly are at an increased risk of tripping on unseen obstacles
given the smaller MTC and greater variability in MTC.
For the distracted walking conditions, the elderly had significantly lower medianMTC
compared with the young for most distraction tasks (p<.05). The elderly also typically had lower minMTC and higher IQRMTC compared with the young. The lower MTC and higher
intra-individual variability due to distractions places the elderly at an increased risk of
tripping on small unseen obstacles compared with the young. The distraction eliciting the
smallest MTC was a prolonged task (60 seconds) and involved structural interference
where vision was focused on the task as well as maintaining posture and balance (video
task). Distractions such as observing the scenery while walking therefore could increase
the likelihood of tripping. The largest MTC was during the head turn task, where subjects turned the head to identify objects to the left and right. This large MTC could have been
an attempt to reduce the likelihood of tripping.
Student Declaration
“I, Lisa Dell’Oro, declare that the PhD thesis entitled “The contribution of divided attention to tripping while walking” is no more than 100,000 words in length including quotes and exclusive of tables, figures, appendices, bibliography, references and footnotes. This thesis contains no material that has been submitted previously, in whole or in part, for the award of any other academic degree or diploma. Except where otherwise indicated, this thesis is my own work”.
Table of Contents
Chapter 1:
Introduction... 26
Chapter 2:
Literature review ... 32
2.1 Falling behaviour in elderly populations ... 32
2.1.1 Falls incidence and outcomes... 32
2.1.2 Falls risk factors ... 39
2.1.2.1 An overview of risk factors ... 39
2.1.2.2 The role of vision and other sensory control (vestibular and proprioceptive input) in balance and gait ... 42
2.1.2.3 Impaired cognition and divided attention ability... 48
2.1.3 Falls prevention and prediction ... 67
2.1.4 Summary ... 71
2.2 Biomechanics of normal human gait ... 74
2.2.1 Overview of the gait cycle ... 74
2.2.2 Swing phase of gait and minimum toe clearance... 76
2.2.2.1 Age-related changes to gait ... 85
2.2.3 Methodological issues in biomechanics research... 92
2.2.3.1 Variability in gait and sample sizes required for an accurate representation of gait ... 92
2.2.3.2 Generalising treadmill walking to overground walking... 102
2.2.4 Summary ... 106
2.3 Tripping and obstacle avoidance research... 108
2.3.1 Calculation of the probability of tripping... 113
Chapter 3:
Objectives of investigation ... 125
3.1 General aims ... 125
3.2 Specific aims... 126
3.2.1 Hypotheses ... 126
Chapter 4:
Methods... 127
4.1 Subjects ... 127
4.1.1 Population studied ... 127
4.1.2 Recruitment ... 128
4.1.2.1 Preliminary screening of elderly subjects... 129
4.1.2.2 General Practitioner approval... 130
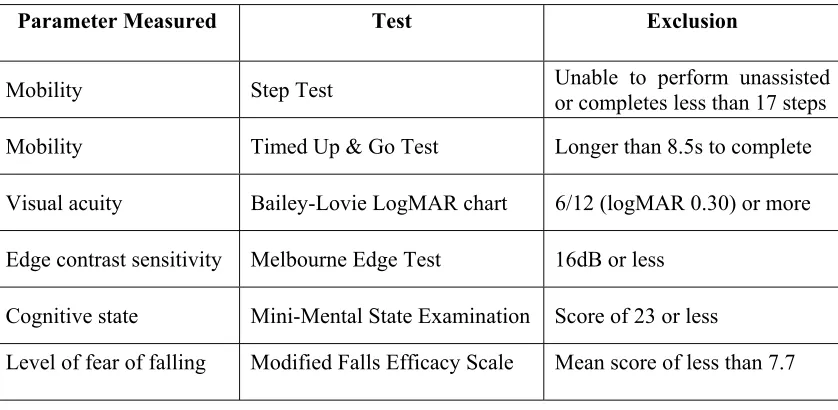
4.1.2.3 Final screening tests for elderly subjects... 131
4.1.2.3.1 Mobility tests... 132
4.1.2.3.1.1 Step Test... 132
4.1.2.3.1.2 Timed Up & Go Test... 133
4.1.2.3.2 Vision ... 136
4.1.2.3.2.1 Bailey-Lovie logMAR chart for visual acuity... 136
4.1.2.3.2.2 Contrast sensitivity function (Melbourne Edge Test – MET) ... 137
4.1.2.3.3 Cognitive state (Mini-Mental State Examination - MMSE) .... 139
4.1.2.3.4 Level of fear of falling (Modified Falls Efficacy Scale – MFES) ... 139
4.2 Instrumentation and procedure... 141
4.3 Experimental procedure ... 142
4.3.1 Experimental set-up... 142
4.3.2 Calculation of individual preferred walking speed (PWS) and treadmill familiarisation ... 147
4.3.3 Placement of LED markers for analysis of foot motion... 150
4.3.4 Treadmill walking task... 152
4.3.4.1 Walking without distractions... 155
4.3.4.2 Distracted walking... 156
4.3.4.2.1 Instantaneous/short distractions ... 158
4.3.4.2.1.1 Reaction time probe (RTP) task ... 158
4.3.4.2.1.2 Head turn task ... 160
4.3.4.2.1.3 Pouch task ... 161
4.3.4.2.1.4 Cough task... 162
4.3.4.2.2 Prolonged distractions ... 162
4.3.4.2.2.1 3s task... 162
4.3.4.2.2.2 Video task ... 164
4.4 Data analysis ... 165
4.4.1 Digitising using the Peak Motus system ... 165
4.4.1.1 Calibration ... 165
4.4.1.2 Digital filtering ... 166
4.4.2 Pre-analysis ... 166
4.4.3 2D geometric model of the foot ... 168
4.4.4 Analysis of trial data ... 170
4.5 Describing the data... 179
4.5.1 Descriptive statistics of the MTC distribution. ... 179
4.5.1.1 Undistracted walking... 179
4.5.1.2 Distracted walking... 182
4.5.2 Probability of Tripping... 185
4.5.2.1 Modelling sample distribution... 185
4.5.2.2 Skew modelling ... 187
4.5.2.3 Kurtosis modelling ... 188
4.5.2.4 Calculating the probability of tripping (PT)... 190
4.6 Statistical analysis ... 193
4.6.1 Exploratory data analysis and descriptive statistics ... 193
4.6.2 Inferential statistics ... 198
4.6.2.1.1 To address null hypothesis “No significant effect of age upon major descriptive statistics of the MTC distribution” (aim 1, hypothesis 1) ... 199
4.6.2.1.2 To address null hypothesis “No significant effect of walking condition upon major descriptive statistics of the MTC distribution” (aim 1, hypothesis 2) ... 200
4.6.2.1.3 To address null hypothesis “No significant age effect upon predicted probability of tripping” (aim 2, hypothesis 1) ... 202
5.1 Subject characteristics ... 204
5.2 Screening for elderly participants ... 206
5.3 Walking speed characteristics... 207
5.4 Normal, undistracted walking... 211
5.4.1 Describing the MTC distribution ... 211
5.4.2 Exploratory data analysis ... 212
5.4.2.1 Outliers and extreme values ... 214
5.4.3 Inferential statistics ... 219
5.4.3.1 Combined group MTC data... 220
5.4.3.2 Central Tendency... 222
5.4.3.3 Variability/Dispersion ... 223
5.4.3.3.1 Variability measures... 224
5.4.3.3.2 Dispersion measures... 227
5.4.3.4 Symmetry/distribution... 228
5.4.3.5 Correlations between MTC distribution descriptive statistics... 230
5.4.3.6 Probability of tripping ... 234
5.5 Distracted walking... 239
5.5.1 Effect of distractions on MTC central tendency. ... 247
5.5.1.1 Exploratory Data Analysis ... 247
5.5.1.2 Inferential statistics... 253
5.5.1.2.1 MedianMTC... 253
5.5.1.2.2 Z'(distr) score ( medianMTC(distr) relative to medianMTC(norm)) ... 257
5.5.1.3 Chi-square test to compare effect of distractions ... 259
5.5.2.1 Exploratory data analysis ... 263
5.5.2.2 Inferential statistics... 267
5.5.3 Effect of distractions on variability (IQRMTC)... 270
5.5.3.1 Exploratory data analysis ... 270
5.5.3.2 Inferential statistics... 273
5.5.4 Age effects of task duration and performance... 276
5.5.4.1 Exploratory data analysis ... 277
5.5.4.1.1 Task duration... 277
5.5.4.1.2 Task performance ... 279
5.5.4.2 Inferential statistics... 280
5.5.4.2.1 Task duration... 280
5.5.4.2.2 RTP task performance during single task (ST) and dual task (DT) conditions... 282
5.5.4.2.3 Head turn task performance ... 286
5.5.4.2.4 3s performance during ST and DT conditions ... 289
Chapter 6:
Discussion... 292
6.1 Normal undistracted walking... 292
6.1.1 MTC Central Tendency (intention of the locomotor system) ... 292
6.1.2 Variability/Dispersion (extent of control exhibited by the locomotor system) ... 297
6.1.2.1 Intra-individual variability in MTC as measured by SD, IQR and CV' ... 298
6.1.2.2 Variability and dispersion of MTC as measured by the spread of MTC in the distribution... 305
6.1.3 Symmetry/Distribution... 310
6.1.4 Probability of tripping ... 321
6.1.5 Walking velocity ... 331
6.2 Distraction tasks ... 334
6.2.1 General observations ... 336
6.2.2 Prolonged Distractions ... 352
6.2.2.1 Video task... 352
6.2.2.2 3s task ... 356
6.2.3 Intermittent/short distractions ... 360
6.2.3.1 Head turn task... 360
6.2.3.2 Pouch task... 365
6.2.3.3 Cough task ... 367
6.2.3.4 RTP task ... 370
6.2.3.5 Type of distractions most likely to result in tripping and comparison of prolonged and short distractions... 374
6.3 Methodological issues and practical applications ... 377
6.3.1 Tripping prevention strategies... 377
6.3.2 Calculating normal, comfortable overground walking velocity... 379
6.3.3 Generalising results from treadmill walking... 380
6.3.4 Data Normalisation ... 381
6.3.5 Dual-task methodology ... 387
6.3.6 Limitations of the study... 388
Chapter 7:
Conclusion ... 390
List of Appendices
Appendix A - Initial information pack mailed to subjects, including
information pack for General Practitioner ... 415
Appendix B - Informed Consent form ... 422
Appendix C - Folstein Mini Mental State Examination (MMSE)for evaluating cognitive state ... 425
Appendix D - Modified Falls Efficacy Scale (MFES) for evaluating level of fear of falling ... 428
Appendix E - Abstract array of shapes used during the head turn task ... 430
Appendix F - Qbasic program used to determine MTC... 432
Appendix G - Table of individual subject characteristics ... 438
List of Tables
Table 2.1: Components of the Multiple Tasks Test (MTT), Bloem et al. (2001)... 58
Table 2.2: Range of MTC descriptive statistics in different time intervals, n = 3318 continuous strides for one healthy young female (adapted from James, 1999). ... 100
Table 2.3: Probabilities of tripping. ... 115
Table 4.1: Basic inclusion and exclusion criteria for elderly subjects. ... 130
Table 4.2: Screening tests conducted on elderly subjects. ... 131
Table 4.3: Descriptive statistics of MTC distribution examined. ... 180
Table 4.4: Group median number of strides for normal undistracted and distracted walking conditions for young and elderly groups... 182
Table 4.5: Group mean number of strides included in the lowest 5% of each distribution... 183
Table 4.6: Number of strides analysed during various MTC studies of unobstructed and obstructed gait. ... 184
Table 5.1: Comparison of subject characteristics... 205
Table 5.2 : Screening tests for elderly group (n=18)... 206
Table 5.3: Waking speed variables. ... 207
Table 5.4: Comparison of young and elderly walking speed characteristics. ... 209
Table 5.5: Descriptive statistics for the young group (n = 18) during normal, undistracted walking... 212
Table 5.6: Descriptive statistics for the elderly group (n = 18) during normal, undistracted walking... 213
Table 5.8: Individual MTC distribution variability measures... 216
Table 5.9: Individual MTC distribution dispersion measures... 217
Table 5.10: Individual MTC symmetry/distribution measures. ... 218
Table 5.11: Comparison of young and elderly MTC central tendencies via one-way ANOVA. ... 223
Table 5.12: Levene's test of homogeneity of variances (between age groups) for central tendency measures of normal, undistracted walking MTC... 223
Table 5.13: Comparison of MTC intra-individual variability measures between young and elderly groups via Mann-Whitney U test... 226
Table 5.14: Comparison of young and elderly MTC dispersion measures... 228
Table 5.15: Comparison of young and elderly MTC symmetry/distribution measures. ... 229
Table 5.16: Young group correlation matrix of descriptive statistics - Pearson’s r-value and p-value (in brackets) is shown. ... 232
Table 5.17: Elderly group correlation matrix of descriptive statistics - Pearson’s r-value and p-value (in brackets) is shown. ... 232
Table 5.18: Probability of tripping (PT) using group median at selected obstacle heights (MTC) that occur at the point of MTC. ... 237
Table 5.19: PT frequencies using group median at selected obstacle heights (MTC) that occur at the point of MTC. ... 238
Table 5.20: Distraction tasks performed concurrently with treadmill walking... 239
Table 5.21: Comparison of stride numbers during each walking condition. ... 241
Table 5.23: Comparison of descriptive statistics for MTC(norm) and each
MTC(distr) data set combined with MTC(norm) for typical elderly
subject (e1)... 246
Table 5.24: Descriptive statistics of medianMTC for the young group (n = 18)
for each normal and distracted walking condition... 248
Table 5.25: Descriptive statistics of medianMTC for the elderly group (n = 18)
for each normal and distracted walking condition... 248
Table 5.26: Individual medianMTC for all walking conditions. ... 250
Table 5.27: Descriptive statistics for MTC Z’(distr) score of each distraction for
young group (n = 18) for each distraction task... 251
Table 5.28: Descriptive statistics for MTC Z' (distr) score of each distraction) for
elderly group (n = 18) for each distraction task... 251
Table 5.29: Individual Z'(distr) score for each distraction. ... 252
Table 5.30: Comparison of medianMTC of walking conditions. ... 254
Table 5.31: Test of between-subject effects using medianMTC (via two-way
ANOVA)... 255
Table 5.32: Post-hoc comparisons using Tukey’s HSD for medianMTC(norm) (via
two-way ANOVA)... 255
Table 5.33: Test of homogeneity of variances using Levene's statistic for
young and elderly one-way ANOVAs... 256
Table 5.34: Between groups results of one-way ANOVAs comparing
medianMTC... 256
Table 5.35: Post-hoc comparisons with medianMTC(norm) using Tukey’s HSD via
Table 5.36: Comparison of deviation (Z'(distr) score) of each medianMTC(distr)
relative to medianMTC(norm) using one-way ANOVA. ... 258
Table 5.37: Test of between-subject effects via two-way ANOVA. ... 259
Table 5.38: Chi-square test of frequencies of level of effect of distractions... 260
Table 5.39: Descriptive statistics for the young group (n = 18) for PC5MTC for
three walking conditions. Tests of normality: Shapiro-Wilks
(S-W). ... 263
Table 5.40: Descriptive statistics for the elderly group (n = 18) for PC5MTC for
three walking conditions. Tests of normality: Shapiro-Wilks
(S-W). * (p<.05) denotes non-normal distribution... 263
Table 5.41: Individual PC5MTC for norm, video and 3s conditions... 264
Table 5.42: Descriptive statistics for the young group (n = 18) for minMTC for
all walking conditions (undistracted and distracted). * (p<.05)
denotes non-normal distribution. Tests of normality:
Shapiro-Wilks (S-W)... 265
Table 5.43: Descriptive statistics for the elderly group (n = 18) for minMTC for
all walking conditions (undistracted and distracted). Tests of
normality: Shapiro-Wilks (S-W). * (p<.05) denotes non-normal
distribution... 265
Table 5.44: Individual minMTC for undistracted and all distracted walking
conditions... 266
Table 5.45: Comparison of PC5MTC measures between young and elderly via
one-way ANOVA. ... 268
Table 5.47: Comparison of minMTC between young and elderly via independent
t-test and Mann-Whitney U test... 269
Table 5.48: Comparison of minMTC across walking conditions for young and
elderly groups. ... 270
Table 5.49: Descriptive statistics for young group (n = 18) variability as
measured by IQRMTC for each walking condition. ... 271
Table 5.50: Descriptive statistics for elderly group (n = 18) variability as
measured by IQRMTC for each walking condition. ... 271
Table 5.51: Individual variability measure (IQRMTC ) for each walking
condition. ... 272
Table 5.52: Comparison of variability as measured by IQRMTC for each
walking condition (via Mann-Whitney U tests). ... 274
Table 5.53: Kruskal-Wallis test on age for IQRMTC... 274
Table 5.54: Kruskal-Wallis test on walking condition for IQRMTC. ... 275
Table 5.55: Multiple comparisons of IQRMTC(norm) with IQRMTC for all
distractions using non-parametric Mann-Whitney U test for
IQRMTC... 275
Table 5.56: Descriptive statistics for elderly group (n = 18) for distraction task
duration (s). Tests of normality: Shapiro-Wilks (S-W). *(p<.05)
denotes non-normal distribution. ... 277
Table 5.57: Descriptive statistics for elderly group (n = 18) for distraction task
duration (s). Tests of normality: Shapiro-Wilks (S-W). * (p<.05)
denotes non-normal distribution. ... 277
Table 5.59: Descriptive statistics for selected measures of task performance in
head turn, 3s and RTP tasks for the young group (n = 18)... 279 Table 5.60: Descriptive statistics of selected measures of task performance in
head turn, 3s and RTP tasks for the elderly group (n = 18)... 280 Table 5.61: Comparison of time taken to complete each distraction task... 282
Table 5.62: Group comparison (parameter estimates) for reaction time during
the ST and DT condition for RTP task. ... 283
Table 5.63: Levene's test of equality of error variances (between age groups) in
ST and DT reaction time... 284
Table 5.64: Test of Within-Subjects effects... 284
Table 5.65: Test of between-subjects effects for reaction time... 284
Table 5.66: Pairwise comparisons of single- and dual-task conditions for young
and elderly groups... 285
Table 5.67: Individual reaction times(RT) for ST and DT conditions... 285
Table 5.68: Comparison of accuracy and duration of head turn task. ... 287
Table 5.69: Correlations for accuracy and duration of head turn task using
non-parametric Spearman’s rho. ... 287
Table 5.70: Individual accuracy and duration results for head turn task... 288
Table 5.71: Comparison of ST and DT performance on the 3s task... 290
Table 5.72: Comparison of performance during ST and DT condition during 3s
task... 290
Table 5.73: Individual ST and DT performance during the 3s task... 291
Table 6.1: Comparison of e24 variables with all data and some extremes
Table 6.2: Individual frequencies of tripping at MTC(y) = individual
medianMTC... 327
Table 6.3: PTMTC and Frequency of tripping at various obstacle
heights/MTC(y) for young subject y7, elderly subject e5, young
group and elderly group median. ... 329
Table 6.4: Calculation of MTC timing for each stride (MTCtime) and mean
MTCtime for the four strides (MTCtime(mean))... 383
List of Figures
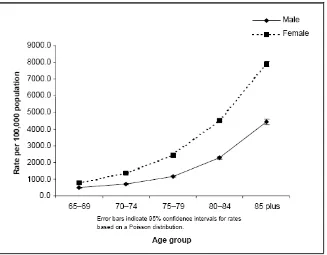
Figure 2.1: Age-specific rates of hospitalisation due to accidental falls in
people aged 65 years and above (Taken from Cripps and Carman
(2001), p.2). ... 34
Figure 2.2: Death rates due to unintentional fall injury by age... 35
Figure 2.3: Deaths from accidental falls in people aged 65 years and above by
age and gender (adapted from data reported by Cripps and
Carman (2001), p. 27)... 36
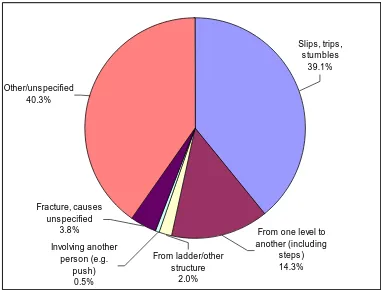
Figure 2.4: External causes of hospitalisation due to falls in the elderly
(adapted from data reported by Cripps and Carman (2001))... 41
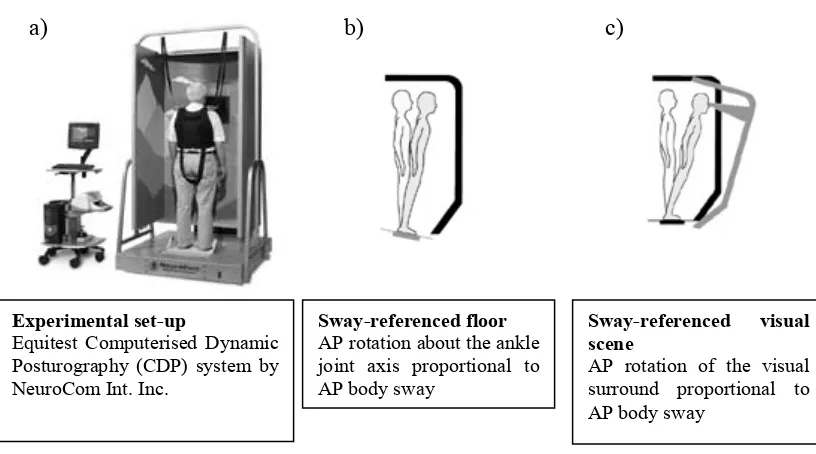
Figure 2.5: Experimental set-up as used by Redfern et al. (2001)... 53
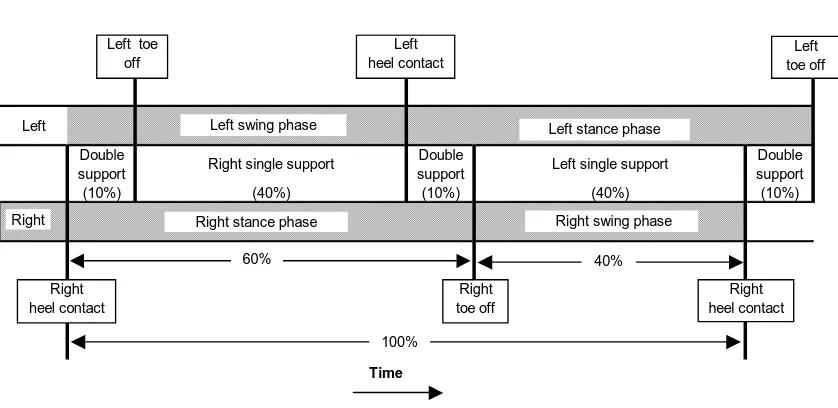
Figure 2.6: Positions of the legs during a single gait cycle from right heel
contact to right heel contact (adapted from Whittle, 1993). ... 75
Figure 2.7: Contribution of the right and left legs to one gait cycle ... 75
Figure 2.8: Traditional 2-dimensional method of calculating MTC. ... 79
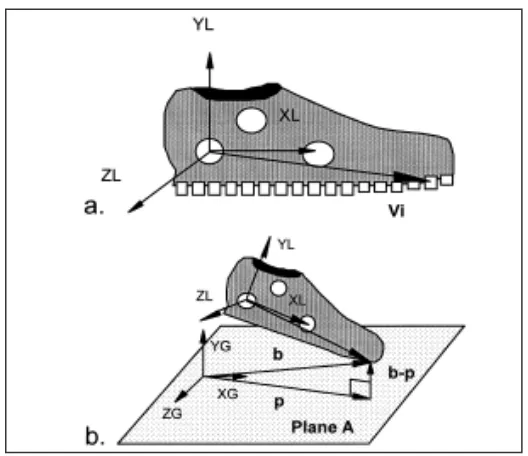
Figure 2.9: Schematic of the method of determining MTC used by Startzell and
Cavanagh (1999). a. the locations of virtual markers on the
outsole of the shoe, Vi, were defined in local coordinates during
calibration; b. the minimum clearance between the plane A and
all virtual points was calculated and the overall minimum
clearance, [(b – p)], was determined. (taken from Startzell and
Cavanagh, 1999, p. 607). ... 80
Figure 2.10: Schematic of the method proposed by Best et al. (1999). ... 81
Figure 2.12: Displacement and Velocity of the Toe During One Stride using
ensemble averages ... 84
Figure 2.13: Stability of descriptive statistics. ... 98
Figure 2.14: Comparison of median, minimum and maximum descriptive
statistic values (mean, SD, skew and kurtosis) for various
time/stride intervals (adapted from James, 1999)... 101
Figure 2.15: Probability of tripping plot of graph PTMTC vs. obstacle height (y):
a) varying from 0 to 6cm; b) y varying from 0 to 1.5cm... 116
Figure 2.16: Graph of PTUNSEEN vs tnormalised for various obstacle heights (y)... 120
Figure 4.1: The Melbourne Edge Test (MET) by Verbaken and Johnston
(1986)... 138
Figure 4.2: Verification of camera placement perpendicular to plane of motion
in the horizontal plane. ... 143
Figure 4.3: Verification of camera placement perpendicular to plane of motion
in the vertical plane. y1 = vertical displacement between ground
and approximate location of MTC; y2 = vertical displacement
between ground and optical axis of the camera lens. ... 144
Figure 4.4: Experimental set-up. TCG = Time Code Generator; ESU = Event
Synchronisation Unit; Tester ‘slave’ monitor used to display exact
picture displayed on subject monitor... 145
Figure 4.5: Placement of LED markers on the right foot... 151
Figure 4.6: Monitor depicting TCG generated time-code and ESU generated
white square. Both were used to determine timing and duration of
distraction tasks. ... 154
Figure 4.8: Set up of ‘head turn’ task. ... 160
Figure 4.9: Example of three possible estimates of manually digitised PTP... 168
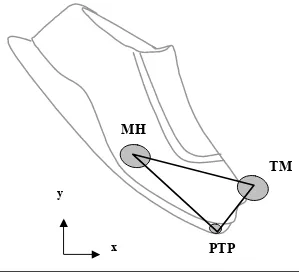
Figure 4.10: 2D geometric model of the foot... 169
Figure 4.11: Determination of MTC via Qbasic program... 172
Figure 4.12: Vertical displacement of TM and PTP markers. ... 174
Figure 4.13: Example of verification of MTC points... 175
Figure 4.14: MTC distribution for one typical elderly subject (e14) showing
minMTC, maxMTC, Q1MTC Q3MTC, rangeMTC, LQRMTC, UQRMTC and
IQRMTC... 181
Figure 4.15: MTC distribution for one elderly subject (e14) showing PC1MTC,
PC5MTC, PC95MTC, PC99MTC, 98% rgeMTC and 90% rgeMTC. ... 181
Figure 4.16: A sample distribution with skew to the right (positive skew).
Actual skew value was 0.571... 186
Figure 4.17: (a) Mesokuritc (bell-shaped, Normal or Gaussian), (b) platykurtic,
and (c) leptokurtic curves (adapted from Vincent, 1999)... 187
Figure 4.18: Example of non-normal distributions and their associated β values ... 189
Figure 4.19: Example of normal and non-normal Q-Q plot... 194
Figure 4.20: Box plot of medianMTC for young and elderly groups. ... 196
Figure 5.1: Comparison of group median walking speeds for young and
elderly. ... 207
Figure 5.2: Number of strides completed in the 20-minute normal undistracted
walking period as a function of walking speed (m/s). ... 208
Figure 5.3: Histograms of combined young and combined elderly group MTC
distributions. ... 221
Figure 5.5: Comparison of group SDMTC and IQRMTC... 224
Figure 5.6: Comparison of group CV'... 225
Figure 5.7: Comparison of group rangeMTC, UQRMTC, LQRMTC, 98% rgeMTC
and 90% rgeMTC. ... 225
Figure 5.8: Comparison of group MTC dispersion measures. ... 227
Figure 5.9: Comparison of group MTC symmetry/distribution measures. ... 229
Figure 5.10: Comparison of major group MTC distribution descriptive
statistics correlations using Pearson’s r. ... 231
Figure 5.11: PT profile for young subjects. ... 235
Figure 5.12: PT profile for elderly subjects. ... 235
Figure 5.13: Stability of medianMTC for one elderly subject (e1) for entire
MTC(norm) data set with MTC(distr) for each distraction inserted in
the middle. ... 242
Figure 5.14: Time series of medianMTC values during normal and each
distraction condition for one typical elderly subject (e1). Data
shown from stride 225. Stride numbers shown on x axis should
add 225 in order to obtain correct stride number... 243
Figure 5.15: Time series of IQRMTC values during normal and each distraction
condition for one typical elderly subject (e1). Data shown from
stride 225. Stride numbers shown on x axis should add 225 in
order to obtain correct stride number... 244
Figure 5.16: Time series for SMTC during normal and each distraction condition
for one typical elderly subject (e1). Data shown from stride 225.
Stride numbers shown on x axis should add 225 in order to obtain
Figure 5.17: Time series for KMTC during normal and each distraction condition
for one typical elderly subject (e1). Data shown from stride 225.
Stride numbers shown on x axis should add 225 in order to obtain
correct stride number. ... 245
Figure 5.18: Comparison of group medianMTC for each walking condition using
median and IQR (error bars)... 253
Figure 5.19: Comparison of group Z'(distr) score (Z' score of medianMTC(distr)
relative to medianMTC(norm)) using group median and IQR (error
bars). ... 257
Figure 5.20: Frequencies of level of effect of distractions via Chi-square test... 260
Figure 5.21: Comparison of group PC5MTC using median values and IQR (error
bars). ... 267
Figure 5.22: Comparison of group minMTC during undistracted and distracted
walking conditions using median values and IQR (error bars). ... 269
Figure 5.23: Group IQRMTC for each walking condition using median and IQR
(error bars). ... 273
Figure 5.24: Group comparison of distraction task durations using median and
IQR (error bars). ... 281
Figure 5.25: Group comparison of reaction times during ST and DT conditions
for RTP task using median and IQR. ... 283
Figure 5.26: Group comparison of head turn accuracy and duration. ... 286
Figure 5.27: Group comparison of 3s task performance during ST and DT
conditions (number of subtractions performed and subtraction
accuracy)... 289
Figure 6.2: Positively skewed distribution... 294
Figure 6.3: Extract of four strides for subject y7, showing large maxMTC. ... 300
Figure 6.4: Comparison of young group IQRMTC descriptive statistics for all (n
= 18) and with extreme y7 removed (n=17). ... 301
Figure 6.5: Relative walking speed (RWS) as a function of IQRMTC. ... 304
Figure 6.6: Comparison of various MTC variability/dispersion measures using
group median values of each measure. ... 305
Figure 6.7: Comparison of dispersion variables of the lower and upper portions
of the MTC distribution. ... 307
Figure 6.8: Positively skewed distribution... 310
Figure 6.9: Comparison of group median SMTC and KMTC with elderly e24
extreme modified and deleted from elderly group. ... 313
Figure 6.10: Selected MTC histograms for elderly subjects; a) shows a
histogram with near normal skew and kurtosis; b) shows a
histogram with a high skew and kurtosis; c) shows a histogram of
a ‘typical’ elderly subject with respect to skew and kurtosis.
Corresponding descriptive statistics for each chart can be found in
the accompanying table. ... 316
Figure 6.11: Relationship of KMTC as a function of SMTC and comparison of
three different distributions... 318
Figure 6.12: Mean and median PTMTC... 321
Figure 6.13: Median, minimum (min) and maximum (max) PTMTC(y) for
young and elderly. y=young group; e = elderly group. ... 322
Figure 6.14: PTMTC vs obstacle height / MTC(y) for young group... 325
Figure 6.16: MTC(y) at values of PTMTC = 0.1, 0.5 and 0.9. ... 328
Figure 6.17: MedianMTC for undistracted and distracted walking conditions for
young and elderly. ... 336
Figure 6.18: Group median percentage change from medianMTC(norm) in
response to each distraction. ... 337
Figure 6.19: Absolute percentage change from medianMTC(norm) for each
distraction. ... 339
Figure 6.20: Percentage deviation from normal undistracted walking for each
subject for each distraction. ... 340
Figure 6.21: Comparison of median MTC, minMTC and PC5MTC for normal
undistracted, video and 3s walking conditions. ... 346
Figure 6.22: Individual PC5MTC for normal undistracted walking, video and 3s
tasks for elderly subjects... 348
Figure 6.23: Individual PC5MTC for normal undistracted walking, video and 3s
tasks for young subjects... 348
Figure 6.24: Intra-individual variability (IQRMTC) between walking conditions
for elderly subjects... 350
Figure 6.25: Individual minMTC for all subjects by walking condition. ... 351
Figure 6.26: Example of four strides showing toe-off (TO) and accurate MTC
events for one young subject (y14)... 382
Figure 6.27: Example of calculation of MTC(normalised) timing (i.e. frame
number) for one subject with no identifiable MTC (elderly subject
List of Equations
Equation 2.3.1 ... 113
Equation 2.3.2 ... 117
Equation 2.3.3 ... 118
Equation 2.3.4 ... 119
Equation 2.3.5 ... 119
Equation 2.3.6 ... 122
Equation 4.4.1 ... 169
Equation 4.4.2 ... 169
Equation 4.4.3 ... 169
Equation 4.4.4 ... 170
Equation 4.4.5 ... 170
Equation 4.4.6 ... 170
Equation 4.4.7 ... 171
Equation 4.4.8 ... 171
Equation 4.4.9 ... 171
Equation 4.5.1 ... 188
Equation 4.5.2 ... 189
Equation 4.5.3 ... 191
Equation 4.5.4 ... 191
Equation 4.5.5 ... 191
Equation 5.5.1 ... 240
List of Abbreviations
ABS Australian Bureau of Statistics
ADL Activity of daily living
AGS American Geriatrics Society
AIHW Australian Institute of Health and Welfare
AP Anterio-posterior
BBS Berg balance scale
COM Centre of mass
COP Centre of pressure
CPD Computerised dynamic posturography
DT Dual task
ESU Event synchronisation unit
IQR Interquartile range
IRT Inhibition reaction time task
JOLO Judgement of Line Orientation
K Kurtosis
LED Light emitting diode
MFC Minimum foot clearance
MTC Minimum toe clearance
MTT Multiple Tasks Test
NIPAC National Injury Prevention Advisory Council
RTP Reaction time probe
S Skew
SRT Simple reaction time task
ST Single task
TCG Time code generator
Chapter 1:
Introduction
Falls in elderly adults constitute a serious public health problem. Approximately one
third of community-dwelling elderly adults aged 65 years and over, and approximately
half of those aged 80 years and over, will fall at least once a year (Kreisfeld et al.,
2004; Cripps and Carman, 2001; Dolinis et al., 1997; Winter, 1995; Lord et al., 1993).
This high falls incidence is associated with elevated morbidity and mortality rates, and
other human and economic costs. Elderly individuals, aged 65 years and over,
represent a large and increasing proportion of Australia’s population (ABS, 2005). The
increase in the proportion of elderly, coupled with the high rate of falls in this group,
requires urgent and effective intervention. This can be achieved by identifying risk
factors contributing to falls, then identifying and predicting individuals at risk and
finally, implementing preventative strategies.
The aetiology of falls includes a multiplicity of factors. The falls risk increases with
the number of risk factors present. These risk factors have broadly been categorized as
intrinsic or pathological (i.e. decline or deficiency pertaining to the individual) and
extrinsic or environmental (i.e. pertaining to factors in the environment largely
uncontrolled by the individual). Strong evidence has been accumulated for intrinsic
risk factors predisposing to falls (e.g. Lord et al., 2002b; NIPAC, 1999a; 1999b;
Owings et al., 1999; Snow, 1999; Kerrigan et al., 1998; Maki, 1997; O'Loughlin et al.,
1993; Whittle, 1993; Campbell et al., 1989; Blake et al., 1988; Tinetti et al., 1988;
Prudham and Evans, 1981). The evidence for extrinsic factors predisposing individuals
that have explored these factors (Lord et al., 2002b; Hill et al., 1999; NIPAC, 1999a).
In most instances of falls it is recognized that intrinsic and extrinsic factors interact to
varying degrees (Tinetti and Speechley, 1989). Irrespective of the precise combination
of risk factors, it has been found that tripping is responsible for more than one third of
falls during locomotion (Kreisfeld et al., 2004; Cripps and Carman, 2001; Hill et al.,
1999; Sattin et al., 1998; Lord et al., 1993; Campbell et al., 1990; Tinetti and
Speechley, 1989; Overstall et al., 1977).
The injury rates due to falls increases with the number of co-morbid diseases
diagnosed, coupled with age-related decline. Falls related injury and death rates,
however, are not limited to frail elderly (AGS, 2001). It has been found that even in
apparently healthy elderly, falls can result in significant injury from which full recovery
does not eventuate, and can ultimately result in death (Prince et al., 1997; Harper and
Lyles, 1988; Oreskovich et al., 1984). Older adults with one or more identified risk
factors are clearly at risk of falls and are subsequently targeted for intervention
programs. As Hill et al. (1999) highlights, healthy older adults without any obvious
balance impairments or other risk factors can still fall. Given the high injury and death
rates, it is critical to prevent the first fall since it is possible one fall can result in serious
injury or even death in a previously healthy older individual (Hill et al., 1999).
The challenge for researchers is to prevent falls in healthy older adults with no obvious
balance impairment or other obvious risk factors. Indeed, the AGS guidelines (2001)
highlight the need to direct prevention programs toward healthy older adults. Current
research includes many studies on falls prevention but a paucity of studies on falls
complex nature of falls aetiology. There is currently no quantitative measure for the
probability of an individual tripping on unseen obstacles while walking. If an obstacle
is seen, alterations to the gait pattern will be initiated to prevent a trip. When an
obstacle is not seen, however, the likelihood of tripping on the obstacle increases.
Given the high contribution of tripping to falls rates, and that tripping frequency is a
strong predictor of falls (Pavol et al., 1999), a method of predicting probability of
tripping would be very useful for a falls prevention program.
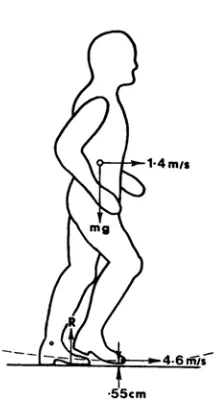
Although all individuals, young and old, have the propensity to trip from time to time,
the consequences of trip induced falls are clearly more serious for older adults. During
locomotion, foot clearance plays a critical role in the successful negotiation of obstacles
and uneven ground. Foot clearance is typically quantified as minimum toe clearance
(MTC). During normal unobstructed gait, MTC is typically reported to be
approximately 1.3 cm (Winter, 1991). This small MTC and variability in MTC has the
potential of causing irregular tripping, where typically the lead foot contacts the ground
or unseen object.
Although seldom performed, most gait analysis in the area of falls due to tripping
focuses on MTC during the swing phase of either unobstructed or obstructed walking
(e.g. Patla and Rietdyk, 1993; Winter, 1991a). These studies have generally defined
MTC as the distance between the ground and the toe marker during midswing. More
recently, however, alternative methods of estimating MTC have been employed, such
as utilising a virtual point on the inferior most distal portion on the sole of the shoe
give a more accurate representation of MTC during gait by accounting for the influence
of footwear on foot clearance.
Gait analysis studies typically report mean values as an average representation, or
central tendency measure, of selected parameters for a group or individual. Similarly,
standard deviation is typically reported as a measure of variability for a group or
individual (e.g. Winter, 1991a). It has never been shown that MTC data is normally
distributed and, therefore, if mean and standard deviation calculations (or statistics) are
an appropriate representation of central tendency and variability.
The type of descriptive measures employed and the size of the data sets examined are
important methodological factors to consider when obtaining an accurate analysis of
gait. In gait analysis studies, generally only a limited number of trials are used per
individual, with the assumption that these trials form a normal distribution and
represent typical gait characteristics. Intra-subject variability in gait patterns can vary
greatly with fluctuations being higher for trials collected days apart compared with
minutes apart (Winter, 1991a). It is important to determine how many trials are
required to obtain a stabilised gait parameter for an individual to further ensure the
reliability of the data used for analysis and when drawing statistical conclusions (Best
et al., 2000). Collecting a large number of consecutive strides allows a more comprehensive examination of the intent and accuracy of the locomotor system in
implementing the critical event of MTC over a longer, more realistic walking time.
Older adults typically undergo some age-related decline in cognitive and perceptual
attention between multiple concurrent tasks. There is now sufficient evidence to
suggest that elderly individuals have more difficulty dividing attention between
multiple tasks compared with younger individuals (e.g. Sparrow et al., 2002b; Brown et
al., 1999; Hartley and Little, 1999; Chen et al., 1996; Lajoie et al., 1996; Ponds et al., 1988; McDowd, 1986). Moreover, this decreased ability to divide attention has been
linked to a reduced ability to maintain postural control and an increased risk of falling
(e.g. Woollacott and Shumway-Cook, 2002; Campbell et al., 1989; Stelmach and
Worringham, 1985).
Most studies examining postural control under divided attention conditions have
concentrated on a static standing position (e.g. Redfern et al., 2001; Marsh and Geel,
2000; Shumway-Cook and Woollacott, 2000) but some have attempted to relate
divided attention ability to dynamic stability, such as during walking (e.g. Sparrow et
al., 2006; Sparrow et al., 2002a; Lundin-Olsson et al., 1998; Chen et al., 1996). Moreover, it has been observed that the elderly are more affected than the young by
divided attention positions and that postural control was more affected in situations of
reduced sensory input and particularly conditions of conflicting sensory information
(e.g. Pellecchia, 2003; Redfern et al., 2001; Marsh and Geel, 2000; Shumway-Cook
and Woollacott, 2000). These studies are particularly useful since many everyday
situations involve either conflicting or reduced sensory information. For example,
turning the head to scan for cars whilst crossing the road. Despite recognising impaired
divided attention ability as a falls risk factor in the elderly, there are to date no studies
examining the types of distractions most likely to induce a trip. Moreover, there is an
In summary, falls in the elderly is a serious public health problem, which involves
enormous physical, psychological and economic costs to the individual and the
community. Tripping is a frequent cause of falls the declined ability to attend to more
than one task might increase the risk of tripping and falling whilst walking. With the
ageing of the population, the implementation of effective preventative strategies is
vital. This research will contribute to the area of falls prevention by:
1. Exploring age-related biomechanical differences in MTC during treadmill
walking in healthy female subjects.
2. Examining MTC during longer walking trials (i.e. approximately 1,000 strides
over a 20 minute period) to enable a more comprehensive understanding of gait
control and function.
3. Presenting a quantitative method of predicting the probability of tripping on
unseen obstacles while walking.
4. Examining divided attention ability during treadmill walking using a number of
short and prolonged ‘distraction’ tasks, which can be related to normal,
everyday experiences. Changes to MTC during these distracted periods are
examined in an effort to determine age-effects and the type of distraction most
Chapter 2:
Literature review
This chapter reviews the scientific literature pertaining to the topic being investigated
in three major sections:
1. falling behaviour (incidence, aetiology, prevention and prediction);
2. biomechanics of normal gait; and
3. tripping and obstacle avoidance research.
Sub-sections with detailed examination of literature relating to pertinent areas of this
research, including control of balance during gait, divided attention and methodological
issues important for this research, are also included. Each section concludes with a
summary and critical assessment of the current literature. Areas not thoroughly
researched are identified and, therefore, support the need for this research.
2.1
Falling behaviour in elderly populations
2.1.1 Falls incidence and outcomes
Falls in elderly populations are a serious concern due to its high incidence, associated
mortality and other human and economic costs. Australian studies involving
community-dwelling elderly adults have shown that approximately 30% of people aged
65 years or more, and approximately half of those aged 80 years or more, sustain a fall
1997; Lord et al., 1993). Moreover, a study by Hill et al. (1999) identified similar fall
rates (i.e. approximately 50%) in subjects aged 70 years or more. Many further studies
use retrospective reporting of falls (e.g. Dolinis et al., 1997; Lord et al., 1993) which
could underestimate true falls rates by 15 to 20% (Tinetti et al., 1988).
Although the high falls incidence is a major concern, the greater susceptibility to
serious injury in the elderly further increases the seriousness of the situation. The most
recent Australian Government report on falls in Australian elderly individuals for the
Australian Institute of Health and Welfare (AIHW) (Cripps and Carman, 2001) states
that hospitalisation due to falls (n = 45,069 or 1,995 per 100,000 population) accounts
for approximately 54% of all hospitalisations (n = 82,724) for the elderly aged 65 to 85
years. The report by Cripps and Carman (2001) examines and summarises hospital
records reporting injuries and deaths in the elderly due to falls during 1998. The report
provides a particularly useful graphical representation of hospitalisation rates due to
falls by age and gender (refer Figure 2.1). It can be seen in Figure 2.1 that fall rates
increase exponentially for both males and females, with an approximately 9-fold
increase between 65 years and 85 years and over. Figure 2.1 also shows that
hospitalisation rates are significantly greater in older females compared with males and
this gender difference increases with advancing age (Cripps and Carman, 2001; Dolinis
et al., 1997). Additionally, elderly females are more likely to sustain fall-related injuries than males. For example, Cripps and Carman (2001) found females were 2.8
times more likely to sustain a fracture due to falls compared with males (105.0 v. 37.6
per 100,000 population) while Fildes (1994) reported a likelihood of sustaining a
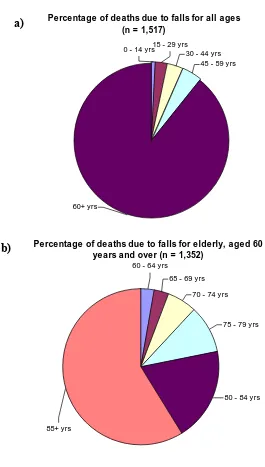
Figure 2.2 displays data by the Australian Government AIHW report on hospital
records of injury deaths in Australia during 2002 (Kreisfeld et al., 2004). As seen in
Figure 2.2, accompanied by high fall-related morbidity is a high mortality rate due to
falls, which is clearly concentrated in the older age groups. Chart a) shows death rates
due to unintentional fall injury for all ages (n = 1,517) and it can be seen that the
elderly group aged 60 years and over comprise the majority of deaths (n = 1,352 or
89%). Chart b) focuses on the elderly group and shows greater detail by dividing the
elderly group into smaller intervals. It can clearly be seen that fall death rates due to
falls increase with age. Furthermore, deaths due to falls in the 85 years and over group
account for over half (~59%) the deaths in the elderly aged 60 years and over.
In the reported data for critical falls resulting in death in the elderly, females account
for approximately 61% of the cases while elderly males make up the remaining 39%.
For example, Cripps and Carman (2001) reported 1,014 deaths due to accidental falls in
people aged 65 years and above in 1998, with 61% being female (n = 617 or 48.1 per
100,00 population) and 39% being males (n = 397 or 39.7 per 100,000 population).
Figure 2.2: Death rates due to unintentional fall injury by age (from data reported by Kreisfeld et al. (2004)).
Percentage of deaths due to falls for all ages (n = 1,517)
60+ yrs
15 - 29 yrs
45 - 59 yrs 30 - 44 yrs 0 - 14 yrs
Percentage of deaths due to falls for elderly, aged 60 years and over (n = 1,352)
65 - 69 yrs
70 - 74 yrs 60 - 64 yrs
75 - 79 yrs
80 - 84 yrs
85+ yrs
a)
Similarly, the report by Kreisfled et al. (2004) for 2002 revealed of the 1,314
fall-related deaths in the elderly, 61% were females (n = 799) whilst 39% were males (n =
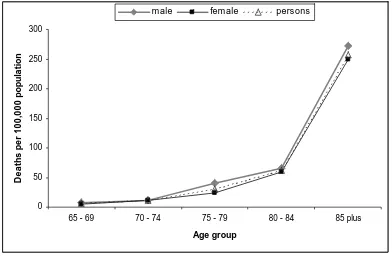
515). Figure 2.3 shows death rates from accidental falls in the elderly using 1998 data
reported by Cripps and Carman (2001). It can be seen that more than half of these
deaths (n = 576 or 256.8 per 100,000 of population) occur in the oldest old aged 85
years and over (approximately 270 per 1000,000 for males (n = 186 deaths) and 250
per 100,000 for females (n = 390 deaths) in the 85 years plus age group). These rates
are consistent with the Australian Government’s AIHW report on injury deaths in
Australia for 2002, which found falls death rates are concentrated in the older age
groups and are particularly high over 85 years (~300 deaths per 100,000 population) for
both males and females (Kreisfeld et al., 2004).
Figure 2.3: Deaths from accidental falls in people aged 65 years and above by age and gender (adapted from data reported by Cripps and Carman (2001), p. 27).
0 50 100 150 200 250 300
65 - 69 70 - 74 75 - 79 80 - 84 85 plus
Age group De at h s p e r 10 0, 00 0 p o p u la ti o n
As highlighted in the American Geriatrics Society (AGS) guideline for falls prevention
(AGS, 2001), the susceptibility to fall-related injury is related to high prevalence of
co-morbid diseases (e.g. osteoporosis) and age-related physiological decline (e.g. slower
reflexes). Even in apparently healthy elderly adults, a fall may result in serious
complications or death due to physiologic changes caused by the prolonged bed rest
required to manage an injury (AGS, 2001; Harper and Lyles, 1988). Almost 90% of
older persons admitted to hospital due to a fall will not return to their previous level of
independence (Oreskovich et al., 1984) and of those who sustain fractures to the hip,
50% are subsequently admitted to a long-term facility (Prince et al., 1997).
Falls in older adults frequently result in the development of a fear of further falls. This
‘fear of falling’, also called post-fall anxiety syndrome, has recently been recognised as
a serious consequence of falls and, therefore, it has been given more attention by
researchers (e.g. Herman et al., 2005; Jorstad et al., 2005; Cumming et al., 2000;
Salkeld et al., 2000; Hill et al., 1999). A fear of falling typically results in self-imposed
isolation due to a lack of confidence to ambulate safely, particularly outdoors. This
often leads to a need for additional help with activities of daily living or, ultimately, an
inability to live independently. The resulting loss of independence has a substantial
impact on quality of life in older persons (Salkeld et al., 2000).
In addition to the psycho-social cost of falls, the total financial cost in Australia, which
has been examined both in terms of the lifetime cost of the injury per year and total cost
to the health system per year, is estimated to be between $1 and $2 billion annually
These figures all show that the elderly are overrepresented in falls incidence rates, a
situation which is reported worldwide. Additionally, Australian Bureau of Statistics
(ABS, 2005) projections show that by 2051, the proportion of persons aged 65 years
and over in Australia could potentially reach 38%, almost treble the 13% proportion in
2004, and decrease slightly by 2101 to 31%. Moreover, according to these ABS
projections the proportion of the population in the 85 and older age group has the
potential to rise more than 5-fold to 8% by 2051 and more than 6-fold to 10% by 2101
compared with the 1.5% proportion in 2004. Given the high incidence of falls and the
associated morbidity, mortality and other costs, combined with the ageing of the
population, the incidence of falls in the elderly and the associated costs are expected to
rise unless effective preventative techniques are implemented. In a report to the
Commonwealth Department of Health and Ageing, Moller (2005) states that by 2051,
the total health cost attributable to fall related injury is expected to increase almost
three-fold to $1,375 million per annum. Additionally, there will be 886,000 additional
hospital bed days per annum and 3,320 nursing home places required unless effective
2.1.2 Falls risk factors
2.1.2.1 An overview of risk factors
Epidemiological studies have consistently stated that falling in older populations is a
multifactorial phenomenon. While there are many documented risk factors likely to
contribute to falling behaviour, they are often not universally demonstrated. Similarly,
the exact role of each risk factor, and their interaction, has not yet been determined
(NIPAC, 1999a). As with many geriatric syndromes, falls are most often due to an
accumulation of deficits in multiple areas rather than an isolated pathology (Tinetti et
al., 1996). Due to their multifactorial aetiology, there appears to be no uniform classification of falls. However, researchers have generally categorised falls into a)
intrinsic or pathological falls; and b) extrinsic, environment-related or accidental falls.
In most instances of falls, intrinsic and extrinsic factors interact to varying degrees
(Tinetti and Speechley, 1989).
There is some strong evidence for certain intrinsic risk factors predisposing an older
individual to falling behaviour. These risk factors include cognitive impairment
(including decreased ability to divide attention between more than one task), poor
balance and inability to correct for the unexpected loss of balance which may result
from any of/or some combination of decreased reaction time, diminished central
nervous integration, decreased muscular strength, impairments in visual, vestibular or
proprioceptive sense, loss of joint mobility, real or perceived reductions in limits of
stability, or capacity for sway without taking a step (Lord et al., 2002b; NIPAC, 1999a;
O'Loughlin et al., 1993; Whittle, 1993; Campbell et al., 1989; Blake et al., 1988;
Tinetti et al., 1988; Prudham and Evans, 1981). Chronic health conditions such as
stroke, Parkinson’s disease and arthritis, as well as acute health problems, such as
delirium or urinary tract infection for example, are recognized as important intrinsic
falls risk factors. In some cases, the presence of certain intrinsic factors results in the
use of prescription medication, some of which are also linked with falls incidence
(Lord et al., 2002b; NIPAC, 1999a; Whittle, 1993; Blake et al., 1988; Tinetti et al.,
1988). Moreover, the presence of intrinsic factors is often a predictor for recurrent falls
(Wolf and Gregor, 1999; Graafmans et al., 1996; Craik, 1989; Blake et al., 1988).
Whilst the evidence for extrinsic risk factors is not as strong, extrinsic risk factors
reported include environmental hazards such as uneven surfaces, poor lighting, poor
steps and stairway design and repair or other hazards around the home (including for
example, slippery floors, furniture, unsecured mats and rugs and lack of non-skid
surfaces in bathtubs and bathrooms), and self-imposed restriction due to a fear of
falling (Lord et al., 2002b; Hill et al., 1999; NIPAC, 1999a). There have been no
comprehensive, large-scale studies finding a significant and specific association
between home environment hazards and the risk of falling, and due to this, these factors
have been implicated mainly by self-report (NIPAC, 1999a; Campbell et al., 1990;
Tinetti et al., 1988). The presence of extrinsic factors creates the opportunity for a fall,
particularly for individuals already impaired by a combination of intrinsic factors.
Indeed, Lord et al. (2002b) highlight the fact that although some environmental factors
may not be directly related to a fall, they do have an influence on other important
intrinsic risk factors. For example, high-heeled shoes reduce balance and bifocal lenses
Since intrinsic falls-risk factors have been more closely related to falls, most prevention
programs have focused on reducing these factors. Despite intrinsic falls-risk factors
being described as more closely linked with falls, current Australian Institute of Health
and Welfare (AIHW) reports on falls in the elderly (Cripps and Carman, 2001) and
Australian injury and death rates (Cripps and Carman, 2001) show that external causes
were in fact cited as causes for approximately 54% of falls resulting in hospital
admissions. As shown in Figure 2.4, 39.1% of falls resulting from external causes were
associated with slips, trips and stumbles. However, these data are reported without
consideration of the interaction of any intrinsic factors contributing to a fall. As noted
by Braun (1998), the elderly typically place greater emphasis on external factors as the
cause of falls and neglect the contribution of intrinsic factors, particularly for
themselves. Although elderly might ascribe external factors as the cause of a fall, this
is often not the major cause once intrinsic factors are examined more closely.
From ladder/other structure
2.0% Involving another
person (e.g. pus h)
0.5% Fracture, causes
uns pecified 3.8% Other/unspecified
40.3%
From one level to another (including
steps ) 14.3%
Slips, trips , stumbles
The risk of falls increases with the number of risk factors present (Cwikel et al., 1998).
Since older people may experience deficits in multiple areas, compensatory
mechanisms may be hampered increasing the likelihood of falling in response to a
postural perturbation. For example, a failure in one system (e.g. instability) may
ordinarily be compensated for by another (e.g. visual feedback), which may also be
failing (Graafmans et al., 1996).
A person sustaining a fall often experiences anxieties or fears of a subsequent fall. This
often results in a reduction of activity and self-imposed isolation due to a fear of falling
whilst performing activities they had previously done safely before the fall (e.g. Hill et
al., 1999). This reduction in activity can result in a decline in muscular strength and general fitness, culminating in a downward spiral further predisposing the person to
falls. This ‘fear of falling’ or ‘post-fall anxiety syndrome’ has been linked to falling
behaviour (Lord et al., 2002b; Cumming et al., 2000; Hill et al., 1999; Maki, 1997).
2.1.2.2 The role of vision and other sensory control (vestibular and proprioceptive input) in balance and gait
Vision, together with other sensorimotor mechanisms (i.e. reaction time, neuromuscular
control, muscular strength, proprioception and vestibular sense), plays a vital role in the
regulation of safe walking over both even and uneven terrain. This section involves a
brief discussion of the role of vision in negotiating a safe walking terrain, followed by
visual input for maintaining balance. The other two sensory systems for the control of
are inextricably linked and each has an important role in providing a stable posture for
walking.
Vision as a means of seeing the travel path and hazards obstructing the path is the most
obvious role of vision. Visual function plays a vital role in the ability to see hazards
and, thus, proactively avoid a trip. Vision in this sense has often been termed
‘exteroceptive’, or providing information about the environment and external objects
(Lee and Lishman, 1977), and ‘exproprioceptive’, proprioceptive information picked
up in the external environment by the visual system (Anderson et al., 1998). As Patla
(1997) describes, vision provides almost simultaneous information about near and far
environment, which is used to regulate locomotion on a local level (step by step basis)
and a global level (route planning). Pavol et al. (1999) concluded in their study that
trip-related falls were predominately due to tripping frequency rather than a reduced
ability to recover. Vision therefore plays a vital role in the prevention of tripping
through the ability to see and proactively avoid physical hazards.
Degeneration in visual function has frequently been cited as a risk factor for falls and,
in particular, recurrent falls (Ivers et al., 1998; Klein et al., 1998; Lord et al., 1993;
Perry, 1982) and hip fracture (Ivers et al., 2000; Felson et al., 1989). These
degenerations typically include decline in visual acuity, contrast sensitivity, glare
sensitivity, dark adaptation and depth perception (Lord et al., 2002b). Degenerations in
visual function present in elderly adults may be the result of normal age-related
declines or certain diseases and conditions, such as diabetes and cataracts. Indeed, Jack
beneficial in the prevention of subsequent falls since some visual impairments are
reversible or correctable.
There are several dimensions of visual function, each of which plays an important role
and undergoes some age-related decline. It is not within the scope of this research to
discuss each aspect in detail, however, a brief description is included here since
declining visual function has been associated with an increased risk of falls and
researchers have therefore attempted to determine which aspects of visual function are
correlated with falling behaviour. Cross-sectional studies with retrospective reporting
of falls have identified visual acuity (clearness or sharpness of vision), reduced visual
field (particularly peripheral rather than central), impaired contrast sensitivity (the size
of detail and its contrast), impaired depth perception and the presence of cataracts as
risk factors for falls (Lord, 2006; Lord et al., 2002a; Lord et al., 2002b; Ivers et al.,
1998; Klein et al., 1998; Lord et al., 1993; Nevitt et al., 1989; Tinetti et al., 1988;
Owen, 1985; Marron and Bailey, 1982). The nature of falls is multifactorial and a
combination of intrinsic (i.e. impaired vision) and extrinsic (environmental) factors is a
better predictor of falls. Indeed, some investigations have found a stronger correlation
with falls when aspects of vision are combined with other risk factors such as
inactivity, subjective fall risk and other aspects of vision (e.g. Ivers et al., 1998; Kuyk
et al., 1998; Berg et al., 1997; Jack et al., 1995; Lord et al., 1993; Owen, 1985; Marron and Bailey, 1982).
Visual acuity, the most frequently examined aspect of vision in falls-related studies, is
typically used as an overall measurement of visual function. A lack of clear, sharp
peripheral visual field reduces the ability to detect hazards out of direct view (e.g.
moving object, such as a ball or animal, at ground (tripping) level approaching).
Impaired contrast sensitivity increases the difficulty in distinguishing borders of objects
in poor lighting conditions, detecting raised or uneven sections of footpath, and
observing the edges of tree roots or steps. Given that some aspects of vision have been
linked to an increased falls risk, vision tests (visual acuity and edge contrast sensitivity)
have been included in the screening for healthy elderly subjects for this research.
The second important task of vision is its central role in the control of balance and
posture and has been described as the most efficient source of proprioceptive
information for balance control (Lee and Lishman, 1977). As Winter (1995) describes,
human balance and posture is controlled by three major sensory systems: 1) visual
system for sensing position and location of the body in space; 2) vestibular system,
which Winter describes as a ‘gyro’ which senses movement and stabilises the body
with respect to gravity; and 3) the proprioceptive system which senses movement and
orientation of all body segments, and their contact with the ground and external objects.
The effectiveness of these three systems generally undergo decline with age (Lord et
al., 2002b).
Vision and head stabilisation plays a vital role during walking for providing a stable
reference to co-ordinate body motion (Mulavara et al., 2002). Menz et al. (2003)
concluded maintenance of head control, or minimising head movement, was one of the
primary objectives of the postural control system, and that the stepping pattern on
irregular surfaces may be altered to ensure the head remains stable. Indeed, Koceja et