Characterizing Embryonic Gene Expression
Patterns in the Mouse Using Nonredundant
Sequence-Based Selection
Rita Sousa-Nunes,
1,10Amer Ahmed Rana,
1,10,7Ross Kettleborough,
1,10Joshua M. Brickman,
1,8Melanie Clements,
1Alistair Forrest,
2Sean Grimmond,
2Philip Avner,
3James C. Smith,
4,11Sally L. Dunwoodie,
1,5,6,11and Rosa S.P. Beddington
1,91
Division of Mammalian Development, National Institute for Medical Research, The Ridgeway, London NW7 1AA, United
Kingdom;
2Institute of Molecular Bioscience, University of Queensland, 4072 Australia;
3Unite´ Ge´ne´tique Mole´culaire Murine,
Institut Pasteur, 75015 Paris, France;
4Wellcome Trust/Cancer Research UK Institute and Department of Zoology, University of
Cambridge, Cambridge CB2 1QR, United Kingdom;
5Developmental Biology Program, Victor Chang Cardiac Research Institute,
Darlinghurst, 2010, Australia;
6Department of Biotechnology and Biomolecular Sciences, University of New South Wales,
Kensington, NSW 2033, Australia
This article investigates the expression patterns of 160 genes that are expressed during early mouse development. The
cDNAs were isolated from 7.5 d postcoitum (dpc) endoderm, a region that comprises visceral endoderm (VE),
definitive endoderm, and the node–tissues that are required for the initial steps of axial specification and tissue
patterning in the mouse. To avoid examining the same gene more than once, and to exclude potentially ubiquitously
expressed housekeeping genes, cDNA sequence was derived from 1978 clones of the
Endoderm
library. These yielded
1440 distinct cDNAs, of which 123 proved to be novel in the mouse. In situ hybridization analysis was carried out on
160 of the cDNAs, and of these, 29 (18%) proved to have restricted expression patterns.
[Supplemental material is available online at www.genome.org.]
The genomic sequences of many animals are now known, includ-ing C. elegans, human, mouse, and Drosophila(The C. elegans genome consortium 1998; Adams et al. 2000; Lander et al. 2001; Venter et al. 2001; Aparicio et al. 2002; Carlton et al. 2002; Dehal et al. 2002; Gardner et al. 2002; Waterston et al. 2002), and the sequences of others will be available very soon. The task now facing biologists is to discover the functions of the genes that have been identified through these sequencing projects. For some organisms, such asC. elegans, it is possible to adopt a sys-tematic approach to ablating gene function (Fraser et al. 2000; Kamath et al. 2003). For vertebrates, and especially mammals, a systematic approach of this sort is a daunting prospect, but a widespread analysis of gene function is nevertheless essential for a proper understanding of development and disease.
The most tractable mammalian species for such an analysis is the mouse, in which it is possible to mutate gene function randomly, by using␥-irradiation, chemical mutagenesis or gene traps (Stanford et al. 2001), or a directed fashion by means of h o m o l o g o u s r e c o m b i n a t i o n i n e m b r y o n i c s t e m c e l l s (Doetschman et al. 1987; Thomas and Capecchi 1987). Mutagen-esis has proved a very useful approach, but it is limited in some
respects because redundancy or compensation may mask func-tional requirements and because early lethality may conceal later roles of some genes. The necessity to maintain large numbers of mutant strains also presents practical difficulties.
Homologous recombination overcomes these problems by allowing the ablation of specific genes at particular times in de-velopment and in a tissue-specific manner. It is not yet feasible, however, to contemplate targeting the entire proteome in this way, so it is necessary to decide which genes to target first. Work from several species indicates that one criterion might be based on gene expression patterns. In situ hybridization analyses of random clones from unmodified, normalized, or subtracted cDNA libraries has identified many genes with restricted expres-sion patterns that hint at particular embryonic functions (Gawa-ntka et al. 1998; Neidhardt et al. 2000; Christiansen et al. 2001; Kudoh et al. 2001). In addition, the results have allowed the definition of “synexpression groups,” the members of which are expressed in similar patterns and may be regulated in similar ways and act in the same molecular pathways (Gawantka et al. 1998; Niehrs and Pollet 1999).
In this article we refine this approach by using sequence comparisons to reduce cDNA library complexity and to remove unwanted molecules (see below). We use a cDNA library con-structed from 7.5 d postcoitum (dpc) endoderm (Harrison et al. 1995), a region that comprises VE, definitive endoderm, and the node–tissues that are required for the initial steps of axial speci-fication and tissue patterning in the mouse embryo (Beddington and Robertson 1999; Lu et al. 2001; Hamada et al. 2002). This Endodermlibrary, together with four others (wholeEmbryonic Re-gion,Ectoderm,Mesoderm, andPrimitive Streak), has already proved its worth in subtractive and differential hybridization experi-Present addresses:7Wellcome Trust/Cancer Research UK Institute,
Cambridge CB2 1QR, UK;8Institute for Stem Cell Research, The
Uni-versity of Edinburgh, Edinburgh EH9 3JQ, UK.
9Deceased May 18, 2001.
10These authors contributed equally to the work described. 11Corresponding authors.
E-MAIL [email protected]; FAX 44-1223-33413.
E-MAIL [email protected]; FAX: 61-02-9295-8501.
Article and publication are at http://www.genome.org/cgi/doi/10.1101/ gr.1362303. Article published online before print in November 2003.
ments that have identified regionally expressed genes that are required for normal development (Harrison et al. 1995, 2000; Dunwoodie et al. 1997, 1998, 2002; Dunwoodie and Beddington 2002; Martinez Barbera et al. 2002).
Analysis of 1978 sequences derived from the endoderm li-brary identified 1440different cDNAs, of which 123 proved to be novel in the mouse. In situ hybridization analysis was carried out on 160of the cDNAs, and of these, 18% proved to have restricted expression. This work provides valuable information about the repertoire of gene expression in the endoderm of the mouse em-bryo and may supply pointers as to which genes merit further investigation concerning their roles in development and disease (Anderson and Beddington 1997).
RESULTS
Sequence Analyses
cDNA clones (3072) were selected at random from theEndoderm library, and 2635 sequence tags were generated by single-pass 3⬘
sequencing (Avner et al. 2001). Repetitive and poor-quality se-quence was masked, and any sese-quence tag of <199 nucleotides after masking was discarded. Analysis of the remaining 1978 se-quences is presented in Table 1. Each sequence was compared by using BLASTN with mouse expressed sequence tag (EST) clusters (TIGR Tentative Consensus sequences or TCs version 8.0, June 1, 2002; http://www.tigr.org/tdb/tgi/mgi) and with predicted mouse transcripts in ENSEMBL (version 8.3c.1, July 12, 2002; http://www.ensembl.org/Mus㛭musculus/). Sequence matches were considered significant if alignment of >50nucleotides was observed and the significance value was less than eⳮ30. All
re-maining sequences were considered novel.
Of the 1978 sequences, 1851 clones matched a defined EST (TIGR-TC) cluster, an ENSEMBL gene or transcript, or both. The remaining 127 clones matched neither data set and are classified as novel. Clustering of the 1851 sequences that matched the TIGR-TC or EMSEMBL databases generated a non-redundant set of 1317 known cDNAs. The 127 novel sequences were compared with each other by using BLASTN, using significance limits simi-lar to those described above. This procedure reduced the number of novel cDNAs to 123. All sequences described in this article are available in GenBank, and cDNAs can be obtained from the UK Human Genome Mapping Project Resource Centre (http:// w w w . h g m p . m r c . a c . u k / g e n e s e r v i c e / r e a g e n t s / p r o d u c t s / cdna㛭resources/index.shtml).
Expression Analysis
Of the 1978 cDNAs described above, 160were chosen for expres-sion analysis. Clones were selected so as to exclude housekeeping genes and genes previously studied in a developmental context, Table 1. Summary of Endoderm Sequence Analysis
cDNA clones selected for sequencing 3072
Successful single pass sequence 2635
Masked sequences >199 base pairs in length 1978
Sequences matching ENSEMBL genes 1355
Sequences matching TIGR-TC EST clusters only 496
Novel sequences 127
Nonredundant clones matching mouse ESTs 1317
Nonredundant novel clones 123
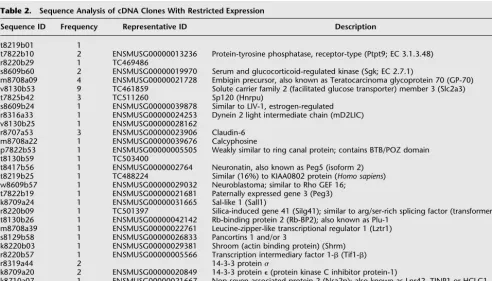
Table 2. Sequence Analysis of cDNA Clones With Restricted Expression
Sequence ID Frequency Representative ID Description
t8219b01 1
t7822b10 2 ENSMUSG00000013236 Protein-tyrosine phosphatase, receptor-type (Ptpt9; EC 3.1.3.48)
r8220b29 1 TC469486
s8609b60 2 ENSMUSG00000019970 Serum and glucocorticoid-regulated kinase (Sgk; EC 2.7.1)
m8708a09 4 ENSMUSG00000021728 Embigin precursor, also known as Teratocarcinoma glycoprotein 70 (GP-70) v8130b53 9 TC461859 Solute carrier family 2 (facilitated glucose transporter) member 3 (Slc2a3)
t7825b42 3 TC511260 Sp120 (Hnrpu)
s8609b24 1 ENSMUSG00000039878 Similar to LIV-1, estrogen-regulated r8316a33 1 ENSMUSG00000024253 Dynein 2 light intermediate chain (mD2LIC)
v8130b25 1 ENSMUSG00000028162
r8707a53 3 ENSMUSG00000023906 Claudin-6
m8708a22 1 ENSMUSG00000039676 Calcyphosine
p7822b53 1 ENSMUSG00000005505 Weakly similar to ring canal protein; contains BTB/POZ domain
t8130b59 1 TC503400
t8417b56 1 ENSMUSG0000002764 Neuronatin, also known as Peg5 (isoform 2) t8219b25 1 TC488224 Similar (16%) to KIAA0802 protein (Homo sapiens) w8609b57 1 ENSMUSG00000029032 Neuroblastoma; similar to Rho GEF 16;
t7822b19 1 ENSMUSG00000021681 Paternally expressed gene 3 (Peg3) k8709a24 1 ENSMUSG00000031665 Sal-like 1 (Sall1)
r8220b09 1 TC501397 Silica-induced gene 41 (Silg41); similar to arg/ser-rich splicing factor (transformer2) t8130b26 1 ENSMUSG00000042142 Rb-binding protein 2 (Rb-BP2); also known as Plu-1
m8708a39 1 ENSMUSG00000022761 Leucine-zipper-like transcriptional regulator 1 (Lztr1) s8129b58 1 ENSMUSG00000026833 Pancortins 1 and/or 3
k8220b03 1 ENSMUSG00000029381 Shroom (actin binding protein) (Shrm) r8220b57 1 ENSMUSG00000005566 Transcription intermediary factor 1-(Tif1-)
r8319a44 2 14-3-3 protein
k8709a20 2 ENSMUSG00000020849 14-3-3 protein⑀(protein kinase C inhibitor protein-1)
k8710a07 1 ENSMUSG00000021667 Nop seven associated protein 2 (Nsa2p); also known as Lnr42, TINP1 or HCLG1 t8219b26 1 ENSMUSG00000032376 Ubiquitin-specific protease 3 (Ubp7)
The table shows 29 cDNAs with restricted patterns of expression. The clones are shown in the same order as in Figure 1, with the first three being members of the visceral endoderm synexpression group. Headings represent (1) the sequence identification number, (2) the number of times the sequence was isolated, (3) the ENSEMBL gene number of the cDNA or its TIGR Cluster number, and (4) gene name or family. Genes for which no description is appended bear no resemblance to any other in the databases.
but to include completely novel sequences, previously unknown sequences that had also been identified in other organisms, cDNAs encoding putative transcriptional regulators, splicing
fac-tors, signaling molecules, cell-cycle regulafac-tors, cytoskeletal pro-teins, and cDNAs encoding homologs of proteins implicated in human disease (for examples, see Table 2).
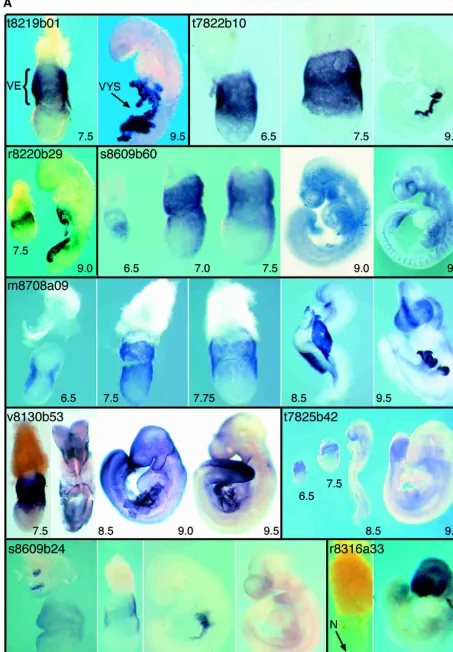
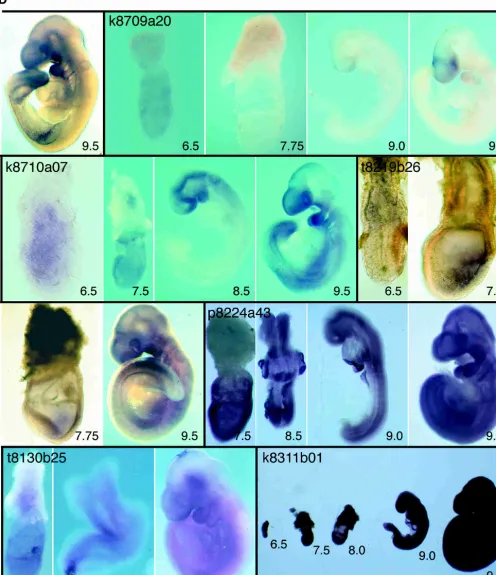
Expression patterns were categorized subjectively as “ubiq-uitous” (64; 40%) if similar levels of expression were observed in all tissues, as “widespread” (57; 36%) if expression was observed in several but not all tissues (frequently with different levels in different tissues), as “restricted” (29; 18%) if transcripts were lo-calized to just a few regions in at least one of the stages examined, and as “undetectable” (10; 6%). The expression patterns of all the restricted cDNAs and of one ubiquitous and two widespread clones are illustrated in Figure 1 and described in the Appendix. Details of the restricted cDNAs are summarized in Table 2, which lists the clones in the same order as in Figure 1, with the first three being members of the visceral endoderm synexpression group (see below). A Supplement to Table 2 (available online at www.genome.org) lists the cDNAs with widespread and ubiqui-tous expression.
Of the 29 restricted expression patterns identified, 22 are expressed in the tissues from which the library was made, of which three (t8219b01, t7822b10, and r8220b29) are exclusively expressed in these tissues. Seven genes were not expressed at detectable levels in the source tissues (w8609b57, r8220b09, t8130b26, m8708a39, r8220b57, r8319a44, t8219b26). Examina-tion of the restricted expression patterns revealed just one group of genes with a similar expression pattern at all stages examined (6.5–9.5 dpc). This synexpression group (Niehrs and Pollet 1999) comprises the three clones, t8219b01, t7822b10, and r8220b29, that are expressed exclusively in the tissues from which the En-dodermlibrary was constructed. All three are expressed in VE at 6.5 and 7.5 dpc and in the yolk sac at 8.5 and 9.5 dpc (Fig. 1). Of the three, only t7822b10has been described previously. It
en-codes a receptor-type protein tyrosine phosphatase termedPtpt9, the loss of function of which causes abnormalities of the central and peripheral nervous systems and of the neuroendocrine sys-tem (Elchebly et al. 1999; Wallace et al. 1999; Batt et al. 2002). We do not know whether the three genes have related functions, because no known motifs have been identified in t8219b01 or r8220b29. Ptpt9 maps to chromosome 17 (54.5Mb), whereas t8219b01 maps to chromosome 8 (60.6Mb) and r8220b29 to chromosome 5 (127.4Mb). The coordinated expression of the three genes is therefore unlikely to be a consequence of their genomic organization.
In addition to this single synexpression group, we have also identified three “coexpression groups,” all members of which are expressed in the same tissue at a particular stage of development and therefore may cooperate in the specification of that tissue in which they are expressed. Members of a coexpression group may also be expressed in other regions, and their expression patterns at earlier and later stages may also diverge. In defining these groups, we omit the ubiquitously expressed and widespread clones (which are likely to have housekeeping functions), and focus particularly on the signaling centers in the 7.5-dpc embryo from which theEndodermlibrary was derived. Thus, Table 3 lists the clones expressed in the VE coexpression group (the largest) and the node and definitive endoderm coexpression groups.
DISCUSSION
Endoderm
cDNA Sequence Analysis
At 7.5 dpc, the endoderm that surrounds the embryonic region of the mouse conceptus, from which the endoderm library is de-rived, is a single layer of∼700 cells (Snow 1977). This tissue com-prises the node (which is required to establish the anterior-posterior, dorso-ventral, and left-right axes of the embryo), VE (which is important for nutrient exchange and for initiating an-terior patterning), and the definitive endoderm (which is also involved in anterior patterning; Anderson and Beddington 1997; Beddington and Robertson 1999; Bielinska et al. 1999; Lu et al. 2001; Hamada et al. 2002). The node, VE, and definitive endo-derm go on to form the notochord and floor plate of the neural tube, yolk sac endoderm, and gut endoderm (GE) respectively.
Although the mouse genome has been almost completely sequenced (Waterston et al. 2002), our data indicate that tran-script identification is incomplete. Indeed, sequencing of just Table 3. Coexpression Groups
Coexpression group Clones
Visceral endoderm s8609b60, m8708a09, v8130b53, t7825b42, s8609b24, v8130b25
Node v8130b25, r8316a33, m8708a22,
p7822b53, t8130b59
Gut endoderm v8130b25, r8707a53
The three coexpression groups are based on the constituent tissues of the 7.5-dpc mouse embryo. Only genes with restricted expression pattens are included.
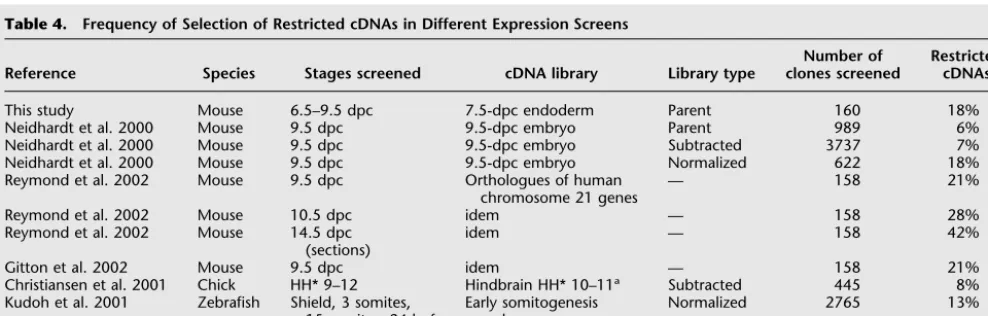
Table 4. Frequency of Selection of Restricted cDNAs in Different Expression Screens
Reference Species Stages screened cDNA library Library type
Number of clones screened
Restricted cDNAs
This study Mouse 6.5–9.5 dpc 7.5-dpc endoderm Parent 160 18%
Neidhardt et al. 2000 Mouse 9.5 dpc 9.5-dpc embryo Parent 989 6%
Neidhardt et al. 2000 Mouse 9.5 dpc 9.5-dpc embryo Subtracted 3737 7%
Neidhardt et al. 2000 Mouse 9.5 dpc 9.5-dpc embryo Normalized 622 18%
Reymond et al. 2002 Mouse 9.5 dpc Orthologues of human chromosome 21 genes
— 15821%
Reymond et al. 2002 Mouse 10.5 dpc idem — 15828%
Reymond et al. 2002 Mouse 14.5 dpc (sections)
idem — 15842%
Gitton et al. 2002 Mouse 9.5 dpc idem — 15821%
Christiansen et al. 2001 Chick HH* 9–12 Hindbrain HH* 10–11a Subtracted 445 8%
Kudoh et al. 2001 Zebrafish Shield, 3 somites, 15 somites, 24 hpf
Early somitogenesis embryo
Normalized 2765 13%
Gawantka et al. 1998X. laevis Stages 10+, 13, 30 Neurula stage embryo Parent 1765 25%b aStage according to Hamburger and Hamilton (1951).
bThis figure is reduced to 16% if one considers only unique cDNAs with a restricted expression pattern.
1978 clones of the Endoderm library has identified no fewer than 123 novel cDNAs. Therefore, our work provides a valuable source of ESTs, which will be useful in functional genomic projects and expression profiling. Further sequencing of the li-brary will be required to draw conclusions about the complexity of gene expression in the endoderm, but we note that two-thirds of the 1978 sequences analyzed were represented only once, indicating that many more transcripts remain to be isolated from the original 5.8⳯105independent clones (Harrison et al.
1995).
Endoderm cDNA Expression Analysis
In this article we have studied the expression patterns of 160 cDNAs derived from a mouse endoderm cDNA library. Our screen differs from related screens (Gawantka et al. 1998; Neidhardt et al. 2000; Christiansen et al. 2001; Kudoh et al. 2001) because cDNAs were sequenced and clustered before carrying out expression analyses. This ensured that each transcript was stud-ied only once, an important issue when analyzing mouse devel-opment because obtaining mouse embryos at the appropriate stages is more costly and time-consuming than doing the same in chicken, frog, or fish.
Many transcripts proved to have ubiquitous or widespread expression patterns, but the expression of 29 (18%) was restricted to particular tissues at least in one of the time points examined. Such cDNAs are of interest because they may provide useful mo-lecular markers for those tissues and because their expres-sion patterns may provide hints as to their developmental func-tions.
A sequence-based approach such as that taken here may assist in the identification of cDNAs with restricted expression patterns. In addressing this point, it is difficult to make direct comparisons with other screens because definitions of “re-stricted” may vary, because other screens have used different spe-cies at different stages, and because of the way in which cDNA clones were selected. Nevertheless, screens that have selected cDNAs at random, whether using parent libraries or even sub-tracted cDNA libraries, have tended to obtain lower proportions of restricted expression patterns than those described in this ar-ticle (Table 4; Neidhardt et al. 2000; Christiansen et al. 2001; Kudoh et al. 2001). In contrast, a screen making use of a library normalized by colony hybridization rather than by sequence analysis (Neidhardt et al. 2000) obtained a very similar propor-tion to that reported here, emphasizing the importance of nor-malization in screens of this sort, especially when material might be limiting. We opted to use of the parent cDNA library rather than a subtracted version so as to avoid the loss of rare clones. Interestingly, a similar percentage of restricted patterns at 9.5 dpc was obtained in an expression analysis of murine orthologs of all genes on human chromosome 21 (Gitton et al. 2002; Reymond et al. 2002).
One benefit of a screen such as this is that it enables the definition of sets of coregulated genes, or “synexpression groups” (Niehrs and Pollet 1999) as well as coexpression groups. In de-fining such groups, we omit widespread and ubiquitous clones so as to exclude “housekeeping” genes. As described above, we found a single synexpression group, which comprises genes ex-pressed in the VE at 6.5 and 7.5 dpc and in the yolk sac at 8.5 and 9.5 dpc. In addition, we defined coexpression groups for VE, node, and GE. Each coexpression group contains the genes that are expressed in the tissue in question at 7.5 dpc (Table 3), with the VE group containing six clones; the node group, five clones; and the definitive gut group, two clones. Members of a coexpres-sion group may cooperate in the specification or function of the tissue in question.
METHODS
Endoderm cDNA Sequence Analysis
Clones from the Endoderm library were randomly picked and gridded into 384-well plates (Genetix Ltd) using an automated colony picker (Meier-Ewert et al. 1993). They were sequenced from the 3⬘end, vector sequence was removed, and repeats and regions of poor quality were masked by using PHRED (http:// www.phrap.org/phrap.docs/phred.html). Sequences containing <200 nucleotides were not analyzed further. Sequence data have been submitted to the EMBL database.
BLASTN (NCBI: ftp://ftp.ncbi.nih.gov/blast/executables/) was used to compare each sequence with two publicly available mouse gene data sets: the ENSEMBL gene predictions for mouse (version 8.3c.1, July 12, 2002; http://www.ensembl.org/ Mus㛭musculus) and the TIGR Gene Index (TIGR-Tentative Con-sensus sequences or TCs version 8.0, June 1, 2002; http://www. tigr.org/tdb/tgi/mgi/). Alignments were inspected manually, and possible homology or novelty was further investigated by using BLASTP (NCBI: ftp://ftp.ncbi.nih.gov/blast/executables/). Se-quences that failed to match an ENSEMBL gene or a TIGR TC were considered as potentially novel. To determine redundancy within the clone set, sequences that mapped to the same ENSEMBL predicted gene were considered redundant. Similarly, sequences that lacked an ENSEMBL mapping but shared the same TIGR TC were considered redundant. Sequences that failed to map to an ENSEMBL prediction or a TIGR TC were considered nonredundant.
RNA In Situ Hybridization
Mouse embryos were collected from CBA/Ca⳯C57Bl10or C57BL6⳯C57BL6 matings at 6.5, 7.5, 8.5, and 9.5 dpc. Extra-embryonic membranes were removed in M2 medium (Hogan et al. 1994) containing 10% fetal calf serum. Embryos were fixed overnight in 4% paraformaldehyde (PFA) in phosphate buffered saline (PBS) at 4°C, after which they were dehydrated in increas-ing concentrations of methanol in PBS and stored in 100% methanol atⳮ20°C until use. Antisense RNA probes were gen-erated as described (Harrison et al. 1995) and whole-mount RNA in situ hybridization (WISH) was performed according to the method of Wilkinson (1992). Hybridization conditions were those of Rosen and Beddington (1993), except that embryo pow-der was omitted from the procedure, and treatment with 10mg/ mL proteinase K was 5 min for embryos at 6.5 to 7.5 dpc and 12 min for embryos at 8.5 to 9.5 dpc. Embryos were processed in 12-well plates (Costar) in 12-µm mesh nets for embryos atⱕ7.5 dpc, and 74-µm mesh nets for embryos atⱖ8.5 dpc. At least three embryos of each stage were examined for each probe, and re-stricted expression patterns were confirmed by an independent set of hybridizations. After stopping the staining reaction, em-bryos were postfixed in 4% PFA, 0.1% glutaraldehyde in PBS for 1 h at room temperature and stored in 0.4% PFA at 4°C. Photo-graphs were taken by using a dissecting microscope (Nikon) and tungsten film (Kodak 64T). Images were digitized by using a Po-laroid SprintScan 35 scanner.
ACKNOWLEDGMENTS
Dedicated to the memory of Rosa Beddington (March 23, 1956 to May 18, 2001).
their help and advice throughout the course of this work and their comments on the manuscript. “Restricted” expression pat-terns have been submitted to the Mouse Gene Expression data-base (GXD) http://www.informatics.jax.org/mgihome/GXD/ aboutGXD.shtml.
The publication costs of this article were defrayed in part by payment of page charges. This article must therefore be hereby marked “advertisement” in accordance with 18 USC section 1734 solely to indicate this fact.
APPENDIX
Expression Patterns of “Restricted” cDNAs
t8219b01
At the mid streak stage, expression of clone t8219b01 is detected in the VE. Expression at later stages is restricted to the visceral yolk sac (VYS).
t7822b10
At 6.0dpc,Ptpt9expression is restricted to the VE and later to the VYS. Loss of function of this gene has been reported to cause abnormalities of the central and peripheral nervous systems and of the neuroendocrine system (Elchebly et al. 1999; Wallace et al. 1999; Batt et al. 2002).
r8220b29
At the mid streak stage, clone r8220b29 expression is detected in the VE (7.5 dpc). Expression at later stages (9.0dpc) is restricted to the VYS.
s8609b60
At the onset of gastrulation,Sgkis strongly expressed in the VE overlying the nascent mesodermal wings and, more weakly, in the mesoderm itself. Transcripts are also detected in the VE over-lying the extra-embryonic ectoderm. As gastrulation proceeds, the latter domain of expression becomes more robust, and in the embryo proper, it is strongest in the regions juxtaposing the primitive streak. At 8.5 and 9.5 dpc,Sgktranscripts are found in the vasculature as well as in the eye and branchial arches. Loss of function of this gene reduces the ability of mice to reduce Na+
excretion when subjected to dietary NaCl restriction (Wulff et al. 2002). The expression pattern ofSgkhas been described by Lee and colleagues (2001).
m8708a09
At 6.5 dpc,Embiginis strongly expressed in the VE at the junction between extra-embryonic and embryonic portions of the concep-tus. By 7.5 dpc, expression occurs throughout the VE and, more weakly, in the definitive endoderm. At head-fold stages,Embigin transcription occurs in anterior definitive endoderm, with strong expression also detectable in the VE. At 8.5 dpc, transcripts are present in the forebrain neuroepithelium, the foregut diverticu-lum, and the yolk sac. By 9.5 dpc, expression is strong in fore-brain neuroepithelium (especially in the dorsal midline) and also occurs in the mid- and hindbrain. Transcripts are also detectable in branchial arches and the nephrogenic cord. The early expres-sion pattern of this gene has been described by Shimono and Behringer (1999); later stages, by Fan and colleagues (1998).
v8130b53
At the late gastrula stage, strong expression ofSlc2a3is detected in the VE (7.5 dpc). Later, expression is seen in the surface ecto-derm (8.5 and 9.0dpc) and the VYS. As development proceeds, expression in surface ectoderm persists but decreases anteriorly. Expression in the yolk sac is still detectable at 9.5 and 10.5 dpc (data not shown).
t7825b42
At egg cylinder stages, mouseSp120is most strongly expressed in the extra-embryonic half of the conceptus, with only weak ex-pression in the embryonic half, mostly in the primitive streak. At
8.5 and 9.5 dpc, robust expression is seen in the tailbud and presomitic mesoderm, when transcripts are also present in ven-tral forebrain, branchial arches, and the limb buds.
s8609b24
At egg cylinder stages, expression ofs8609b24occurs in the VE overlying the extra-embryonic portion of the conceptus and the most proximal region of the epiblast. At 6.5 dpc, VE expression covers most of the conceptus, although it is weaker distally and completely absent from the most proximal region. At 7.5 dpc, expression persists in the progeny of the VE cells, coming to lie over the extra-embryonic ectoderm; transcripts are still absent from the most proximal VE. By 8.5 dpc, expression is confined to the yolk sac, but at 9.5 dpc, there is widespread, albeit weak, expression in the embryo proper, particularly in the forebrain, anterior midbrain, branchial arches, and gut.
r8316a33
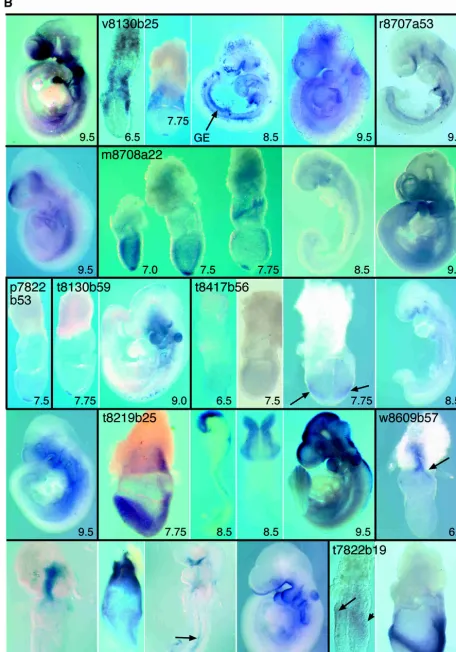
mD2LICexpression is first detected in the node at the mid to late streak stage. Expression persists in the node at the late neural plate/early head-fold stage, but is reduced by the eight-somite stage when widespread expression is detectable throughout the embryo (data not shown). This widespread expression persists and becomes stronger in the 25-somite stage embryo. By 11 dpc, expression is detected in GE and the heart (data not shown).
v8130b25
At 6.5 dpc, expression ofv8130b25is restricted to the VE over-lying the embryonic and extra-embryonic ectoderm. By 7.5 dpc, expression is observed in the node, and at 8.5 dpc, this gene is strongly expressed in the VYS, GE, and developing blood cells. By 9.5 dpc, expression is associated with the vasculature, heart, branchial arch, and brain.
r8707a53
Expression ofClaudin-6is detectable in the forebrain, in the VYS, and throughout the GE from 9.0dpc. At 9.0dpc, expression in the forebrain is predominantly ventral, whereas at 9.5 dpc, it is mainly dorsal.
m8708a22
Calcyphosineis weakly expressed in extra-embryonic ectoderm at 6.5 dpc (data not shown). At 7.0dpc, expression occurs through-out the extra-embryonic ectoderm and the epiblast, with maxi-mal expression in the node. During elongation of the streak, highest expression is seen in the node. At 8.5 and 9.5 dpc, ex-pression is ubiquitous.
p7822b53
Expression ofp7822b53is restricted to the node of the gastrulat-ing embryo.
t8130b59
Expression of clone t8130b59 is detectable in the node at 7.5 dpc and in the branchial arches and otic vesicles at 9.5 dpc.
t8417b56
At 6.5 dpc,Neuronatinis expressed weakly in the embryonic half of the conceptus. By 7.0dpc, transcripts are present throughout the mesoderm and ectoderm, and maximal expression is then seen in the posterior head-folds (arrows). At 8.5 to 9.5 dpc, Neu-ronatin expression is detectable in the ventral forebrain, bran-chial arches, and foregut diverticulum. Forebrain expression is more widespread at this time, and expression also occurs throughout the trunk mesoderm. Expression ofneuronatinat 8.5 and 9.5 dpc has also been described by Wijnholds et al. (1995), who detected expression in rhombomeres 3 and 5 of the hind-brain.
t8219b25
sion persists until the late head-fold stage (8.0dpc). By 8.5 to 9.0 dpc, expression is detected in the diencephalon and midbrain, with weaker expression in the hindbrain and spinal cord. At 9.5 dpc, expression occurs in the roofplate and first branchial arch, with elevated expression detected in the hindbrain and anterior spinal cord.
w8609b57
At the onset of gastrulation,Neuroblastomais strongly expressed in a single domain comprising the most proximal region of the egg cylinder and a proximo-distal stripe within the ectoplacental cone (arrow). This domain persists during head-fold stages, when the gene becomes weakly expressed throughout the VE and more strongly in the head-fold pocket, and notochord (7.5 dpc; arrow). At 8.5 dpc, expression is strong in notochord and ventral fore-brain, with weak activation in the foregut diverticulum. By 9.5 dpc, epithelial expression extends from the ventral forebrain to the fourth branchial arch, with transcription also occurring in the otic vesicle.
t7822b19
At 6.5 dpc,Peg3expression occurs in the anterior VE (long arrow) and the primitive streak (short arrow). By 7.5 dpc, expression is widespread in embryonic mesoderm and allantois. Loss of func-tion of Peg3 causes growth retardation and an impairment of maternal behavior that frequently results in death of the off-spring (Li et al. 1999).
k8709a24
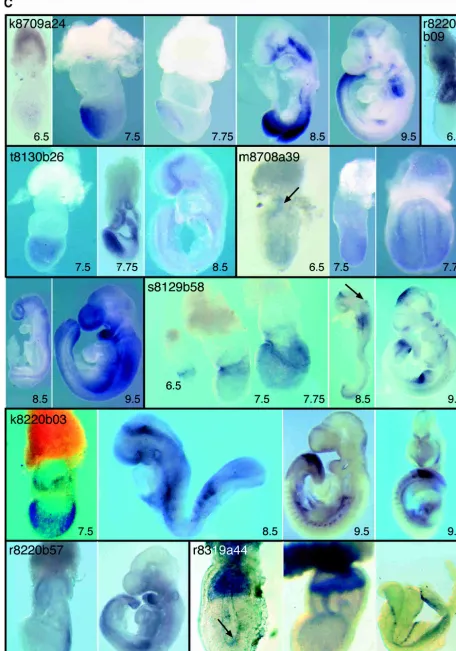
At egg cylinder stages,Sall1is expressed in the anterior and, more weakly, in the posterior epiblast. At head-fold stages, transcripts become restricted to anterior neural folds, and at 8.5 dpc, this expression resolves into ventral neural plate and neural groove. Weak expression is also seen in the branchial arch region and posterior trunk. At 9.5 dpc,Sall1is expressed in the ventral fore-brain, anterior midfore-brain, the midbrain/hindbrain boundary, branchial arch ectoderm, posterior trunk, and, most promi-nently, mesonephros and presomitic mesoderm and somites. SALL1is implicated in Townes-Brocks syndrome (Kohlhase et al. 1998), and loss of function of Sall1indicates that the gene is required for ureteric bud invasion during kidney development (Nishinakamura et al. 2001). Expression of Sall1 at 7.5, 8.5, and 9.5 dpc has been reported by Buck and colleagues (2001).
r8220b09
Expression ofSilg41occurs in the extra-embryonic ectoderm be-fore and at the onset of gastrulation, at 6.0to 6.5 dpc.
t8130b26
Rb-BP2expression is restricted to the embryonic ectoderm from 6.0–7.5 dpc. By 7.75 dpc, transcripts are strongly detectable in the anterior definitive endoderm as well as in the chorion and allantois. By 8.5 dpc, expression is restricted to the forebrain.
m8708a39
At 6.5 dpc,Lztr-1is expressed in the epiblast and in extraembry-onic ectoderm and/or endoderm adjacent to the ectoplacental cone (arrow). At 7.5 dpc, although expression is widespread in the embryonic region, it is stronger posteriorly and down-regulated in the node. At head-fold stages,Lztr-1expression is most prominent in the neural folds and nascent neural tube. At 9.5 dpc, expression is high in the forebrain, branchial arches, and limb buds.
s8129b58
At the onset of gastrulation,Pancortin-1and/or-3is expressed at the junction between embryonic and extra-embryonic portions of the conceptus, with higher levels anteriorly. As gastrulation proceeds, expression occurs in the amnion and chorion and be-comes widespread within the embryo proper. During somatogen-esis (8.5 dpc), expression becomes restricted to rhombomere 4 (arrow), to the junction between the diencephalon and
mesen-cephalon, and to anterior and posterior portions of trunk mes-enchyme. At 9.5 dpc, spotty expression is detectable in the mid-brain in the earliest differentiating neurons. Expression also oc-curs in the olfactory placodes and in some cranial ganglia. Expression in the limb buds is initially widespread but becomes restricted to posterior regions as development proceeds. Expres-sion of the closely related genesNoelin 1and2at 10.5 dpc has been described by Moreno and Bronner-Fraser (2002). The ex-pression pattern they describe is similar, although not identical, to that described in this article at 9.5 dpc.
k8220b03
At 7.5 dpc,Shrmexpression is detected throughout all embryonic tissues. Particularly strong expression occurs in the rostral region of presomitic mesoderm and later in the most posterior somites. Weaker expression is detected in the neural epithelium at 8.5 dpc. Somitic expression persists in older embryos, particularly in cells giving rise to ventral sclerotome. At 9.5 dpc, there is weak expression in the brain. Loss-of-function experiments indicate that Shroom, an actin-binding protein, is required for neural tube morphogenesis (Hildebrand and Soriano 1999).
r8220b57
Expression of Tif-1  is restricted to the advancing primitive streak at 7.5 dpc, and later at 9.0dpc, it is strongest in the tailbud, presomitic mesoderm, nascent somites, branchial arches, and limb buds.
r8319a44
Expression of14-3-3is detected at the onset of gastrulation (6.5 dpc) and up to late streak stages (7.5 dpc) in the extra-embryonic ectoderm and ectoplacental cone. At the onset of gastrulation, transcripts are localized to the apical surface of cells (arrow). At somites stages (8.5, 9.5 dpc), expression occurs in surface ecto-derm precursors along the distal edges of the neural folds and then, briefly, in a thin line above the neural tube. Expression is observed in branchial arches.
k8709a20
14-3-3⑀is ubiquitously expressed at 6.5 dpc but is then down-regulated such that by 7.5 dpc, transcripts are barely detectable. At 8.5 dpc, weak expression occurs in the forebrain and heart. At 9.5 dpc, forebrain expression is prominent, together with strong expression in the midbrain and branchial arches. These observa-tions complement work by McConnell and colleagues (1995), which has analyzed expression of 14-3-3 ⑀ from 8.5 dpc and found that expression is high in neural tissue by 12.5 dpc.
k8710a07
Nsa2pis expressed throughout the epiblast and extraembryonic ectoderm at 6.5 dpc. At 7.5 dpc, it continues to be expressed in all internal cell layers of the conceptus. By 8.5 and 9.5 dpc, expres-sion is strongest in the branchial arches, neural tube, and, par-ticularly, the forebrain. Low-level expression also occurs throughout the lateral mesoderm.
t8219b26
Expression ofUbp7is detected in the extra-embryonic ectoderm at the onset of gastrulation (6.5 dpc) and in the primitive streak and emerging mesoderm during gastrulation (7.5 dpc). At 7.75 and 9.5 dpc, widespread expression occurs in some mesodermal derivatives.
p8224a43
An example of a “widespread” cDNA. Expression is ubiquitous but occurs at different levels in different tissues.
t8130b25
An example of a “widespread” cDNA. Expression is ubiquitous but occurs at different levels in different tissues.
k8311b01
An example of a “ubiquitous” cDNA Expression is completely ubiquitous in both embryonic and extra-embryonic tissues.
REFERENCES
Adams, M.D., Celniker, S.E., Holt, R.A., Evans, C.A., Gocayne, J.D., Amanatides, P.G., Scherer, S.E., Li, P.W., Hoskins, R.A., Galle, R.F., et al 2000. The genome sequence ofDrosophila melanogaster.Science 287:2185–2195.
Anderson, K. and Beddington, R. 1997. Pattern formation and developmental mechanisms.Curr. Opin. Genet. Dev.7:455–458. Aparicio, S., Chapman, J., Stupka, E., Putnam, N., Chia, J.M., Dehal, P.,
Christoffels, A., Rash, S., Hoon, S., Smit, A., et al. 2002. A radiation hybrid transcript map of the mouse genome.Nat. Genet.
29:194–200.
Avner, P., Bruls, T., Poras, I., Eley, L., Gas, S., Ruiz, P., Wiles, M.V., Sousa-Nunes, R., Kettleborough, R., Rana, A. 2001. A radiation hybrid transcript map of the mouse genome.Nat. Genet. 29:194–200.
Batt, J., Asa, S., Fladd, C., and Rotin, D. 2002. Pituitary, pancreatic and gut neuroendocrine defects in protein tyrosine
phosphatase-sigma–deficient mice.Mol. Endocrinol.16:155–169. Beddington, R.S.P. and Robertson, E.J. 1999. Axis development and early
asymmetry in mammals.Cell96:195–209.
Bielinska, M., Narita, N., and Wilson, D.B. 1999. Distinct roles for visceral endoderm during embryonic mouse development.Int. J. Dev. Biol.43:183–205.
Buck, A., Kispert, A., and Kohlhase, J. 2001. Embryonic expression of the murine homologue of SALL1, the gene mutated in
Townes-Brocks syndrome.Mech. Dev.104:143–146.
TheC. elegansgenome consortium. 1998. Genome sequence of the nematodeC. elegans: A platform for investigating biology. TheC. elegansSequencing Consortium.Science282:2012–2018. Carlton, J.M., Angiuoli, S.V., Suh, B.B., Kooij, T.W., Pertea, M., Silva,
J.C., Ermolaeva, M.D., Allen, J.E., Selengut, J.D., Koo, H.L., et al. 2002. Genome sequence and comparative analysis of the model rodent malaria parasitePlasmodium yoelii yoelii.Nature419:512–519. Christiansen, J.H., Coles, E.G., Robinson, V., Pasini, A., and Wilkinson,
D.G. 2001. Screening from a subtracted embryonic chick hindbrain cDNA library: Identification of genes expressed during hindbrain, midbrain and cranial neural crest development.Mech. Dev. 102:119–133.
Dehal, P., Satou, Y., Campbell, R.K., Chapman, J., Degnan, B., De Tomaso, A., Davidson, B., Di Gregorio, A., Gelpke, M., Goodstein, D.M., et al. 2002. The draft genome ofCiona intestinalis: Insights into chordate and vertebrate origins.Science298:2157–2167. Doetschman, T., Gregg, R.G., Maeda, N., Hooper, M.L., Melton, D.W.,
Thompson, S., and Smithies, O. 1987. Targetted correction of a mutant HPRT gene in mouse embryonic stem cells.Nature 330:576–578.
Dunwoodie, S.L. and Beddington, R.S.P. 2002. The expression of the imprinted gene lpl is restricted to extra-embryonic tissues and embryonic lateral mesoderm during early mouse development.Int. J. Dev. Biol.46:459–466.
Dunwoodie, S.L., Henrique, D., Harrison, S.M., and Beddington, R.S.P. 1997. Mouse Dll3: A novel divergent⌬gene which may
complement the function of other⌬homologues during early pattern formation in the mouse embryo.Development 124:3065–3076.
Dunwoodie, S.L., Rodriguez, T.A., and Beddington, R.S.P. 1998. Msg1 and Mrg1, founding members of a gene family, show distinct patterns of gene expression during mouse embryogenesis.Mech. Dev. 72:27–40.
Dunwoodie, S.L., Clements, M., Sparrow, D.B., Sa, X., Conlon, R.A., and Beddington, R.S.P. 2002. Axial skeletal defects caused by mutation in the spondylocostal dysplasia/pudgy gene Dll3 are associated with disruption of the segmentation clock within the presomitic mesoderm.Development129:1795–1806.
Elchebly, M., Wagner, J., Kennedy, T.E., Lanctot, C., Michaliszyn, E., Itie, A., Drouin, J., and Tremblay, M.L. 1999. Neuroendocrine dysplasia in mice lacking protein tyrosine phosphatase sigma.Nat. Genet.21:330–333.
Fan, Q.W., Kadomatsu, K., Uchimura, K., and Muramatsu, T. 1998. Embigin/basigin subgroup of the immunoglobulin superfamily: Different modes of expression during mouse embryogenesis and correlated expression with carbohydrate antigenic markers.Dev. Growth Diff.40:277–286.
Fraser, A.G., Kamath, R.S., Zipperlen, P., Martinez-Campos, M., Sohrmann, M., and Ahringer, J. 2000. Functional genomic analysis ofC. eleganschromosome I by systematic RNA interference.Nature
408:325–330.
Gardner, M.J., Hall, N., Fung, E., White, O., Berriman, M., Hyman, R.W., Carlton, J.M., Pain, A., Nelson, K.E., Bowman, S., et al. 2002. Genome sequence of the human malaria parasitePlasmodium falciparum.Nature419:498–511.
Gawantka, V., Pollet, N., Delius, H., Vingron, M., Pfister, R., Nitsch, R., Blumenstock, C., and Niehrs, C. 1998. Gene expression screening in Xenopusidentifies molecular pathways, predicts gene function and provides a global view of embryonic patterning.Mech. Dev. 77:95–141.
Gitton, Y., Dahmane, N., Baik, S., Ruiz i Altaba, A., Neidhardt, L., Scholze, M., Herrmann, B.G., Kahlem, P., Benkahla, A., Schrinner, S., et al. 2002. A gene expression map of human chromosome 21 orthologues in the mouse.Nature420:586–590.
Hamada, H., Meno, C., Watanabe, D., and Saijoh, Y. 2002. Establishment of vertebrate left-right asymmetry.Nat. Rev. Genet. 3:103–113.
Hamburger, V. and Hamilton, H.L. 1951. A series of normal stages in the development of the chick embryo.J. Morphol.88:49–92. Harrison, S.M., Dunwoodie, S.L., Arkell, R.M., Lehrach, H., and
Beddington, R.S.P. 1995. Isolation of novel tissue-specific genes from cDNA libraries representing the individual tissue constituents of the gastrulating mouse embryo.Development121:2479–2489.
Harrison, S.M., Houzelstein, D., Dunwoodie, S.L., and Beddington, R.S.P. 2000. Sp5, a new member of the Sp1 family, is dynamically expressed during development and genetically interacts with Brachyury.Dev. Biol.227:358–372.
Hildebrand, J.D. and Soriano, P. 1999. Shroom, a PDZ
domain-containing actin-binding protein, is required for neural tube morphogenesis in mice.Cell99:485–497.
Hogan, B., Beddington, R., Costantini, F., and Lacy, E. 1994. Manipulating the mouse embryo: A laboratory manual. Cold Spring Harbor Laboratory Press, Cold Spring Harbor, NY.
Kamath, R.S., Fraser, A.G., Dong, Y., Poulin, G., Durbin, R., Gotta, M., Kanapin, A., Le Bot, N., Moreno, S., Sohrmann, M., et al. 2003. Systematic functional analysis of theCaenorhabditis elegansgenome using RNAi.Nature421:231–237.
Kohlhase, J., Wischermann, A., Reichenbach, H., Froster, U., and Engel, W. 1998. Mutations in the SALL1 putative transcription factor gene cause Townes-Brocks syndrome.Nat. Genet.18:81–83.
Kudoh, T., Tsang, M., Hukriede, N.A., Chen, X., Dedekian, M., Clarke, C.J., Kiang, A., Schultz, S., Epstein, J.A., Toyama, R., et al. 2001. A gene expression screen in zebrafish embryogenesis.Genome Res. 11:1979–1987.
Lander, E.S., Linton, L.M., Birren, B., Nusbaum, C., Zody, M.C., Baldwin, J., Devon, K., Dewar, K., Doyle, M., FitzHugh, W., et al. 2001. Initial sequencing and analysis of the human genome.Nature 409:860–921.
Lee, E., Lein, E.S., and Firestone, G.L. 2001. Tissue-specific expression of the transcriptionally regulated serum and glucocorticoid-inducible protein kinase (Sgk) during mouse embryogenesis.Mech. Dev. 103:177–181.
Li, L., Keverne, E.B., Aparicio, S.A., Ishino, F., Barton, S.C., and Surani, M.A. 1999. Regulation of maternal behavior and offspring growth by paternally expressed Peg3.Science284:330–333.
Lu, C.C., Brennan, J., and Robertson, E.J. 2001. From fertilization to gastrulation: Axis formation in the mouse embryo.Curr. Opin. Genet. Dev.11:384–392.
Martinez Barbera, J.P., Rodriguez, T.A., Greene, N.D., Weninger, W.J., Simeone, A., Copp, A.J., Beddington, R.S.P., and Dunwoodie, S. 2002. Folic acid prevents exencephaly in Cited2 deficient mice. Hum. Mol. Genet.11:283–293.
McConnell, J.E., Armstrong, J.F., Hodges, P.E., and Bard, J.B. 1995. The mouse 14-3-3 epsilon isoform, a kinase regulator whose expression pattern is modulated in mesenchyme and neuronal differentiation. Dev. Biol.169:218–228.
Meier-Ewert, S., Maier, E., Ahmadi, A., Curtis, J., and Lehrach, H. 1993. An automated approach to generating expressed sequence catalogues.Nature361:375–376.
Moreno, T.A. and Bronner-Fraser, M. 2002. Neural expression of mouse Noelin-1/2 and comparison with other vertebrates.Mech. Dev. 119:121.
Neidhardt, L., Gasca, S., Wertz, K., Obermayr, F., Worpenberg, S., Lehrach, H., and Herrmann, B.G. 2000. Large-scale screen for genes controlling mammalian embryogenesis, using high-throughput gene expression analysis in mouse embryos.Mech. Dev.98:77–94. Niehrs, C. and Pollet, N. 1999. Synexpression groups in eukaryotes.
Nature402:483–487.
Nishinakamura, R., Matsumoto, Y., Nakao, K., Nakamura, K., Sato, A., Copeland, N.G., Gilbert, D.J., Jenkins, N.A., Scully, S., Lacey, D.L., et al. 2001. Murine homolog of SALL1 is essential for ureteric bud invasion in kidney development.Development128:3105–3115.
Reymond, A., Marigo, V., Yaylaoglu, M.B., Leoni, A., Ucla, C., Scamuffa, N., Caccioppoli, C., Dermitzakis, E.T., Lyle, R., Banfi, S., et al. 2002. Human chromosome 21 gene expression atlas in the mouse.Nature 420:582–586.
Rosen, B. and Beddington, R.S.P. 1993. Whole-mount in situ hybridization in the mouse embryo: Gene expression in three dimensions.Trends Genet.9:162–167.
Shimono, A. and Behringer, R.R. 1999. Isolation of novel cDNAs by subtractions between the anterior mesendoderm of single mouse gastrula stage embryos.Dev. Biol.209:369–380.
Snow, M.H.L. 1977. Gastrulation in the mouse: Growth and
regionalization of the epiblast.J. Embryol. Exp. Morph.42:293–303. Stanford, W.L., Cohn, J.B., and Cordes, S.P. 2001. Gene-trap
mutagenesis: Past, present and beyond.Nat. Rev. Genet.2:756–768. Thomas, K.R. and Capecchi, M.R. 1987. Site-directed mutagenesis by
gene targeting in mouse embryo-derived stem cells.Cell 51:503–512.
Venter, J.C., Adams, M.D., Myers, E.W., Li, P.W., Mural, R.J., Sutton, G.G., Smith, H.O., Yandell, M., Evans, C.A., Holt, R.A., et al. 2001. The sequence of the human genome.Science291:1304–1351. Wallace, M.J., Batt, J., Fladd, C.A., Henderson, J.T., Skarnes, W., and
Rotin, D. 1999. Neuronal defects and posterior pituitary hypoplasia in mice lacking the receptor tyrosine phosphatase PTP.Nat. Genet. 21:334–338.
Waterston, R.H., Lindblad-Toh, K., Birney, E., Rogers, J., Abril, J.F., Agarwal, P., Agarwala, R., Ainscough, R., Alexandersson, M., An P., et al. 2002. Initial sequencing and comparative analysis of the
mouse genome.Nature420:520–562.
Wijnholds, J., Chowdhury, K., Wehr, R., and Gruss, P. 1995. Segment-specific expression of the neuronatin gene during early hindbrain development.Dev. Biol.171:73–84.
Wilkinson, D.G. 1992. Whole mount in situ hybridisation of vertebrate embryos. InIn situ hybridisation, pp. 75–83. IRL Press, Oxford, UK. Wulff, P., Vallon, V., Huang, D.Y., Volkl, H., Yu, F., Richter, K., Jansen,
M., Schlunz, M., Klingel, K., Loffing, J., et al. 2002. Impaired renal Na+retention in the sgk1-knockout mouse.J. Clin. Invest.
110:1263–1268.
WEB SITE REFERENCES
http://www.tigr.org/tdb/tgi/mgi; TIGR Tentative Consensus sequences, version 8.0.
http://www.ensembl.org/Mus㛭musculus/; predicted mouse transcripts in ENSEMBL.
http://www.hgmp.mrc.ac.uk/geneservice/reagents/products/cdna㛭resources/ index.shtml; the UK Human Genome Mapping Project Resource Centre.
http://www.phrap.org/phrap.docs/phred.html; PHRED. ftp://ftp.ncbi.nih.gov/blast/executables/; BLASTN and BLASTP. http://www.tigr.org/tdb/tgi/mgi/; TIGR Gene Index.