International Journal of Nanomedicine
Preparation and in vitro and in vivo
characterization of cyclosporin A-loaded,
PEGylated chitosan-modified, lipid-based
nanoparticles
Ling Zhang1,2,#
Zhi-Liang Zhao3,#
Xiao-Hong Wei1
Jin-Hua Liu2
1School of Medicine, 2College
of Material, Chemistry and Chemical Engineering, Hangzhou Normal University, 3Tongde Hospital of
Zhejiang Province, Hangzhou, People’s Republic of China
#These authors contributed equally
to this paper
Correspondence: Xiao-Hong Wei Room 318, Building 9, Xia Sha Campus, Hangzhou Normal University, 16 Xue-Ling Road, Hangzhou 310036, People’s Republic of China
Tel +86 571 2886 9344 Fax +86 571 2886 5618
Email xiaohongwei1@foxmail.com Jin-Hua Liu
Room 318, Building 9, Xia Sha Campus, Hangzhou Normal University, 16 Xue-Ling Road, Hangzhou, 310036, People’s Republic of China
Tel +86 571 2886 9344 Fax +86 571 2886 5618 Email jinhua903@163.com
Background and methods: A new cyclosporin A-loaded, PEGylated chitosan-modified lipid-based nanoparticle was developed to improve upon the formulation of cyclosporin A. PEGylated chitosan, synthesized in three steps using mild reaction conditions, was used to modify the nanoparticles. Cyclosporin A-loaded, PEGylated chitosan-modified nanoparticles were prepared using an emulsification/solvent evaporation method. The drug content and encapsulation efficiency of the cyclosporin A-loaded, PEGylated chitosan-modified nanoparticles were measured by high-performance liquid chromatography. The average size of the nanoparticles was determined by transmission electron microscopy and dynamic light scattering. The pharmacokinetic behavior of the nanoparticles was investigated in rabbits after intravenous injection. Cyclosporin A concentrations in a whole blood sample were analyzed by high-performance liquid chromatography using tamoxifen as the internal standard. The pharmacokinetic parameters were calculated using the 3p87 software program.
Results: Fourier transform infrared spectroscopy and nuclear magnetic resonance confirmed the structure of PEGylated chitosan. The drug content and encapsulation efficiency of the cyclosporin A-loaded, PEGylated chitosan-modified nanoparticles were 37.04% and 69.22%, respectively. The average size of the nanoparticles was 89.4 nm. The nanoparticles released 30% cyclosporin A-loaded in 48 hours in vitro, with no initial burst release. The mode of release in vitro was prone to bulk erosion. The in vivo results showed the biological half-life of the elimination phase (t1/2β) of the nanoparticles was 21 times longer than that of the cyclosporin A solution, and the area under the curve for the nanoparticles was 25.8 times greater than that of the cyclosporin A solution.
Conclusion: Modification of PEGylated chitosan prolonged the retention time of the nanoparticles in the circulatory system and improved the bioavailability of cyclosporin A.
Keywords: nanoparticle, PEGylation, chitosan, pharmacokinetics, cyclosporin A, long circulation, bioavailability
Introduction
Cyclosporin A is one of the most effective immunosuppressive drugs. It inhibits T lymphocyte function, which plays an important role in induction of the immune response. Immune responses usually occur following organ transplants, such as liver, kidney, and bone marrow.1–3 However, cyclosporin A is a poorly water-soluble cyclic
peptide comprising 11 amino acids. Use of cyclosporin A has been limited by several disadvantages, including low bioavailability, a narrow therapeutic window, nephrotoxicity, hepatotoxicity, and neurotoxicity.4–7 Moreover, cyclosporin A injection is limited in patients
who are unable to take oral preparations because it carries a risk of anaphylactic shock
Dove
press
O R I g I N A L R E S E A R C H
open access to scientific and medical research
Open Access Full Text Article
International Journal of Nanomedicine downloaded from https://www.dovepress.com/ by 118.70.13.36 on 23-Aug-2020
For personal use only.
Number of times this article has been viewed
This article was published in the following Dove Press journal: International Journal of Nanomedicine
and nephrotoxicity due to Cremophor EL®, a solubilizing agent
used in the commercial intravenous formulation.8–10 Because of
the disadvantages of the commercial products discussed above, there is great interest in development of alternative dosage forms,11 including a solid dispersion,12 polymer nanoparticles,13
and lipid-based formulations.14,15 Many papers16,17 have verified
that the cyclosporin A released from nanoparticle formulations maintain or improve the efficiency of the immune response.
Lecithin vesicles can be used in lipid-based formulations. Lecithin derived from biological phospholipids is biodegradable, shows a relative lack of immunogenicity, and has low intrinsic toxicity.18 However, lecithin vesicles are detected by the host
defense system rapidly because they are absorbed by proteins/ cells and lack steric stability in the systemic circulation.19
Therefore, certain biodegradable polymers can be used to modify the surface of lipid-based nanoparticles. These modified lipid-based nanoparticles may enhance the delivery of drugs, increase drug uptake, and reduce drug toxicity. Poly(ethylene glycol) (PEG) is nontoxic and is eliminated by a combination of renal and hepatic pathways, which makes it ideal for use in pharmaceutical applications. It may be dissolved in both organic solvents and water. The US Food and Drug Administration has approved PEG for intravenous, oral, and dermal applications in humans.20 PEG has the lowest level of protein and cellular
absorption among the known polymers.21 These properties
have been exploited in numerous ways, including grafting/ mixing PEG to the surfaces of micro/nanoparticles to prevent deposition of proteinaceous material.22,23 Chitosan24–27 is also a
compatible, biodegradable, and nontoxic polymer. Its cationic properties may be useful for neutralizing the negative surfaces of lipid-based nanoparticles. PEGylated chitosan is a graft polymer that has been synthesized by our group, as previously reported.28 It was synthesized using a novel procedure and
linkage by our group. We hypothesized that using PEGylated chitosan would enable nontoxic cyclosporin A-loaded, lipid-based nanoparticles to circulate for a long time in the blood system and increase the stability of the nanoparticles.
In this study, we prepared cyclosporin A-loaded, PEGylated chitosan-modified, lipid-based nanoparticles. The morphology of the nanoparticle and its in vitro release was measured. The pharmacokinetic behavior of the nanoparticles in rabbits was also evaluated.
Materials and methods
Materials
Cyclosporin A was kindly donated by the Huadong Pharma-ceutical Factory (Hangzhou, People’s Republic of China). Chitosan (molecular weight 120,000 with 75%–85%
deacetylation) and mPEG5000 were purchased from Sigma-Aldrich Chemical Company (St Louis, MO, USA). Soybean lecithin was purchased from the Lipoid Company (Ludwig-shafen, Germany). All other chemicals were of analytical or chromatographic grade and used without further purification.
Synthesis of mPEg-grafted chitosan
Methoxypolyethyleneglycol (mPEG)-grafted chitosan was obtained in three steps using the method described in our previous paper.28 In brief, the hydroxyl groups at the end of
mPEG5000 were converted to carboxyl groups and succinyl esters. mPEG was first converted to mPEG-Su-COOH using succinic anhydride. The condensation compound, mPEG-Su-COONSu, was then obtained via the reaction between mPEG-Su-COOH and N-hydroxy-succinamide catalyzed by N,N′-dicyclohexyl carbodiimide. Finally, PEGylated chitosan was obtained by a condensation reaction between the -NH2 group on chitosan and the -COONSu group on mPEG-Su-COONSu. The whole synthetic scheme for mPEG-CO-(NH-chitosan) is shown in Figure 1.
Fourier transform infrared analyses of mPEG, mPEG- COOH, mPEG-Su-COONSu, and mPEG-CO-(NH-chitosan) were performed using an infrared spectrophotometer (IR-460, Shimadzu, Japan). The 1H nuclear magnetic resonance (NMR)
spectrum for mPEG-CO-(NH-chitosan) was recorded using an Avance DMX500 spectrometer (Bruker, Ettlingen, Germany) at 500 mHz in dimethyl sulfoxide.
Many papers29,30 have reported that PEGylated chitosan
has low cytotoxicity. The method used for calculating the ratio of PEG grafted to the chitosan backbone was as follows:
Graft ratio = N1/N0
where N0 is the molar number of the NH2 groups on chitosan at the beginning of synthesis, and N1 is the molar number of PEG chains grafted to chitosan after the complete reaction. The weight of the grafted PEG chains was obtained from the difference between the weight of PEGylated chitosan and the initial weight of chitosan.
Preparation of cyclosporin A-loaded,
PEGylated chitosan-modified
nanoparticles
The nanoparticles were prepared using a modified emulsifica-tion/solvent evaporation method. Cyclosporin A and soybean lecithin were dissolved in the solvent mixture (methylene chloride to acetone ratio, 3:1) as solution A. PEGylated chi-tosan and Poloxamer were dissolved in an aqueous solution
Dovepress Zhang et al
International Journal of Nanomedicine downloaded from https://www.dovepress.com/ by 118.70.13.36 on 23-Aug-2020
as solution B. Solution A was injected slowly into Solution B under fast magnetic stirring, followed by ultrasonic dis-persion with a probe-type ultrasonicator (400 W, JY92-II, Ningbo Xinzhi Scientific Instrument Institute, Zhejiang, People’s Republic of China). The ultrasonic treatments were performed 60 times, with one second of sonication followed by a 3-second interval in an ice bath. The methylene chlo-ride and acetone in the resulting emulsion were removed under reduced pressure using a rotovap (RE-52C, Ya-Rong Biochemical Instrument Factory, Shanghai, People’s Repub-lic of China) at room temperature. The whole dispersion system was then centrifuged (Hereaus Instruments, Thermo,
Germany) at 12,000 × g for 30 minutes at 4°C to obtain the precipitates. An aqueous solution was obtained by dissolv-ing the precipitate in water. A cellulose ester filter (0.22 µm, Millipore, Billerica, MA, USA) was used to separate micro-spheres or agglomerates from this solution. The final product was freeze-dried in the presence of 10% (w/v) sorbitol.
Morphology of cyclosporin A-loaded,
PEGylated chitosan-modified
nanoparticles
Transmission electron microscopy (TEM) was performed using a JEM-1200EX instrument (JEOL, Tokyo, Japan)
CH3(OCH2CH2)nOCH2CH2OH
Pyridine
R T Stirred 24 hr
O
O
O
O
O O
O O
OH H
H H
H
H H
H
H NH C CH3
H OH
H H O H
O O
O
n O O H NH2
CH2OH
O O
OH H
H H
H NH2
CH2OH
CH2 OH
CH2OH
H H
H NH C CH3
H OH
O
n O O CH2OH
NH2
H
H H H
H O
O O CH2 OH
NH
O N N HO
DCC
O
O
O
CH3(OCH2CH2)nOCH2CH2OCCH2CH2COOH
CH3(OCH2CH2)nOCH2CH2OCCH2CH2COO
CH3(OCH2CH2)nOCH2CH2OCCH2CH2CO
+
Figure 1 Synthetic scheme for mPEg-CO-(NH-chitosan).
Abbreviation: RT, room temperature.
Dovepress Cyclosporin A-loaded, PEGylated chitosan-modified, lipid-based nanoparticles
International Journal of Nanomedicine downloaded from https://www.dovepress.com/ by 118.70.13.36 on 23-Aug-2020
operating at 100 kV. The TEM samples were obtained by diluting a 1 mg/mL suspension of cyclosporin A-loaded, PEGylated chitosan-modified nanoparticles with phosphate-buffered saline at pH 7.4 to 2.5% (w/v) with ultrapure water. The sample solution was stained with 1% osmium tetroxide. The solution was then dropped onto carbon-coated copper grids and dried at room temperature before measurement.
The mean size and size distribution of the cyclosporin A-loaded, PEGylated chitosan-modified nanoparticles were measured by dynamic light scattering using a Zetasizer (3000HS, Malvern Instruments Ltd, Worcestershire, UK) in ultrafine water. The zeta potential of the nanoparticles was also measured using the Zetasizer. Each sample was measured three times, and the values are reported as the mean diameter ± standard deviation.
Determination of drug content
and encapsulation efficiency
The cyclosporin A concentration in the preparation and in vitro release samples was analyzed by high-performance liquid chromatography performed on an Agilent system consisting of an 1100 isopump (Hypersil 5 µm ODS2 4.6 × 250 mm). The mobile phase was a mixture of acetonitrile and water (85:15 v/v) with 0.16% phosphoric acid. The detection wavelength was 221 nm. The column temperature was 70°C, the flow rate was 1.0 mL per minute, and the injected volume of the sample was 20 µL. The retention time of cyclosporin A in this mobile phase was 8.161 minutes. The drug content and encapsulation efficiency were determined by high-performance liquid chromatography measurement.
Acetonitrile was used to extract cyclosporin A thoroughly from the nanoparticles. The mixture of cyclosporin A nanoparticles in acetonitrile was vortexed and centrifuged at 5000 rpm for 10 minutes to remove the precipitated excipients. The supernatant was collected for measurement. The diluted cyclosporin A concentration was calculated according to a cyclosporin A standard curve. The encapsulation efficiency and drug content of the cyclosporin A-loaded nanoparticles were calculated as reported elsewhere.31,32 The equations
were as follows:
Encapsulation efficiency % = (Loaded drug weight/ Initially fed drug weight) × 100
Drug content % = (Total weight of drug in nanoparticles/ Total weight of drug and polymer of nanoparticles) × 100
In vitro release studies
Release of cyclosporin A from the nanoparticles was determined by the dialysis method. A suspension of cyclosporin A-loaded, PEGylated chitosan-modified nanoparticles in 100 mL of 0.1 M phosphate buffer (pH 7.4) was transferred into a dialysis bag (molecular weight cutoff 3500). This bag was placed in a brown flask filled with 0.1 M phosphate buffer (pH 7.4). The total concentration of cyclosporin A in this flask was maintained under sink conditions, meaning that the total cyclosporin A concentration in this flask was maintained at 1/3–1/7 of the concentration of cyclosporin A in saturated solution. The whole release system was stirred at room temperature. At a predetermined time point, 1 mL of solution was sampled from the flask and the same volume of fresh medium was added. The amount of cyclosporin A released into the medium was analyzed by high-performance liquid chromatography.
Bioavailability study
Five rabbits weighing approximately 2 kg were selected for this study. The rabbits were fasted for 12 hours before administration of the trial preparation and for the whole experiment (only water was permitted during this period). A single intravenous dose equivalent to 5 mg cyclosporin A per kg weight of the rabbit was injected into the auricular vein in the form of cyclosporin A-loaded, PEGylated chitosan-modified nanoparticles, cyclosporin A-loaded, chitosan-modified nanoparticles, or cyclosporin A solution (formulation: 50 mg cyclosporin A was dissolved in 0.32 mL of ethanol and 650 mg of Cremophor was added to assist the solubility of cyclosporin A). Prior to injection, the solution was diluted to 5 mL by sterile saline (0.9% NaCl). At predetermined time intervals (0, 2, 5, 10, 20, and 40 minutes, and at 1, 2, 4, 8, 12, and 24 hours), blood samples were drawn from the auricular artery of the rabbits into heparin-containing tubes.
To determine the concentration of cyclosporin A in the blood samples correctly, tamoxifen was used as an internal standard for high-performance liquid chromatography measurement.33 A 50 µL tamoxifen/methanol (2.5 µg/mL)
internal standard solution was added to a 400 µL blood sample. After a few minutes, 1.75 mL of deionized water was added. The red solution turned brown after 200 µL of NaOH (1 M) and 4 mL of ether-methanol (95:5) were added. Cyclosporin A and tamoxifen were extracted into the organic layer. The organic layer was separated by vortexing for 30 seconds. Organic solvents, including ether and methanol, were evaporated in a N2 atmosphere in a 50°C water bath.
Dovepress Zhang et al
International Journal of Nanomedicine downloaded from https://www.dovepress.com/ by 118.70.13.36 on 23-Aug-2020
The resulting deposit, ie, the cyclosporin A and tamoxifen extract, was stored at -20°C.
Before measurement using high-performance liquid chromatography, the cyclosporin A and tamoxifen extract were resuspended in 200 µL of acetonitrile:0.5% (v/v) phosphoric acid solution (65:35, v/v). To this resuspension, 1 mL of n-hexane was added, and the solution was vortexed. After centrifuging, the bottom layer of the solution was used for high-performance liquid chromatographic analysis.
High-performance liquid chromatographic analysis of the in vivo samples was performed on an Agilent system (Hypersil 5 µm ODS2 4.6 × 250 mm column) with a 1100 isopump. The mobile phase was a mixture of methanol:acetonitrile: monopotassium phosphate 0.01 M (57:25:18, v/v/v). The detection wavelength was 205 nm. The flow rate was 1.0 mL per minute, and the injected volume of the sample was 20 µL. The retention time of cyclosporin A was 9.948 minutes, while the retention time of tamoxifen was 13.89 minutes.
Results and discussion
Preparation of cyclosporin A-loaded,
PEGylated chitosan-modified
nanoparticles
As reported in our previous paper,28 the structure of PEGylated
chitosan was confirmed by Fourier transform infrared spectroscopy and NMR experiments (Supplementary Material and Figure S1). This synthetic procedure and the linkage between PEG and chitosan were reported by us for the first time. The conditions used in the synthesis were mild, although the time taken to finish the whole process was lengthy. The cyclosporin A-loaded nanoparticles were prepared using a modified emulsion/solvent evaporation technique.
In this formulation, soybean lecithin was selected as a carrier. The crystal nucleus of cyclosporin A was first separated out following evaporation of the organic solvent. Lecithin was deposited on the cyclosporin A nucleus as a result. As this occurred, interactions developed between the polar groups of lecithin and the amino/hydroxyl groups of PEGylated chitosan. These two segments wrapped around each other and changed the electronic properties of the nanoparticle surface. Moreover, the solubility of cyclosporin A in lecithin was increased because of the similar polar properties of these two substances.
PEGylated chitosan has the hydrophilic PEG segment and the hydrophobic backbone of chitosan, so it acts not only as a cationic polymer to coat the lecithin carrier but also as an
emulsion stabilizer in this formulation. The Poloxamer present in this formulation increased the PEGylated chitosan dissolution in the Poloxamer/water mixture and enhanced the stability of the emulsion. Therefore, the function of PEGylated chitosan in our formulation was used to modify the lipid-based nanoparticles. PEGylated chitosan-modified nanoparticles are different from nanoparticles using PEGylated chitosan as a carrier23 and those
using chitosan to coat lipid nanoparticles.25
Morphology of cyclosporin A-loaded,
PEGylated chitosan-modified
nanoparticles
Figures 2 and 3 show the morphology of the cyclosporin A-loaded, PEGylated chitosan-modified nanoparticles. Dynamic light scattering revealed that the average diameter of the majority of the PEGylated chitosan-modified nanoparticles was 89.3 nm. The polydispersity index of the nanoparticles was 0.456. The diameters of nanoparticles measured by TEM were smaller than the data obtained from dynamic light scattering analysis because of the vacuum-drying conditions required for TEM. Moreover, although the zeta potential of the cyclosporin A-loaded, PEGylated chitosan-modified nanoparticles was low (-8.5 mV), a majority of the nanoparticles had a uniform, monodispersed, nonaggregated morphology. This unusual morphology may be in part due to the nonreactive PEG chains. There are many hydroxyl groups on the PEG chain, which may develop hydrogen bonds with water molecules. Therefore, the conformational entropy is lowered and the interfacial free energy of PEG chains in water is reduced. Thus, a large exclusion volume developed around the nanoparticles. This phenomenon was also called steric hindrance or steric stability. All the nanoparticles dispersed uniformly without adhesion.
The zeta potential of the cyclosporin A-loaded, PEGylated chitosan-modified nanoparticles and the chitosan-modified nanoparticles was -8.5 mV and +15.2 mV, respectively. In these two formulations, the amount of PEGylated chitosan and chitosan fed was initially the same. Thus, the molar equivalents of the free amine groups of chitosan were more than that of PEGylated chitosan. The zeta potential values were +15.2 mV (chitosan-modified nanoparticles), -8.5 mV (PEGylated chitosan-modified nanoparticles), and -17.5 mV (pure lipid nanoparticles). The near zero value of the zeta potential for the PEGylated chitosan-modified nanoparticles also confirmed that PEGylated chitosan was indeed deposited on the lecithin carrier. The nanoparticles with a near neutral charge were safer than those with a positive charge because
Dovepress Cyclosporin A-loaded, PEGylated chitosan-modified, lipid-based nanoparticles
International Journal of Nanomedicine downloaded from https://www.dovepress.com/ by 118.70.13.36 on 23-Aug-2020
cationic nanoparticles and biomaterials would lead to electrostatic interaction with in vivo biomacromolecules, such as protein and DNA, and induce cytotoxicity in nonspecific cells.
Determination of drug content
and encapsulation efficiency
The drug content was 37.04% in the cyclosporin A-loaded, PEGylated chitosan-modified nanoparticle formulation, while the encapsulation efficiency was 69.22%. This encapsulation
efficiency value is higher than that of nanoparticles prepared by a chitosan-tripolyphosphate cross-link reaction.34,35 The
encapsulation efficiency value depended on the high affinity between cyclosporin A and lecithin. Moreover, the low solubility of cyclosporin A in aqueous Poloxamer solution also helped to increase encapsulation efficiency.
In vitro release study
The amount of cyclosporin A released into the medium was analyzed by high-performance liquid chromatography.
5 10
A B
50 100
Diameter (mm) Size distributions(s)
500
Figure 2 Morphology of cyclosporin A-loaded, PEGylated chitosan-modified nanoparticles. (A) Transmission electron microscopy graph (bar, 50 nm) and (B) dynamic light scattering graph.
−200 −100 8
6
4
2
15
10
5
0 100 200 −200 −100 0
Zeta potential (mV) Zeta potential (mV)
Intensity
Intensity
100 200
Figure 3 Zeta potential of cyclosporin A-loaded chitosan-modified nanoparticle (left); zeta potential of cyclosporin A-loaded, PEGylated chitosan-modified nanoparticle (right).
Dovepress Zhang et al
International Journal of Nanomedicine downloaded from https://www.dovepress.com/ by 118.70.13.36 on 23-Aug-2020
Figure 4 shows the percentage of cyclosporin A released from the nanoparticles.
The profile showed that the percentage of cyclosporin A released from the nanoparticles was 32.6% after 48 hours, compared with less than 4% after 52 hours for free cyclosporin A in the saturated solution. When the poorly soluble drug, cyclosporin A, was dispersed in a nanoparticle formulation, the amount of cyclosporin A released from the nanoparticles increased. To understand the mode of drug release from the nanoparticles, the release data were analyzed according to the prediction equation proposed by Korsmeyer et al36 and
Lee and Peppas.37
Q = Mt/M0= K × tn
where Mt/M0 is the percentage of drug released, t is time, K is the constant associated with the characteristics of the geometry skeleton of the release system, and n is the release index representing the release mechanism. If n = 0.5, the release mode was predicted to be bulk erosion release, while 0.66 , n , 1 represented a diffusion release system.
The result of the simulation was:
Q = 0.3144t1/2, r = 0.9656
Therefore, n = 1/2. The value of n indicated that the release mode of cyclosporin A from the PEGylated chitosan nanoparticles was prone to bulk erosion release.
Bioavailability study
Because metabolites of cyclosporin A are found in vivo, high-performance liquid chromatography has been used by many researchers to measure cyclosporin A in samples33,38
because of its sensitivity and specificity. Moreover, to measure the cyclosporin A concentration in blood accurately, tamoxifen is used as the internal standard for high-performance liquid chromatography.
Figure 5 shows the plasma drug concentrations at different time points in rabbits after intravenous injection with cyclosporin A-loaded, PEGylated chitosan-modified nanoparticles, cyclosporin A-loaded chitosan-modified nanoparticles, and cyclosporin A solution.
Many mathematical models39 including single and two
compartment models can be used for pharmacokinetic analysis. The single compartment model depicts the body as a single, kinetically homogeneous unit. The two compartment model assumes that the whole body is divided into two compartments, ie, a central compartment (including the blood and all readily accessible fluids and tissues, such as the liver and kidney) and a peripheral compartment (including all poorly perfused tissues). Compared with the simple single compartment model, the two compartment model is more reasonable and more practical. According to Akaike’s information criterion and the degree of fitting (r2) in pharmacokinetics, the two-compartment open model
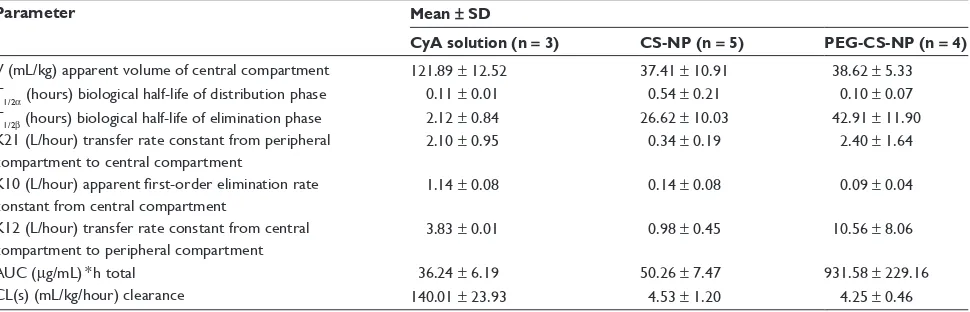
was chosen to analyze the data in our experiment. 3p87, a practical pharmacokinetic software program devised by the Chinese Pharmacological Society, was used to analyze these data. The pharmacokinetic parameters are shown in Table 1.
Our in vivo results show that the elimination half-life (t1/2β) of the nanoparticles was 21 times longer than that of the cyclosporin A solution, and the area under the curve for the nanoparticles was 25.8 times larger than that for the cyclosporin A solution. These observations suggest
40
30
20
10
0
0 10 20 30
Time (hr)
% released
40 50 60
Figure 4 In vitro release profiles of cyclosporin A-loaded, PEGylated chitosan- modified nanoparticle () and free cyclosporin A in saturated aqueous solution ().
120
100
80
60
40
20
−20 0
0 5 10 15
Time (hr)
Plasma drug concentration
(
µ
g/mL)
20
PEGylated chitosan modified nanoparticles Cy-A solution
Chitosan modified nanoparticles
25 30
Figure 5 Plasma drug concentrations at different time points after intravenous injection in rabbits treated with cyclosporin A-loaded, PEGylated chitosan-modified nanoparticles (), cyclosporin A-loaded, chitosan-modified nanoparticles (), and cyclosporin A solution ().
Dovepress Cyclosporin A-loaded, PEGylated chitosan-modified, lipid-based nanoparticles
International Journal of Nanomedicine downloaded from https://www.dovepress.com/ by 118.70.13.36 on 23-Aug-2020
that the PEG chains provided the nanoparticles with stabilizing properties. The conformational clouds of PEG hindered interaction between the proteins in plasma and the nanoparticles, reduced the number of nanoparticles identified and taken up by mononuclear macrophage cells, prolonged the retention time of the nanoparticles in the circulation, and improved their bioavailability.
Conclusion
In this study, we prepared cyclosporin A-loaded, PEGylated chitosan-modified nanoparticles using an emulsification/ solvent evaporation technique with high encapsulation efficiency and monodispersion properties. From the in vitro release test, we found that the release profiles of the nanoparticles approximated bulk erosion release kinetics in the first 52 hours, with a negligible initial burst. These results indicate that PEGylated chitosan-modified, lipid-based nanoparticles can be useful in providing new opportunities to improve cyclosporin A formulations. These formulations may possibly endow nanoparticles with a long circulation time and the bioavailability of cyclosporin A may be increased.
Acknowledgments
We would like to thank the National Natural Science Foundation of China (30973683, 21275038) and Zhejiang Provincial Natural Science Foundation (Y2090477) for their financial support. This work was also sponsored by the Qianjiang Talents Project (2001R10059) from the Department of Science and Technology in Zhejiang Province and Medicine Project (20100633B09) by the Hangzhou Science and Technology Bureau.
Disclosure
The authors report no conflicts of interest in this work.
References
1. Pillai AA, Levitsky J. Overview of immunosuppression in liver transplantation. World J Gastroenterol. 2009;15:4225–4233. 2. Chadban S. New-onset diabetes after transplantation – should it be a
factor in choosing an immunosuppressant regimen for kidney transplant recipients? Nephrol Dial Transplant. 2008;23:1816–1818.
3. Przepiorka D, Devine SM, Fay JW, Uberti JP, Wingard JR. Practical considerations in the use of tacrolimus for allogeneic marrow transplantation. Bone Marrow Transplant. 1999;24:1053–1056. 4. Bobadilla NA, Gamba G. New insights into the pathophysiology of
cyclosporine nephrotoxicity: a role of aldosterone. Am J Physiol Renal Physiol. 2007;293:F2–F9.
5. Wijdicks EF. Neurotoxicity of immunosuppressive drugs. Liver Transpl. 2001;7:937–942.
6. Ginsburg PM, Thuluvath PJ. Diarrhea in liver transplant recipients: etiology and management. Liver Transpl. 2005;11:881–890. 7. Tedesco D, Haragsim L. Cyclosporine: a review. J Transplant. 2012;
2012:230386.
8. Roby KA, Shaw LM. Effects of cyclosporine and its metabolites in the isolated perfused rat kidney. J Am Soc Nephrol. 1993;4:168–177. 9. Beauchesne PR, Chung NS, Wasan KM. Cyclosporine A: a review of
current oral and intravenous delivery systems. Drug Dev Ind Pharm. 2007;33:211–220.
10. Italia JL, Bhardwaj V, Ravi Kumar MN. Disease, destination, dose and delivery aspects of ciclosporin: the state of the art. Drug Discov Today. 2006;11:846–854.
11. Andrysek T. Impact of physical properties of formulations on bioavailability of active substance: current and novel drugs with cyclosporine. Mol Immunol. 2003;39:1061–1065.
12. Onoue S, Sato H, Kawabata Y, Mizumoto T, Hashimoto N, Yamada S. In vitro and in vivo characterization on amorphous solid dispersion of cyclosporine A for inhalation therapy. J Control Release. 2009;138: 16–23.
13. Al-Meshal MA, Khidr SH, Bayomi MA, Al-Angary AA. Oral administration of liposomes containing cyclosporine: a pharmacokinetic study. Int J Pharm. 1998;168:163–168.
14. Italia JL, Bhatt DK, Bhardwaj V, Tikoo K, Ravi Kumar MNV. PLGA nanoparticles for oral delivery of cyclosporine: nephrotoxicity and pharmacokinetic studies in comparison to Sandimmune Neoral®.
J Control Release. 2007;119:197–206.
Table 1 Comparison of pharmacokinetic parameters of cyclosporin A solution, chitosan-modified nanoparticles, and PEGylated chitosan-modified nanoparticles as a two-compartment model after intravenous injection (n = 3–5)
Parameter Mean ± SD
CyA solution (n = 3) CS-NP (n = 5) PEG-CS-NP (n = 4)
V (mL/kg) apparent volume of central compartment 121.89 ± 12.52 37.41 ± 10.91 38.62 ± 5.33 T1/2α (hours) biological half-life of distribution phase 0.11 ± 0.01 0.54 ± 0.21 0.10 ± 0.07 T1/2β (hours) biological half-life of elimination phase 2.12 ± 0.84 26.62 ± 10.03 42.91 ± 11.90 K21 (L/hour) transfer rate constant from peripheral
compartment to central compartment
2.10 ± 0.95 0.34 ± 0.19 2.40 ± 1.64
K10 (L/hour) apparent first-order elimination rate
constant from central compartment
1.14 ± 0.08 0.14 ± 0.08 0.09 ± 0.04 K12 (L/hour) transfer rate constant from central
compartment to peripheral compartment
3.83 ± 0.01 0.98 ± 0.45 10.56 ± 8.06
AUC (µg/mL) * h total 36.24 ± 6.19 50.26 ± 7.47 931.58 ± 229.16
CL(s) (mL/kg/hour) clearance 140.01 ± 23.93 4.53 ± 1.20 4.25 ± 0.46 Abbreviations: AUC, area under plasma drug concentration versus time curve; CyA, cyclosporin A; CS-NP, chitosan-modified nanoparticles; PEG-CS-NP, PEGylated chitosan-modified nanoparticles; SD, standard deviation.
Dovepress Zhang et al
International Journal of Nanomedicine downloaded from https://www.dovepress.com/ by 118.70.13.36 on 23-Aug-2020
15. Müller RH, Runge SA, Ravelli V, Thünemann AF, Mehnert W, Souto EB. Cyclosporine-loaded solid lipid nanoparticles (SLN®): drug–lipid physicochemical interactions and characterization of drug incorporation. Eur J Pharm Biopharm. 2008;68:535–544.
16. Azzi J, Tang L, Moore R, et al. Polylactide-cyclosporin A nanoparticles for targeted immunosuppression. FASEB J. 2010;24:3927–3938. 17. Frusic-Zlotkin M, Soroka Y, Tivony R, et al. Penetration and biological
effects of topically applied cyclosporin A nanoparticles in a human skin organ culture inflammatory model nanoparticles in a human skin organ culture inflammatory model. Exp Dermatol. 2012;21:938–943. 18. Vadiei K, Perez-Soler R, Lopez-Berestein G, Luke DR.
Pharmacoki-netic and pharmacodynamic evaluation of liposomal cyclosporine. Int J Pharm. 1989;57:125–131.
19. Woodle MC. Sterically stabilized liposome therapeutics. Adv Drug Deliv Rev. 1995;16:249–265.
20. Veronese FM, Pasut G. PEGylation, successful approach to drug delivery. Drug Discov Today. 2005;10:1451–1458.
21. Hooftman G, Herman S, Schacht E. Review: poly(ethylene glycol)s with reactive endgroups. II. Practical consideration for the preparation of protein-PEG conjugates. J Bioact Compat Polym. 1996;11: 135–159.
22. Kataoka K, Kwon GS, Yokoyama M, Okano T, Sakurai Y. Block copolymer micelles as vehicles for drug delivery. J Control Release. 1993;24:119–132.
23. Bhattarai N, Ramay HR, Gunn J, Matsen FA, Zhang M. PEG-grafted chitosan as an injectable thermosensitive hydrogel for sustained protein release. J Control Release. 2005;103:609–624.
24. Kean T, Thanou M. Biodegradation, biodistribution and toxicity of chitosan. Adv Drug Deliv Rev. 2010;62:3–11.
25. Prego C, Torres M, Garcıa D, Alonso MJ. Transmucosal macromo-lecular drug delivery. J Control Release. 2005;101:151–162. 26. Guzman E, Cavallo JA, Chulia-Jordan R, et al. pH-induced changes
in the fabrication of multilayers of poly(acrylic acid) and chitosan: fabrication, properties, and tests as a drug storage and delivery system. Langmuir. 2011;27:6836–6845.
27. Guzman E, Chulia-Jordan R, Ortega F, Rubio RG. Influence of the per-centage of acetylation on the assembly of LbL multilayers of poly(acrylic acid) and chitosan. Phys Chem Chem Phys. 2011;13:18200–18207.
28. Wei XH, Liang WQ. The preparation and characterization of mPEGy-lated chitosan as a gene vector. Chinese J Modern Appl Pharm. 2003;20:383–385.
29. Chan P, Kurisawa M, Chung JE, Yang Y-Y. Synthesis and characteriza-tion of chitosan-g-poly (ethylene glycol)-folate as a non-viral carrier for tumor-targeted gene delivery. Biomaterials. 2007;28:540–549. 30. Jie L-Y, Cai L-L, Wang L-J, et al. Actively-targeted LTVSPWY
peptide-modified magnetic nanoparticles for tumor imaging. Int J Nanomedicine. 2012;7:3981–3989.
31. Hu F-Q, Meng P, Dai Y-Q, et al. PEGylated chitosan-based polymer micelle as an intracellular delivery carrier for anti-tumor targeting therapy. Eur J Pharm Biopharm. 2008;70:749–757.
32. Wei X-H, Niu Y-P, Xu Y-Y, Du Y-Z, Hu F-Q, Yuan H. Salicylic acid-grafted chitosan oligosaccharide nanoparticle for paclitaxel delivery. J Bioact Compat Polym. 2010;25:319–335.
33. Chimalakonda AP, Shah RB, Mehvar R. High-performance liquid chromatographic analysis of cyclosporin A in rat blood and liver using a commercially available internal standard. J Chromatogr B Analyt Technol Biomed Life Sci. 2002;772:107–114.
34. Woranuch S, Yoksan R. Eugeno l-loaded chitosan nanoparticles: I. Thermal stability improvement of eugenol through encapsulation. Carbohydr Polym. 2012.
35. Tripathy S, Das S, Chakraborty SP, Sahu SK, Pramanik P, Roy S. Synthesis, characterization of chitosan–tripolyphosphate conjugated chloroquine nanoparticle and its in vivo anti-malarial efficacy against rodent parasite: A dose and duration dependent approach. Int J Pharm. 2012;434:292–305.
36. Korsmeyer RW, Gurny R, Doelker E, Buri P, Peppas NA. Mechanisms of solute release from porous hydrophilic polymers. Int J Pharm. 1983;15:25–35.
37. Lee PI, Peppas NA. Prediction of polymer dissolution in swellable controlled-release systems. J Control Release. 1987;6:207–215. 38. Shen J, Deng YP, Jin XF, Ping QE, Su ZG, Li LJ. Thiolated
nano-structured lipid carriers as a potential ocular drug delivery system for cyclosporine A: improving in vivo ocular distribution. Int J Clin Pharm. 2010;402:248–253.
39. Gibaldi M, Perrier D. Pharmacokinetics. Revised and Expanded, 2nd ed. New York, NY: Marcel Dekker; 1982.
Dovepress Cyclosporin A-loaded, PEGylated chitosan-modified, lipid-based nanoparticles
International Journal of Nanomedicine downloaded from https://www.dovepress.com/ by 118.70.13.36 on 23-Aug-2020
International Journal of Nanomedicine
Publish your work in this journal
Submit your manuscript here: http://www.dovepress.com/international-journal-of-nanomedicine-journal
The International Journal of Nanomedicine is an international, peer-reviewed journal focusing on the application of nanotechnology in diagnostics, therapeutics, and drug delivery systems throughout the biomedical field. This journal is indexed on PubMed Central, MedLine, CAS, SciSearch®, Current Contents®/Clinical Medicine,
Journal Citation Reports/Science Edition, EMBase, Scopus and the Elsevier Bibliographic databases. The manuscript management system is completely online and includes a very quick and fair peer-review system, which is all easy to use. Visit http://www.dovepress.com/ testimonials.php to read real quotes from published authors.
9 8 7 6 5 4 3 2 1
Integral
ppn
1.00 2.33 5.36 4.40 28.7
6
0.17 −0.46 3.79 2.77 1.08 3.15 3.29
5.5519
5
ppn
4.1091
7
3.6806
4
3.5079
2
3.3205
1
3.2390
9
2.5019
6
1.7088
8
1.6068
9
1.5192
9
1.2308
6
1.0527
0
86.11
394.43
Figure S1 1H nuclear magnetic resonance spectra of mPEg-CO-(NH-chitosan) in dimethyl sulfoxide.
Supplementary data
Structural characterization of PEgylated
chitosan
The structures of mPEG, mPEG-COOH, mPEG-Su-COONSu, and mPEG-CO-(NH-chitosan) were confirmed by Fourier transform infrared data as follows: mPEG (3400 cm-1, broad and blunt peak, hydroxyl group; 2900 cm-1,
saturated C-H; 1100 cm-1, CH
2OCH2.); mPEG-COOH
(3400 cm-1, broad and blunt peak, hydroxyl; 2900 cm-1
saturated C-H; 1110 cm-1, CH
2OCH2; 1738 cm-1, C=O.);
mPEG-Su-COONSu (3400 cm-1, broad and blunt, hydroxyl
group; 2900 cm-1 saturated C-H; 1114 cm-1, CH 2OCH2;
1740 cm-1, C=O, 1780 cm-1, 1812 cm-1, succinimide group);
mPEG-CO-(NH-chitosan) (3400 cm-1, broad and blunt,
hydroxyl; 2900 cm-1 saturated C-H; 1114 cm-1, CH 2OCH2;
1740 cm-1, C=O, becomes weaker, 1662 cm-1, 1586 cm-1,
the characteristic peak of the amide group of chitosan). The 1H-NMR spectrum of mPEG-CO-(NH-chitosan) in
dimethyl sulfoxide is shown in the Supplementary Figure S1. In the spectrum, there are four characteristic peaks, which indicate the target substance. ∆ 3.24 ppm (methyl group on head of mPEG); δ 3.24–3.68 ppm (-CH2CH2O, the repeated unit of mPEG); δ 5.55 ppm (hydrogen on the α-C adjacent to oxygen on the saccharide ring of chitosan); δ 8.3 ppm (hydrogen of amide group on the saccharide ring of chitosan). The data presented above indicate that mPEG was grafted successfully to the amino group of chitosan. The graft ratio of PEG to PEGylated chitosan was 16.71%.
Dovepress
Dove
press
Zhang et al
International Journal of Nanomedicine downloaded from https://www.dovepress.com/ by 118.70.13.36 on 23-Aug-2020