The effects of treated sewage effluent on three species of marine
macroalgae
A thesis submitted for the degree of Doctor of Philosophy
Mary-Anne Shir B. Sc. (Hons)
Sustainability Group Victoria University
STA THESIS
571.95298 SHI
30001007911011
Shir, Mary-Anne
Declaration
This thesis is submitted in accordance with the regulations of Victoria University in
fulfillment of the requirements for the degree of Doctor of Philosophy. This thesis
contains no material which has been accepted for the award of any other degree or
diploma in any university and no material previously published or written by another
person except where duly acknowledged or referenced.
Mary-Aime Shir
TABLE OF CONTENTS
Declaration i
Acknowledgements ii Index of figures Hi
Index of tables xvii
Index of appendices xxiii List of abbreviations and definitions xxvii
List of publications and conference presentations xxix
Abstract xxx
Chapter 1 - General Introduction 1
1.1 Introduction 1 1.1.1 Effluent discharge 1
1.1.2 Toxicity testing 2 1.1.3 Algal toxicity testing 4
1.2 Aims of this study 7
Chapter 2 - Materials and Methods 8
2.1 Collection 8 2.2 Test species and toxicity test endpoints 8
2.2.1 Phyllospora comosa 8 2.2.2 Hormosira banksii 10
2.2.3 Macrocystis angustifolia 11
2.2.4 Vibriofischeri 12
2.3 Dilution water 13 2.4 Test solutions 13
2.6 Specimen preparation for light and electron microscopy 16
2.6.1 Preparation of cultures 16
2.6.2 Fixative 16 2.6.3 Tissue preparation for light microscopy 16
2.6.4 Sample preparation for scarming electron microscopy 17 2.6.5 Sample preparation for transmission electron microscopy 18
2.7 Sectioning 18
2.7.1 Light microscopy 18 2.7.2 Transmission electron microscopy 19
2.8 Microscopy 19 2.8.1 Light microscopy 19
2.8.2 Scanning electron microscopy 19 2.8.3 Transmission electron microscopy .19
Chapter 3 - The effects of sewage effluent on germination of Phyllospora comosa,
Hormosira banksii and Macrocystis angustifolia 20
3.1 Introduction 20 3.1.1 Aims of this chapter 22
3.2 Results 23 3.2.1 Phyllospora comosa 23
3.2.2 Hormosira banksii 36 3.2.3 Macrocystis angustifolia 48
3.2.4 Sewage effluent and EC50 correlations 68
3.2.5 Test species sensitivity 69
3.3 Discussion 70 3.3.1 Relative sensitivity of test species 70
3.3.2 Temporal variability 73 3.3.3 Toxicity test endpoint comparisons 74
3.3.4 Treatment toxicity 75
Chapter 4 - The effects of sewage effluent on mortality of Phyllospora comosa and
Hormosira banksii 77
4.1 Introduction 77 4.1.1 Aims of this chapter 79
4.2 Results 80 4.2.1 Phyllospora comosa 80
4.2.2 Hormosira banksii 93 4.2.3 Sewage effluent and EC50 correlations 105
4.2.4 Test species sensitivity 105
4.3 Discussion 106 4.3.1 Relative sensitivity of test species 106
4.3.2 Treatment toxicity 108
4.3.3 Conclusion 108
Chapter 5 - The effects of sewage effluent on growth of Phyllospora comosa and
Hormosira banksii, and growth and reproduction of Macrocystis
angustifolia 109
5.1 Introduction 109 5.1.1 Aims of this chapter 110
5.2 Results I l l 5.2.1 Phyllospora comosa I l l
5.2.2 Hormosira banksii 120 5.2.3 Macrocystis angustifolia 128 5.2.4 Sewage effluent and EC50 correlations 138
5.2.5 Test species sensitivity 138
5.3 Discussion 139 5.3.1 Relative sensitivity of test species 139
5.3.2 Temporal variability 141 5.3.3 Toxicity test endpoint comparisons 141
5.3.4 Treatment toxicity 142
Chapter 6 - The effects of sewage effluent on bioluminescence of Vibrio
fischeri 144
6.1 Introduction 144 6.1.1 Aims of this chapter 145
6.2 Results 146 6.3 Discussion 150
6.3.1 Conclusion 151
Chapter 7 - The effects of sewage effluent on the morphology of Phyllospora comosa,
Hormosira banksii and Macrocystis angustifolia 152
7.7 Introduction 152 7.1.1 Aims of this chapter 153
7.2 Results 154 7.2.1 Phyllospora comosa 154
7.2.2 Hormosira banksii 162 7.2.3 Macrocystis angustifolia 168
7.3 Discussion 171 7.3.1 Conclusion 173
Chapter 8-General Discussion 174
8.1 Conclusions 181
References 182
Appendix 1 200
Appendix 2: Tables of test NOEC, LOEC and EC50 values for Phyllospora
comosa, Hormosira banksii and Macrocystic angustifolia germination
bioassays and Macrocystis angustifolia germination and germination tube
growth bioassays 201
Appendix 2.1 201
Appendix 2.3 203 Appendix 2.4 204 Appendix 2.5 205 Appendix 2.6 206 Appendix 2.7 207 Appendix 2.8 208 Appendix 2.9 209 Appendix 2.10 210 Appendix 2.11 211 Appendix 2.12 212 Appendix 2.13 213 Appendix 2.14 214 Appendix 2.15 215 Appendix 2.16 216 Appendix 2.17 217 Appendix 2.18 218 Appendix 2.19 219 Appendix 2.20 220
Appendix 3: Tables of test NOEC, LOEC and LC50 values for Phyllospora
comosa and Hormosira banksii mortality bioassays 221
Appendix 3.1 221 Appendix 3.2 222 Appendix 3.3 223 Appendix 3.4 224 Appendix 3.5 225 Appendix 3.6 226 Appendix 3.7 227 Appendix 3.8 228
A c k n o w l e d g e m e n t s
This thesis would not have been possible without the encouragement and assistance of many people. I am sincerely grateful to the following:
Dr Trevor Burridge for instigating my interest in marine ecotoxicology and motivating me throughout my candidature.
My fellow research students who included Stuart Campbell, Juanita Bite and Sue Pascoe for their support and encouragement. Thanks also to all the laboratory technicians over the years who offered constant assistance.
Jermy Stauber and fellow staff of CSIRO who provided fiinding for part of my research and gave invaluable feedback on manuscripts.
Victoria University for financial support through an Australian Postgraduate Award Scholarship.
Timothy Lavery for all his patience, love and support.
List of Figures
page
Figure 2.1 Collection site of macroalgal species. 9
Figure 3.1 Germination (Mean ± Standard Error) of Phyllospora comosa zygotes
exposed to copper (a) and chromium (b) for 48 hours. 23
Figure 3.2 Response over time of Phyllospora comosa zygotes exposed to copper (a) and
chromium (b) for 48 hours. EC50 ± 95% confidence intervals. 24
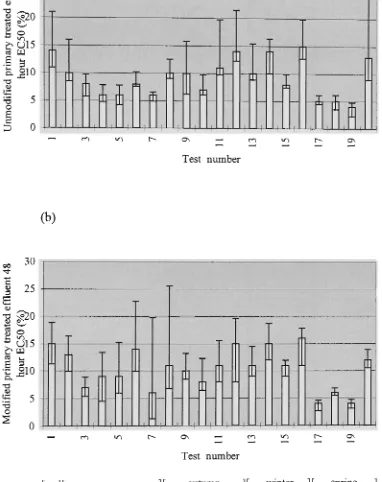
Figure 3.3 Germination (Mean ± Standard Error) of Phyllospora comosa zygotes
exposed to modified and unmodified primary treated effluent. 26
Figure 3.4 Response over time of Phyllospora comosa zygotes exposed to unmodified
(a) and modified (b) primary treated effluent for 48 hours. EC50 + 95% confidence
intervals. 27
Figure 3.5 Germination (Mean ± Standard Error) of Phyllospora comosa zygotes
exposed to modified and unmodified secondary treated effluent. 29
Figure 3.6 Response over time of Phyllospora comosa zygotes exposed to unmodified
(a) and modified (b) secondary treated effluent for 48 hours. EC50 ± 95% confidence
intervals. 30
Figure 3.7 Germination (Mean ± Standard Error) of Phyllospora comosa zygotes
exposed to modified and unmodified chlorinated secondary treated effluent. 32
Figure 3.8 Response over time of Phyllospora comosa zygotes exposed to unmodified
(a) and modified (b) chlorinated secondary treated effluent for 48 hours. EC50 ± 95%
Figure 3.9 Germination (Mean ± Standard Error) of Phyllospora comosa zygotes
exposed to varying salinity. 34
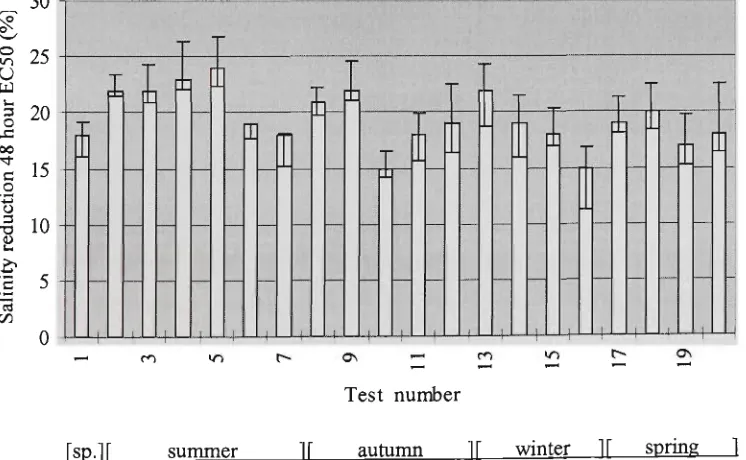
Figure 3.10 Response over time of Phyllospora comosa zygotes exposed to treatments of
reduced salinity for 48 hours. EC50 ± 95% confidence intervals. 35
Figure 3.11 Germination (Mean ± Standard Error) of Hormosira banksii zygotes exposed
to copper (a) and chromium (b) for 48 hours. 36
Figure 3.12 Response over time of Hormosira banksii zygotes exposed to copper (a) and
chromium (b) for 48 hours. EC50 ± 95% confidence intervals. 37
Figure 3.13 Germination (Mean ± Standard Error) of Hormosira banksii zygotes exposed
to modified and unmodified primary treated effluent. 39
Figure 3.14 Response over time of Hormosira banksii zygotes exposed to unmodified (a)
and modified (b) primary treated effluent for 48 hours. EC50 ± 95%) confidence intervals. 40
Figure 3.15 Germination (Mean ± Standard Error) of Hormosira banksii zygotes exposed
to modified and unmodified secondary treated effluent. 41
Figure 3.16 Response over time of Hormosira banksii zygotes exposed to unmodified (a)
and modified (b) secondary treated effluent for 48 hours. EC50 ± 95%
confidence intervals. 42
Figure 3.17 Germination (Mean ± Standard Error) of Hormosira banksii zygotes exposed
to modified and unmodified chlorinated secondary treated effluent. 44
Figure 3.18 Response over time of Hormosira banksii zygotes exposed to unmodified (a)
and modified (b) chlorinated secondary treated effluent for 48 hours. EC50 ± 95%)
Figure 3.19 Germination (Mean ± Standard Error) of Hormosira banksii zygotes exposed
to varying salinity. 46
Figure 3.20 Response over time of Hormosira banksii zygotes exposed to treatments of
reduced salinity for 48 hours. EC50 + 95% confidence intervals. 47
Figure 3.21 Germination (± 95% confidence interval) of Macrocystis angustifolia
spores exposed to copper (a) and chromium (b) for 48 hours. 49
Figure 3.22 Germination (a) and growth (b) response over time of Macrocystis
angustifolia spores exposed to copper for 48 hours. EC50 ± 95% confidence intervals. 50
Figure 3.23 Germination (a) and growth (b) response over time of Macrocystis
angustifolia spores exposed to chromium for 48 hours. EC50 ± 95% confidence intervals. 51
Figure 3.24 Germination (± 95%) confidence interval) of Macrocystis angustifolia
spores exposed to modified and unmodified primary treated effluent. 54
Figure 3.25 Germination (a) and growth (b) response over time of Macrocystis
angustifolia spores exposed to unmodified primary treated effluent for 48 hours. 55
EC50 ± 95%) confidence intervals.
Figure 3.26 Germination (a) and growth (b) response over time of Macrocystis angustifolia
spores exposed to modified primary treated effluent for 48 hours. EC50 ± 95% confidence
intervals. 56
Figure 3.27 Germination (± 95% confidence interval) of Macrocystis angustifolia spores
Figure 3.28 Germination (a) and growth (b) response over time of Macrocystis angustifolia
spores exposed to unmodified secondary treated effluent for 48 hours. EC50 ± 95%)
confidence intervals. 59
Figure 3.29 Germination (a) and growth (b) response over time of Macrocystis angustifolia
spores exposed to modified secondary treated effluent for 48 hours. EC50 + 95%)
confidence intervals. 60
Figure 3.30 Germination (± 95%) confidence interval) of Macrocystis angustifolia spores
exposed to modified and unmodified chlorinated secondary treated effluent. 62
Figure 3.31 Germination (a) and growth (b) response over time of Macrocystis angustifolia
spores exposed to unmodified chlorinated secondary treated effluent for 48 hours.
EC50 + 95% confidence intervals. 63
Figure 3.32 Germination (a) and growth (b) response over time of Macrocystis angustifolia
spores exposed to modified chlorinated secondary treated effluent for 48 hours.
EC50 ± 95%) confidence intervals. 64
Figure 3.33 Germination (Mean ± Standard Error) of Macrocystis angustifolia spores
exposed to varying salinity. 66
Figure 3.34 Germination (a) and growth (b) response over time of Macrocystis angustifolia
spores exposed to treatments of reduced salinity for 48 hours. EC50 ± 95% confidence
intervals. 67
Figure 4,1 Mortality (Mean ± Standard Error) of Phyllospora comosa zygotes exposed
to copper for 96 hours. 81
Figure 4.2 Mortality response over time of Phyllospora comosa embryos exposed to copper
Figure 4.3 Mortality (Mean ± Standard Error) of Phyllospora comosa zygotes exposed to
primary treated effluent for 96 hours. 83
Figure 4.4 Response over time of Phyllospora comosa embryos exposed to unmodified
(a) and modified (b) primary treated effluent for 96 hours. LC50 ± 95% confidence
intervals. 85
Figure 4.5 Mortality (Mean ± Standard Error) of Phyllospora comosa zygotes exposed to
secondary treated effluent for 96 hours. 86
Figure 4.6 Response over time of Phyllospora comosa embryos exposed to urunodified
(a) and modified (b) secondary treated effluent for 96 hours. LC50 ± 95%) confidence
intervals. 87
Figure 4.7 Mortality (Mean ± Standard Error) of Phyllospora comosa zygotes exposed
to chlorinated secondary treated effluent for 96 hours. 88
Figure 4.8 Response over time of Phyllospora comosa embryos exposed to unmodified
(a) and modified (b) chlorinated secondary treated effluent for 96 hours. LC50 ± 95%)
confidence intervals. 90
Figure 4.9 Mortality (Mean ± Standard Error) of Phyllospora comosa zygotes exposed
to reduced salinity for 96 hours. 91
Figure 4.10 Response over time of Phyllospora comosa embryos exposed to treatments
of reduced salinity for 96 hours. EC50 ± 95% confidence intervals. 91
Figure 4.11 Mortality (Mean ± Standard Error) of Hormosira banksii zygotes exposed
Figure 4.12 Mortality response over time of Hormosira banksii embryos exposed to
copper for 96 hours. LC50 ± 95%) confidence intervals. 94
Figure 4.13 Mortality (Mean ± Standard Error) of Hormosira banksii zygotes exposed to
primary treated effluent for 96 hours. 95
Figure 4.14 Response over time of Hormosira banksii embryos exposed to unmodified
(a) and modified (b) primary treated effluent for 96 hours. LC50 ± 95% confidence
intervals. 97
Figure 4.15 Mortality (Mean ± Standard Error) of Hormosira banksii zygotes exposed
to secondary treated effluent for 96 hours. 98
Figure 4.16 Response over time of Hormosira banksii embryos exposed to unmodified
(a) and modified (b) secondary treated effluent for 96 hours. LC50 ± 95%) confidence
intervals. 99
Figure 4.17 Mortality (Mean ± Standard Error) of Hormosira banksii zygotes exposed to
chlorinated secondary treated effluent for 96 hours. 100
Figure 4.18 Response over time of Hormosira banksii embryos exposed to unmodified (a) and modified (b) chlorinated secondary treated effluent for 96 hours. LC50 ± 95%)
confidence intervals. 101
Figure 4.19 Mortality (Mean ± Standard Error) ofH. banksii embryos exposed to reduced
salinity for 96 hours. 103
Figure 4.20 Response over time of Hormosira banksii embryos exposed to treatments of
Figure 5.1 Growth rates (Mean ± Standard Error) of Phyllospora comosa embryos
exposed to copper. 112
Figure 5.2 Growth rates (Mean ± Standard Error) of Phyllospora comosa embryos
exposed to chromium. 112
Figure 5.3 Growth rates (Mean ± Standard Error) of Phyllospora comosa embryos
exposed to unmodified primary treated effluent. 114
Figure 5.4 Growth rates (Mean ± Standard Error) of Phyllospora comosa embryos
exposed to modified primary treated effluent. 114
Figure 5.5 Growth rates (Mean ± Standard Error) of Phyllospora comosa embryos
exposed to unmodified secondary treated effluent. 116
Figure 5.6 Growth rates (Mean ± Standard Error) of Phyllospora comosa embryos
exposed to modified secondary treated effluent. 116
Figure 5.7 Growth rates (Mean ± Standard Error) of Phyllospora comosa embryos
exposed to unmodified chlorinated secondary treated effluent. 117
Figure 5.8 Growth rates (Mean ± Standard Error) of Phyllospora comosa embryos
exposed to modified chlorinated secondary treated effluent. 117
Figure 5.9 Growth rates (Mean ± Standard Error) of Phyllospora comosa embryos
exposed to reduced salinity. 119
Figure 5.10 Growth rates (Mean ± Standard Error) of Hormosira banksii embryos
Figure 5.11 Growth rates (Mean ± Standard Error) of Hormosira banksii embryos
exposed to chromium. 121
Figure 5.12 Growth rates (Mean ± Standard Error) of Hormosira banksii embryos
exposed to urunodified primary treated effluent. 123
Figure 5.13 Growth rates (Mean ± Standard Erroryof Hormosira banksii embryos
exposed to modified primary treated effluent. 123
Figure 5.14 Growth rates (Mean ± Standard Error) of Hormosira banksii embryos
exposed to unmodified secondary treated effluent. 125
Figure 5.15 Growth rates (Mean ± Standard Error) of Hormosira banksii embryos
exposed to modified secondary treated effluent. 125
Figure 5.16 Growth rates (Mean ± Standard Error) of Hormosira banksii embryos
exposed to unmodified chlorinated secondary treated effluent. 126
Figure 5.17 Growth rates (Mean ± Standard Error) of Hormosira banksii embryos
exposed to modified chlorinated secondary treated effluent. 126
Figure 5.18 Growth rates (Mean ± Standard Error) of Hormosira banksii embryos
exposed to reduced salinity. 127
Figure 5.19 Growth (Mean ± Standard Error) of Macrocystis angustifolia sporophytes
exposed to copper. 129
Figure 5.20 Production (Mean ± Standard Error) of Macrocystis angustifolia sporophytes
Figure 5.21 Growth (Mean ± Standard Error) of Macrocystis angustifolia sporophytes
exposed to chromium. 130
Figure 5.22 Production (Mean ± Standard Error) of Macrocystis angustifolia sporophytes
exposed to chromium. 130
Figure 5.23 Growth (Mean ± Standard Error) of Macrocystis angustifolia sporophytes
exposed to primary treated effluent. 132
Figure 5.24 Production (Mean ± Standard Error) of Macrocystis angustifolia sporophytes
exposed to primary treated effluent. 132
Figure 5.25 Growth (Mean ± Standard Error) of Macrocystis angustifolia sporophytes
exposed to secondary treated effluent. 134
Figure 5.26 Production (Mean ± Standard Error) of Macrocystis angustifolia sporophytes
exposed to secondary treated effluent. 134
Figure 5.27 Growth (Mean ± Standard Error) of Macrocystis angustifolia sporophytes
exposed to chlorinated secondary treated effluent. 135
Figure 5.28 Production (Mean ± Standard Error) of Macrocystis angustifolia sporophytes
exposed to chlorinated secondary treated effluent. 135
Figure 5.29 Growth (Mean ± Standard Error) of Macrocystis angustifolia sporophytes
exposed to reduced salinity. 137
Figure 5.30 Production (Mean ± Standard Error) of Macrocystis angustifolia sporophytes
Figure 6.1 Bioluminescence response over time of Vibrio Fischeri bacteria exposed to
copper for 5 and 15 minutes. 146
Figure 6.2 Bioluminescence response over time of Vibrio Fischeri bacteria exposed to
chromium for 5 and 15 minutes. 147
Figure 6.3 Bioluminescence response over time of Vibrio Fischeri bacteria exposed to
primary treated effluent for 5 and 15 minutes. 148
Figure 6.4 Bioluminescence response over time of Vibrio Fischeri bacteria exposed to
chlorinated secondary treated effluent for 5 and 15 minutes. 149
Figure 7.1 Phyllospora comosa. A scanning electron micrograph of a 48 hour old
germinated embryo cultured in sea water. 149
Figure 7.2 Phyllospora comosa. A 48 hour old germinated embryo cultured in seawater. 157
Figure 7.3 Phyllospora comosa. 48 hour old embryos cultured in 1 % unmodified primary
treated effluent. 157
Figure 7.4 Phyllospora comosa. A scarming electron micrograph of a 48 hour old embryo
cultured in 2% modified primary treated effluent. 157
Figure 7.5 Phyllospora comosa. A scarming electron micrograph of a 48 hour old embryo
cultured in 15% unmodified secondary treated effluent. 157
Figure 7.6 Phyllospora comosa. 48 hour old embryos cultured in 20% modified secondary
Figure 7.7 Phyllospora comosa. 48 hour old embryos cultured in 50%o unmodified secondary
treated effluent. 157
Figure 7.8 Phyllospora comosa. 48 hour old embryos cultured in seawater. 159
Figure 7.9 Phyllospora comosa. A fransmission electron micrograph of a 48 hour old
embryo cultured in 0.2 mg/L copper. 159
Figure 7.10 Phyllospora comosa. A transmission electron micrograph of a 48 hour old
embryo cultured in seawater. 159
Figure 7.11 Phyllospora comosa. 48 hour old embryos cultured in 50%) modified,
chlorinated secondary treated effluent. 159
Figure 7.12 Phyllospora comosa. A transmission electron micrograph of a 48 hour old
embryo cultured in 5% unmodified, chlorinated secondary effluent. 159
Figure 7.13 Phyllospora comosa. A scarming electron micrograph of a two week old
embryo cultured in 2% modified primary treated effluent. 159
Figure 7.14 Phyllospora comosa. A one week old embryo cultured in seawater. 159
Figure 7.15 Phyllospora comosa. A scarming electron micrograph of two week old
embryos cultured in seawater. 159
Figure 7.16 Phyllospora comosa. A transmission electron micrograph of a one week old
embryo cultured in seawater. 161
Figure 7.17 Phyllospora comosa. A transmission electron micrograph of a one week old
Figure 7.18 Hormosira banksii. A 48 hour old embryo cultured in seawater. 165
Figure 7.19 Hormosira banksii. A 48 hour old embryo cultured in seawater. 165
Figure 7.20 Hormosira banksii. A one week old embryo cultured in seawater. 165
Figure 7.21 Hormosira banksii. A transmission electron micrograph of a 48 hour old
embryo cultured in seawater. 165
Figure 7.22 Hormosira banksii. A scarming electron micrograph of a 48 hour old
germinated embryo cultured in seawater. 165
Figure 7.23 Hormosira banksii. A scanning electron micrograph of a 48 hour old embryo
cultured in 5% unmodified primary treated effluent. 165
Figure 7.24 Hormosira banksii. A scarming electron micrograph of a 48 hour old embryo
cultured in 20%) unmodified secondary treated effluent. 165
Figure 7.25 Hormosira banksii. A scanning electron micrograph of a 48 hour old embryo
cultured in seawater. 165
Figure 7.26 Hormosira banksii. A one week old embryo cultured in seawater. 165
Figure 7.27 Hormosira banksii. One week old embryos cultured in seawater showing
developed secondary rhizoids. 165
Figure 7.28 Hormosira banksii. A scarming electron micrograph of one week old embryos
Figure 7.29 Hormosira banksii. A scanning elecfron micrograph of one week old embryos
cultured in 5% unmodified secondary treated effluent. 167
Figure 7.30 Hormosira banksii. A transmission electron micrograph of a one week old
embryo cultured in seawater. 167
Figure 7.31 Hormosira banksii. A transmission electron micrograph of a one week old
embryo cultured in 2% unmodified primary treated effluent. 167
Figure 7.32 Hormosira banksii. A scanning electron micrograph of one week old embryos
cultured in seawater. 167
Figure 7.33 Hormosira banksii. A scanning electron micrograph of one week old embryos
cultured in 10% modified secondary treated effluent. 167
Figure 7.34 Hormosira banksii. A scanning electron micrograph of one week old embryos
cultured in 20% modified, chlorinated secondary treated effluent. 167
Figure 7.35 Macrocystis angustifolia. Germinated and ungerminated 48 hour old spores
cultured in seawater. 170
Figure 7.36 Macrocystis angustifolia. A scanning electron micrograph of a 48 hour old
spore cultured in seawater. 170
Figure 7.37 Macrocystis angustifolia. A scanning electron micrograph of a 48 hour old
spore cultured in 10%o unmodified secondary freated effluent. 170
Figure 7.38 Macrocystis angustifolia. Two week old male and female gametophytes
Figure 7.39 Macrocystis angustifolia. A scanning electron micrograph of a sporophyte
cultured in seawater. 170
Figure 7.40 Macrocystis angustifolia. A scarming electron micrograph of a sporophyte
cultured in 1 %> unmodified primary treated effluent. 170
Figure 7.41 Macrocystis angustifolia. A scanning electron micrograph of a sporophyte
cultured in 12%) modified, chlorinated secondary treated effluent. 170
List of Tables
page
Table 3.1 Table of repeated measures analysis of variance on the effect of treatment,
test date and treatment x test date interactions on arcsine transformed percentage germination data of Phyllospora comosa zygotes exposed to copper (Cu) and
chromium (Cr) for 48 hours. -^^
Table 3.2 Table of repeated measures analysis of variance on the effect of treatment,
test date and treatment x test date interactions on arcsine transformed percentage germination data of Phyllospora comosa zygotes exposed to primary treated effluent
for 48 hours. -^^
Table 3.3 Table of repeated measures analysis of variance on the effect of treatment,
test date and treatment x test date interactions on arcsine transformed percentage germination data of Phyllospora comosa zygotes exposed to modified (mod) and
unmodified (un) secondary treated effluent for 48 hours. 29
Table 3.4 Table of repeated measures analysis of variance on the effect of
treatment, test date and treatment x test date interactions on arcsine fransformed percentage germination data of Phyllospora comosa zygotes exposed to modified
(mod) and unmodified (un) chlorinated secondary treated effluent for 48 hours. 32
Table 3.5 Table of repeated measures analysis of variance on the effect of treatment,
test date and treatment x test date interactions on arcsine transformed percentage germination data of Phyllospora comosa zygotes exposed to treatments of reduced
salinity for 48 hours. 35
Table 3.6 Table of repeated measures analysis of variance on the effect of treatment,
germination data of Hormosira banksii zygotes exposed to copper (Cu) and chromium (Cr) for 48 hours.
Table 3.7 Table of repeated measures analysis of variance on the effect of treatment,
test date and treatment x test date interactions on arcsine transformed percentage germination data of Hormosira banksii zygotes exposed to primary treated effluent for 48 hours.
Table 3.8 Table of repeated measures analysis of variance on the effect of treatment,
test date and treatment x test date interactions on arcsine transformed percentage germination data of Hormosira banksii zygotes exposed to modified (mod) and
unmodified (un) secondary treated effluent for 48 hours. 43
Table 3.9 Table of repeated measures analysis of variance on the effect of treatment,
test date and treatment x test date interactions on arcsine transformed percentage germination data of Hormosira banksii zygotes exposed to modified (mod) and
unmodified (un) chlorinated secondary treated effluent for 48 hours. 44
Table 3.10 Table of repeated measures analysis of variance on the effect of treatment,
test date and treatment x test date interactions on arcsine transformed percentage germination data of Hormosira banksii zygotes exposed to treatments of reduced
salinity for 48 hours. ^7
Table 3.11 Table of repeated measures analysis of variance on the effect of treatment,
test date and treatment x test date interactions on arcsine transformed percentage germination (germ) and logio transformed germination tube growth (growth) data of
Macrocystis angustifolia spores exposed to copper for 48 hours. ^^
Table 3.12 Table of repeated measures analysis of variance on the effect of treatment,
germination (germ) and logio transformed germination tube growth (growth) data of Macrocystis angustifolia spores exposed to chromium for 48 hours.
Table 3.13 Table of repeated measures analysis of variance on the effect of treatment,
test date and treatment x test date interactions on arcsine transformed percentage germination (germ) and logio transformed germination tube growth (growth) data of Macrocystis angustifolia spores exposed to unmodified primary treated effluent for 48
hours.
Table 3.14 Table of repeated measures analysis of variance on the effect of treatment,
test date and treatment x test date interactions on arcsine transformed percentage germination (germ) and logio transformed germination tube growth (growth) data of Macrocystis angustifolia spores exposed to modified primary treated effluent for 48
hours.
Table 3.15 Table of repeated measures analysis of variance on the effect of treatment,
test date and treatment x test date interactions on arcsine transformed percentage germination (germ) and logio transformed germination tube growth (growth) data of Macrocystis angustifolia spores exposed to unmodified secondary treated effluent for
48 hours.
Table 3.16 Table of repeated measures analysis of variance on the effect of treatment,
test date and treatment x test date interactions on arcsine transformed percentage germination (germ) and logio transformed germination tube growth (growth) data of Macrocystis angustifolia spores exposed to modified secondary treated effluent for 48 hours.
Table 3.17 Table of repeated measures analysis of variance on the effect of treatment,
test date and treatment x test date interactions on arcsine transformed percentage germination (germ) and logio transformed germination tube growth (growth) data of
53
58
Macrocystis angustifolia spores exposed to urunodified chlorinated secondary treated effluent for 48 hours.
Table 3.18 Table of repeated measures analysis of variance on the effect of treatment,
test date and freatment x test date interactions on arcsine transformed percentage germination (germ) and logio transformed germination tube growth (growth) data of Macrocystis angustifolia spores exposed to modified chlorinated secondary treated effluent for 48 hours.
65
66
Table 3.19 Table of repeated measures analysis of variance on the effect of treatment,
test date and treatment x test date interactions on arcsine transformed percentage germination (germ) and logio transformed germination tube growth (growth) data of
Macrocystis angustifolia spores exposed to treatments of reduced salinity for 48 hours. 68
Table 3.20 Table of relative sensitivities of Phyllospora comosa, Macrocystis
angustifolia and Hormosira banksii zygotes/spores after exposure to various treatments
for 48 hours. 69
Table 4.1 Table of repeated measures ANOVA on the effect of treatment, test date and
treatment x test date interactions on arcsine transformed percentage mortality data of
Phyllospora comosa embryos exposed to copper for 96 hours. 82
Table 4.2 Table of repeated measures ANOVA on the effect of treatment, test date and
treatment x test date interactions on arcsine transformed percentage mortality data of Phyllospora comosa embryos exposed to modified (mod) and unmodified (un) primary
treated effluent for 96 hours. 84
Table 4.3 Table of repeated measures ANOVA on the effect of treatment, test date and
treatment x test date interactions on arcsine transformed percentage mortality data of Phyllospora comosa embryos exposed to modified (mod) and unmodified (un)
Table 4.4 Table repeated measures ANOVA on the effect of treatment, test date and
treatment x test date interactions on arcsine transformed percentage mortality data of Phyllospora comosa embryos exposed to modified (mod) and unmodified (un)
chlorinated secondary treated effluent for 96 hours. 39
Table 4.5 Table of repeated measures ANOVA on the effect of treatment, test date and
treatment x test date interactions on arcsine transformed percentage mortality data of
Phyllospora comosa embryos exposed to treatments of reduced salinity for 96 hours. 92
Table 4.6 Table of repeated measures ANOVA on the effect of treatment, test date and
treatment x test date interactions on arcsine transformed percentage mortality data of
Hormosira banksii embryos exposed to copper for 96 hours. 94
Table 4.7 Table of repeated measures ANOVA on the effect of freatment, test date and
treatment x test date interactions on arcsine transformed percentage mortality data of Hormosira banksii embryos exposed to modified (mod) and unmodified (un) primary
treated effluent for 96 hours. 96
Table 4.8 Table of repeated measures ANOVA on the effect of treatment, test date and
treatment x test date interactions on arcsine transformed percentage mortality data of Hormosira banksii embryos exposed to modified (mod) and unmodified (un)
secondary treated effluent for 96 hours. 98
Table 4.9 Table of repeated measures ANOVA on the effect of treatment, test date and
treatment x test date interactions on arcsine transformed percentage mortality data of Hormosira banksii embryos exposed to modified (mod) and unmodified (un)
chlorinated secondary treated effluent for 96 hours. ^^2
Table 4.10 Table of repeated measures ANOVA on the effect of treatment, test date
and treatment x test date interactions on arcsine transformed percentage mortality data
Table 4.11 Table of relative sensitivities of Phyllospora comosa and Hormosira
List of Appendices
page
Appendix 1 Toxicity test labels as quoted in Chapters 3-5 and their corresponding
200 dates of commencement.
Appendix 2 Tables of test NOEC, LOEC and EC50 values for Phyllospora comosa,
Hormosira banksii and Macrocystis angustifolia germination and germination tube
growth bioassays. 201
Appendix 2.1 Table of test NOEC, LOEC and EC50 values for Phyllospora comosa
copper and chromium germination bioassays based on data presented in Section 3.2.1. 201
Appendix 2.2 Table of test NOEC, LOEC and EC50 values for Phyllospora comosa
primary treated effluent (modified and unmodified and corresponding salinity)
germination bioassays based on data presented in Section 3.2.1. 202
Appendix 2.3 Table of test NOEC, LOEC and EC50 values for Phyllospora comosa
secondary treated effluent (modified and unmodified and corresponding salinity)
germination bioassays based on data presented in Section 3.2.1. 203
Appendix 2.4 Table of test NOEC, LOEC and EC50 values for Phyllospora comosa
chlorinated secondary treated effluent (modified and unmodified and corresponding
salinity) germination bioassays based on data presented in Section 3.2.1. 204
Appendix 2.5 Table of test NOEC, LOEC and EC50 values for Phyllospora comosa
salinity reduction germination bioassays based on data presented in Section 3.2.1. 205
Appendix 2.6 Table of test NOEC, LOEC and EC50 values for Hormosira banksii
copper and chromium germination bioassays based on data presented in Section 3.2.2. 206
Appendix 2.7 Table of test NOEC, LOEC and EC50 values for Hormosira banksii
primary treated effluent (modified and unmodified and corresponding salinity)
Appendix 2.8 Table of test NOEC, LOEC and EC50 values for Hormosira banksii
secondary treated effluent (modified and unmodified and corresponding salinity)
germination bioassays based on data presented in Section 3.2.2. 208
Appendix 2.9 Table of test NOEC, LOEC andECso values for Hormosira banksii
chlorinated secondary treated effluent (modified and unmodified and corresponding
salinity) germination bioassays based on data presented in Section 3.2.2. 209
Appendix 2.10 Table of test NOEC, LOEC and EC50 values for Hormosira banksii
salinity reduction germination bioassays based on data presented in Section 3.2.2. 210
Appendix 2.11 Table of test NOEC, LOEC and EC50 values for Macrocystis
angustifolia copper germination and growth bioassays based on data presented in
Section 3.2.3. 211
Appendix 2.12 Table of test NOEC, LOEC and EC50 values for Macrocystis
angustifolia chromium germination and growth bioassays based on data presented in
212 Section 3.2.3.
Appendix 2.13 Table of test NOEC, LOEC and EC50 values for Macrocystis
angustifolia primary treated effluent (modified and unmodified corresponding salinity)
germination bioassays based on data presented in Section 3.2.3. 213
Appendix 2.14 Table of test NOEC, LOEC and EC50 values for Macrocystis
angustifolia primary treated effluent (modified and unmodified and corresponding
salinity) germination tube growth bioassays based on data presented in Section 3.2.3. 214
Appendix 2.15 Table of test NOEC, LOEC and EC50 values for Macrocystis
angustifolia secondary treated effluent (modified and unmodified and corresponding
Appendix 2.16 Table of test NOEC, LOEC and EC50 values for Macrocystis
angustifolia secondary treated effluent (modified and unmodified and corresponding
salinity) germination tube growth bioassays based on data presented in Section 3.2.3.
Appendix 2.17 Table of test NOEC, LOEC and EC50 values for Macrocystis
angustifolia chlorinated secondary treated effluent (modified and unmodified and
corresponding salinity) germination bioassays based on data presented in Section 3.2.3. 217
Appendix 2.18 Table of test NOEC, LOEC and EC50 values for Macrocystis
angustifolia chlorinated secondary treated effluent (modified and unmodified and corresponding salinity) germination tube growth bioassays based on data presented in
Section 3.2.3. 218
Appendix 2.19 Table of test NOEC, LOEC and EC50 values for Macrocystis
angustifolia salinity reduction germination bioassays based on data presented in
Section 3.2.3. ^^^
Appendix 2.20 Table of test NOEC, LOEC and EC50 values for Macrocystis
angustifolia salinity reduction germination tube growth bioassays based on data
220 presented in Section 3.2.3.
Appendix 3 Tables of test NOEC, LOEC and LC50 values for Phyllospora comosa and
Hormosira banksii mortality bioassays. 221
Appendix 3.1 Table of test NOEC, LOEC and LC50 values for Phyllospora comosa
copper mortality bioassays based on data presented in section 4.2.1. 221
Appendix 3.2 Table of test NOEC, LOEC and LC50 values for Phyllospora comosa
primary treated effluent (modified and unmodified and corresponding salinity)
Appendix 3.3 Table of test NOEC, LOEC and LC50 values for Phyllospora comosa
secondary treated effluent (modified and unmodified and corresponding salinity)
mortality bioassays based on data presented in Section 4.2.1. 223
Appendix 3.4 Table of test NOEC, LOEC and LC50 values for Phyllospora comosa
chlorinated secondary freated effluent (modified and unmodified and corresponding
salinity) mortality bioassays based on data presented in Section 4.2.1. 224
Appendix 3.5 Table of test NOEC, LOEC and LC50 values for Phyllospora comosa
salinity reduction mortality bioassays based on data presented in Section 4.2.1. 225
Appendix 3.6 Table of test NOEC, LOEC and LC50 values for Hormosira banksii
copper mortality bioassays based on data presented in Section 4.2.2. 226
Appendix 3.7 Table of test NOEC, LOEC and LC50 values for Hormosira banksii
primary treated effluent (modified and unmodified and corresponding salinity)
mortality bioassays based on data presented in Section 4.2.2. 227
Appendix 3.8 Table of test NOEC, LOEC and LC50 values for Hormosira banksii
secondary freated effluent (modified and urunodified and corresponding salinity)
mortality bioassays based on data presented in Section 4.2.2. 228
Appendix 3.9 Table of test NOEC, LOEC and LC50 values for Homosira banksii
chlorinated secondary treated effluent (modified and unmodified and corresponding
salinity) mortality bioassays based on data presented in Section 4.2.2. 229
Appendix 3.10 Table of test NOEC, LOEC and LC50 values for Hormosira banksii
List of Abbreviations and Definitions
ANOVA Analysis of variance.
Antheridia Male reproductive organs containing sperm.
Dioecious Having male and female gametes produced on separate plants.
Diploid Nucleus containing two sets of chromosomes (2N).
EC50 Effective concentration of toxicant which causes an adverse effect in 50%
of a test population.
Embryo Young multicellular organism, derived from a zygote or spore.
Gamete A haploid reproductive cell capable of uniting with another such cell to form a diploid zygote.
Gametophyte Multicellular sexual, gamete-producing phase of the life history of a plant.
Germination First outward sign of morphogenesis, when a protuberance emerges from the zygote or spore and elongates to form the primary rhizoid.
Haploid Life history phase of a plant where the nuclei contain a single set of chromosomes.
LOEC Lowest observable effect concentration, which causes a statistically significant adverse effect to the test population on the observed parameters.
NOEC No observable effect concenfration, which causes no statistically significant adverse effect to the test population on the observed parameters.
Oogamous Reproduction involving large non-motile eggs and small motile sperm.
Oogonia Female reproductive organs, each containing one or more eggs.
Spore Reproductive cell derived by mitosis or meiosis.
Sporophyte Diploid (2N) spore-producing multicellular phase of a life history.
Zoospore Motile reproductive cell not involved in sexual reproduction.
List of Publications and Conference Presentations
The Comparative Effects of Oil and Oil/Dispersant Conjugates on Germination of the Marine Macroalga Phyllospora comosa (Fucales: Phaeophyta). Marine Pollution Bulletin, 31, 446-452, 1995.
The Effects of Sewage Effluent on The Early Life Stages of Three Species of Marine Macroalgae. Technical Report. CSIRO, August, 1998.
Annual Conference of the Australasian Society for Ecotoxicology. Sydney, June, 1995. The Effects of Oil and Dispersed Oil on Mortality and Growth of the Marine Macroalga Phyllospora comosa.
Annual Conference of the Australasian Society for Ecotoxicology. Sydney, June, 1996. The Effects of Oil and Dispersants on Germination of Phyllospora comosa.
13* Annual Conference of the Australasian Society for Phycology and Aquatic Botany. Hobart, January, 1997. The Effects of Sewage Effluent on Germination and Growth of Brown Marine Macrophytes.
Abstract
The early life stages of the macroalgal species Phyllospora comosa, Hormosira banksii and Macrocystis angustifolia were exposed to treatments of sewage effluent, copper, chromium and reduced salinity. Germination and mortality of P. comosa and H. banksii zygotes and embryos, and germination and germination tube growth of M. angustifolia spores were utilised as acute toxicity test endpoints. Germination bioassays were of 48 hours duration whilst mortality bioassays were conducted over 96 hours. Growth of all three species and sporophyte production of M angustifolia were utilised as chrortic bioassay endpoints. These tests were conducted over 2-3 weeks. It was found that sensitivity of test end points varied depending on exposure time. Generally longer exposure times resulted in significantly lower threshold concentrations. Growth and sporophyte production or reproduction bioassays showed greater sensitivity in the test species, whilst the shorter tests tended to produce higher threshold concenfrations. Primary freated effluent exerted greatest effects on the early life stages of the algae followed by chlorinated secondary and secondary treated effluent.
Treatment of sewage effluent significantly reduced toxicity with primary freated effluent consistently exerting greater toxicity. It was found that concenfrations of primary treated effluent ranging between 5-15% sigruficantly inhibited zygote and zoospore germination by 50% in all three species. Embryo mortality of 50% of the test populations of H. banksii and P. comosa were recorded at concentrations ranging between 5-25%) primary freated effluent. Threshold concenfrations for these assays tended to be lower than those recorded for germination assays and could be attributed to longer exposure times.
Growth rates of P. comosa and H. banksii embryos exposed to treated effluent were recorded at one and two weeks and results suggested that prolonged exposure significantly affected the development of embryos. Sporophyte production of M. angustifolia was assessed after 19-20 days of exposure to the effluent freatments
(2.5-5% effluent) of all three effluent samples significantly inhibited reproduction (sporophyte development and production).
Copper chloride and hexavalent chromium (nominal concenfrations diluted in seawater) were employed as the reference toxicants for this study and salirtity reduction assays were employed to determine the effects of seawater dilution on the early life stages of the three species. The most sensitive assay endpoints were the two week growth tests for H. banksii and P. comosa, and sporophyte production for M. angustifolia. Further work also concenfrated on investigating the effects of effluent treatments at the ultrastructural level. To compliment toxicity test protocol adopted for this study, bioluminescence inhibition assays were also employed to provide a biological reference.
Elecfron microscopy studies revealed that exposure to toxicants and effluents may cause dismptions in chloroplast development in young plants. There was also evidence of reduced numbers of physodes and Golgi-derived vesicles in young P. comosa and interrupted physode development in H. banksii embryos cultured in freated effluent. Of particular concem were the effects treatment solutions exerted on cellular membrane health and development. Scarming electron microscopy revealed gross deformities and stunted development in all three species of algae after exposure to varying freatments of sewage effluent.
CHAPTER 1
GENERAL INTRODUCTION
1.1 Introduction
An erroneous assumption that aquatic environments can absorb and dilute high volumes of wastes due simply to the copious amounts of water held within has long existed and has led to large-scale pollutant contamination of many coastal environments. Wastewater or sewage effluent, discharged into these environments consists of water, dissolved or suspended solids and chemical and biological matter, and has been linked to causing toxic effects in many plant and animal species (Borowitzka 1972, Vidakovic 1983, May
1985, Tewari & Joshi 1988, Brown et al. 1990). The fate of sewage effluent upon entering the aquatic environment and the toxicological effects on benthic organisms is an area of research that has seen some significant findings in recent times, but an area that has been neglected in Australia (Burridge et al. 1995a, 1995b, Burridge et al. 1996, Shir & Burridge 1998, Bidwell et al. 1998, Burridge et al 1999, Doblin & Clayton 1995).
1.1.1 Effluent discharge
Organisms inhabiting coastal marine environments are subject to the effects of a variety of pollutants such as sewage and industrial effluents, cmde oil and accidental chemical discharges. Domestic sewage and industrial effluents have been regarded as the most common sources of aquatic pollution (Tripathi & Shukla 1991), and concem has been expressed over the effects of these types of discharge on marine ecosystems (Plusquellec et al. 1991, Anderlini & Wear 1992, Costello & Gamble 1992, Bothner et al 1994). Of major concem is the significant impact that sewage discharge may have on the stmcture and diversity of aquatic communities in the receiving waters (Fletcher 1974, Littier & Murray 1975, Tewari & Joshi 1988, Brown et al 1990, Seager & Abrahams 1990).
animal communities (Scanes & Philip 1995, Otway et al 1996). There is also evidence indicating that the effects of sewage can be drastically altered once the effluent enters the marine environment, and that modifications of compounds in complex effluents and conditions of reduced satinity can alter the effects of the discharge (McLean et al 1991, Bridges et al 1994). Effects of sewage pollution on marine biota occur at the cellular, individual, population and community levels of organisation however, the vast majority of effects have been documented at the community level only (Underwood & Peterson 1988, Otway et al. 1996). The need for ecotoxicological research in conjunction with monitoring programmes has become essential to ensure that sewage effluent effects can be anticipated before discharge occurs, but also to attempt to minimise any irreversible effects to coastal marine environments. Monitoring programmes can provide information on changes in macroalgal, macroinvertebrate and infaunal communities within the vicinity of an effluent plume and surrounding areas (Fagan et al. 1992).
1.1.2 Toxicity testing
Ayres 1993) via the a-priori prediction of effects of the effluent on test species. Monitoring programmes can then be implemented to ensure that prolonged periods of effluent discharge do not cause deleterious effects to marine organisms and their surrounding environments.
Toxicity tests are routinely employed to evaluate the concentration of a chemical and the duration of exposure required to produce a specific effect (Chapman & Long 1983, Rand & Petrocelli 1985). Acute toxicity tests are performed to determine concentrations of test chemicals that result in deleterious effects in organisms during a short-term exposure period under controlled conditions (Lewis 1991). For these types of tests mortality is often considered as the deleterious effect. Chronic toxicity tests indicate the concentrations of chemicals that produce effects over significant portions of the test organisms' life spans (Rand & Petrocelli 1985). For these types of tests abnormal growth and development are considered as common test endpoints. Generally, concentrations that produce chronic effects are lower than those that produce more readily observable acute effects (Buikema Jr et al. 1982, Lewis 1991, 1992). A chronic toxicity test is designed to expose test organisms to a range of chemical concentrations estimated to bracket the threshold for significant effects (Steele & Thursby 1983, Anderson & Hunt 1988, Caims & Pratt 1993, Forbes & Forbes 1993). Both types of tests can provide informative data, depending on the objectives of the testing.
coastiine of Victoria with the recorded disappearances of intertidal macroalgal species (Manning 1979, Brown et al 1990, Bellgrove et al. 1997). Whilst monitoring programmes have provided information on the effects of sewage effluent on several species ranging over different trophic levels, they caimot provide data on the specific toxic effects of the effluent on species affected. To gain this information, controlled ecotoxicological experiments need to be conducted. Most toxicity tests that have been undertaken to date have utilised only a limited number of animal species as the test organisms. Costello and Read (1994) noted that many toxicity tests with sewage effluent have been conducted on North Atlantic fish species such as the herring Clupea harengus and cod Gadus morhua and crastacean species such as the shrimp Crangon crangon. Other researchers have focussed on testing the effects of primary and secondary treated effluent on shell development of larvae of the east Pacific red abalone Haliotis rufescens (Hunt & Anderson 1989), and effects of sewage effluent on mortality of juveniles of the fish species Menidia menidia (Santoro & Fikslin 1987). Miller et al (1987) tested the lethality of New York and New Jersey (USA) sewage effluent on the copepods Eurytemora herdmani and Psuedoclanus minitus and larvae of the mysid Mysidopsis bahia. Many tests conducted to determine the effects of sewage effluent on marine species have been short-term, single species lethality tests (Costello & Read 1994). Few reports have been conducted on the long-term effects of sewage effluent with the exception of tests conducted on phytoplankton of several months duration (Frithsen et al
1989).
1.1.3 Algal toxicity testing
of these species from once extensively populated areas (Manning 1979, Brown et al. 1990, Doblin & Clayton 1995). There is a need to examine why these populations are declining. Costello and Gamble (1992) noted that many reports have examined the toxic effects of sewage effluent on luminescence in bacteria and phytoplankton blooms in mesocosms, but no extensive research on macroalgae has been conducted. The need to investigate the effects of sewage effluent on macroalgae exists, as this type of discharge can either be a source of nutrient supply or an inhibitor of macroalgal growth (Ogawa 1984). The little ecotoxicological research conducted determining the effects of sewage effluent on macroalgal species has been conducted abroad namely USA, Japan and India. Anderson and Hunt (1988) utilised the microscopic life stages of the giant kelp Macrocystis pyrifera. They found that germination was inhibited at concentrations above 0.56% primary treated effluent after 48 hours exposure. Ogawa (1984) investigated the effects of secondary treated effluent on the early development of sargassaceous plants and found that germination of zygotes was completely inhibited in secondary treated effluent containing 25-50 mgL"^ NH'^4-N. Studies such as these suggest that several species of macroalgae are amenable to evaluating the toxicity of a variety of toxicants including sewage effluents.
Phyllospora comosa is found in sub-littoral zones of high energy coastal waters from Encounter Bay, South Australia to Port Macquarie, New South Wales. It is a large macroalga which forms dense forests and is anchored by a holdfast radiating out from the base of the main axis of the plant. The liguate axis and other branched axes are densely crowded with flat leafy laterals (receptacles) which produce male or female gametes (Burridge & Hallam 1993). Phyllospora comosa is dioecious, having separate male and female plants, and is fertile year round. Male and female plants can be differentiated by the appearance of their receptacles (Burridge et al. 1993). Gametes are formed in the oogonia and antheridia in conceptacles within receptacles (Burridge & Hallam 1993). Male and female gametes are released simultaneously into the water column, the eggs are retained in stalks at the receptacle surface and the sperm fertilise the eggs in a random fashion. Maximum fertilisation usually takes place in the first 30 minutes, although eggs are retained on receptacles for up to 15 hours to optimise fertilisation (Burridge et al.
1993).
Hormosira banksii is a moniliform brown alga endemic to lower eulittoral communities of southem Austratia and New Zealand (Clayton et al. 1985), it is dioecious and fertile year round (Miiller et al. 1984). Plants are attached to the substratum by a discoid holdfast and the thallus consists of branched chains of vesicular segments that are joined by slender restrictions (Clayton et al. 1985). Reproduction in H. banksii is oogamous and eggs and sperm are exuded on the surface of the thalli. Upon contact with seawater, the oogonial membranes dissolve to liberate four eggs per oogonium. Each antheridia releases 64 spermatozoids that swarm around the eggs until fertilisation has been achieved (Miiller er a/. 1984).
gametophyte stage and macroscopic diploid sporophyte stage. The sporangia produce 16 to 64 motile zoospores (haploid cells) which are released into the water column where they begin germination by undergoing meiosis followed by mitotic divisions (Tugwell & Branch 1989, Anderson & Hunt 1988).
For this study, the early life stages of P. comosa, H. banksii and M. angustifolia were utilised in determining the toxic effects of treated sewage effluent.
1.2 Aims of this study
The aims of this study were to:
1. determine the effects of primary, secondary and chlorinated secondary treated effluents on the early life stages and endpoints of the marine macroalgal species; Phyllospora comosa, Hormosira banksii and Macrocystis angustifolia. Zygote and zoospore germination, embryo and spore germination tube growth, embryo mortality, and sporophyte production (reproduction) and growth were investigated.
2. validate all tests conducted by conducting separate toxicity tests with the reference toxicants copper chloride and hexavalent chromium.
3. compare results obtained from differently treated effluents and to determine the extent to which treatment alters toxicity.
4. establish standard ecotoxicological tests which can be routinely employed for the determination of sewage effluent toxicity.
5. to develop toxicity tests with marine macrophytes which can be quickly and easily conducted and provide reproducible results.
CHAPTER 2
MATERIALS AND METHODS
2.1 Collection
Fertile samples of Phyllospora comosa , Hormosira banksii and Macrocystis angustifolia were collected at low tide from Sorrento ocean beach (38°22'S, 144° 44'E), Sorrento, Victoria (Fig. 2.1).
2.2 Test species and toxicity test endpoints
2.2.1 Phyllospora comosa
Healthy and mature male and female plants were gathered, sexed and receptacles from each plant were placed into 25 ml polyethylene vials containing fresh seawater. Male and female plants were separately differentiated on the basis of the appearance of conceptacles within receptacles (Burridge & Hallam 1993). Female conceptacles appeared dark when held towards the light whilst male conceptacles appeared milky white when held just below the surface of the water. Forty vials, each containing four same-sex receptacles, were placed on a bed of crashed ice and transported to the laboratory in darkness to reduce the risk of premature gamete release.
Gamete release for P. comosa was initiated according to the procedure of Burridge and Hallam (1993). Vials containing P. comosa receptacles were placed on ice under a direct
0 1
IQlometres
Fertilisation for toxicity tests was achieved by following the procedure of Burridge and Shir (1995). Male and female gametes were directiy added to 25 ml filter paper-lined beakers (the filter paper acted as the substratum). Beakers were filled with filtered oceanic seawater. One 2 cm segment of a female receptacle was added to each beaker. A volume of 1 ml of the seawater/spermatozoid mixture was added to each beaker. One ml contained approximately 10^ sperm per aliquot (sperm densities less than 10^ cells ml" were discarded). All beakers were covered with Parafilm® and placed in a refrigerated incubation cabinet and maintained at 15°C under a cool-white fluorescent light source of 120 |LiE m'^ s'^ in a light:dark regime of 12:12 hours. The culttires were agitated periodically for the next 12 hours at which time receptacle tissue was removed and unattached zygotes could be observed scattered over the substratum surface.
Following fertilisation and receptacle tissue removal, cultures were left for 6 hours to allow zygotes to adhere to the substratum. Beakers were gently agitated and seawater and non-viable (unattached and therefore ungerminated) zygotes decanted and treatment solutions added. Four replicates were established for each treatment. Zygote germination was recorded at 48 hours, zygote mortality at 96 hours and embryo growth was measured at one and two weeks with a compound microscope. Germination rates were assessed on the basis of the presence or absence of a germination tube and mortality rates on the basis of a clearly necrotic appearance. The first 80 zygotes encountered during scoring were assessed in each replicate. Growth of embryos was measured with the aid of an objective graticule and the first 20 embryos encountered were measured (the entire length of each embryo was measured, that is, lengths of rhizoidal axes recorded).
2.2.2 Hormosira banksii
Gamete release ofH. banksii followed a modification of the procedure of Gunthorpe et al (1995). Bags containing samples were stored at 4°C ovemight. The chilled algae were rinsed briefly with tepid (20-23°) tap water and placed on trays under a direct light source as described in Section 2.2.1. Male and female gametes exuded onto the surface ofH banksii segments within 1 hour. Sexed fronds were placed separately into two 1 L beakers filled with seawater. Egg and sperm suspensions were viewed under a compound microscope to verify their presence. Viability of sperm was also assessed by their motility. Densities of eggs and sperm utilised were approximately 150 eggs/cm^ and 10^ sperm/ml respectively, providing an egg:sperm ratio of 1:1000. The gamete suspensions were then mixed and allowed to stand for 10-15 minutes, after which time fronds were removed. The gamete suspensions were added to 25 ml beakers containing coverslips. Beakers were covered with Parafilm® and placed in a refiigerated incubation cabinet at 15°C and 12:12 hours light:dark regime ovemight as described in Section 2.2.1. Following adhesion, the gamete suspension was decanted and replaced with freatment solutions. Four replicates of each treatment were established. Germination, embryo mortality and one and two week growth rates were assessed as described in Section 2.2.1. Treatment solutions were changed every three days for all P. comosa and H. banksii growth tests.
2.2.3 Macrocystis angustifolia
For zoospore release of M. angustifolia, sporophylls were washed in filtered oceanic seawater and blotted dry with paper towel to remove any epiphytes (Anderson & Hunt
1990). Sporophylls were then laid on paper towelling at room temperature for 1 hour and then placed into a 1 L beaker filled with seawater to allow zoospore release. Release occurred at times ranging between 10 and 60 minutes and the zoospore suspension was checked every 10 minutes after desiccated sporophylls had been added to the seawater. Zoospore densities utilised for the tests were a minimum of 10^ cells/ml.
Four replicates containing each treatinent were established. A volume of 2 ml of the zoospore suspension was added to each 25 ml beaker containing the treatment solution and a coverslip which acted as a substratum. Forty-eight hours after zoospore addition, spore germination and growth were recorded for the first 80 gametophytes encountered, utilising a compound microscope and objective graticule. At this time analytical reagent grade nutrients (Ajax Chemicals, Australia) were added (minus EDTA-chelated iron) as well as germanium dioxide (0.10 mg/L) to control diatom growth. The nutrient medium used was prepared following the method of Steele and Thursby (1988) and contained sodium nitrate (12.7 g/L), sodium phosphate (1.28 g/L), sodium citrate (103 mg/L) and ferrous sulphate (97 mg/L) dissolved in seawater. The stock was then autoclaved at standard pressure and temperature for 15 minutes. For each litre of algal culture medium used, 5-10 ml of nutrient medium was added. Test solutions were changed every four days. Sporophyte production (reproduction) was scored and sporophyte growth of the first 20 individuals encountered, measured on day 20. For all germination and mortality assays, >80%) germination/survival in control treatments was consistently recorded and used as the benchmark for test acceptability.
2.2.4 Vibrio fischeri
bacteria and incubated for 5 and 15 minutes at 15°C prior to the measurement of luminous activity in the model 2205 Microtox® instmment. Tests were repeated 3-5 times for each treatment and the phenol standard test was performed each time a treatment was tested. All supplies and accessories, including the bacterium used for these tests were provided by Microbics Corporation. Microtox® reconstitution solution (specially prepared distilled water) was used to reconstitute the bacterium (reagent). Microtox® diluent (specially prepared 2% NaCl) was used to dilute the sample and reagent and Microtox® osmotic adjustment solution (specially prepared 22%) NaCl) was used to adjust the osmotic pressure of the sample to 2% NaCl.
2.3 Dilution v^^ater
Oceanic seawater was used as the culture medium and dilution solution in all tests conducted. Seawater was supplied by Queenscliff Marine Station, Victoria. The seawater (temperature: 15 ± 1°C; salinity: 34 ± 2°/oo; pH: 8 ± 1; DO: 7 ± 1 mg/L) was filtered through a 0.2 |.xm membrane filter and refiltered upon arrival at Victoria University where it was stored in a 5000 L tank until required.
2.4 Test solutions
expressed as the individual copper and chromium ions, ft should be noted that only nominal concentrations were required to assess background variability of algal responses over the test period. All toxicity tests performed with reference toxicants were conducted using polyethylene beakers to minimise absorptive losses of the metals (Anderson & Hunt 1988).