Optimizing the Parameters of Handover in LTE using SON System by
Handling Mobility Robustness
G K Venkatesh Dr.P.V.Rao
PhD Scholar Prof. Dept. of ECE
Jain University, Rajarajeshwari College of Engineering
Chickballapur, India Bangalore, India
Abstract—Long Term Evaluation is a wireless communication system which was developed by 3rd Generation Partnership Project to achieve high network capacity and high spectral efficiency. Prediction of handover and deciding of handover in long term evolution systems is very complicated. Adjusting the parameters to achieve less delay in the handover then we have to compromise with the system performance and user experience. In 2nd generation and 3rd generation technology, handover parameters are manually set to obtain the better system performance. By doing that it was consuming more time and even that was less robust. Because of increased cell number in Long Term Evolution systems the services are provided with higher speed. With the increase in cell number the operating expenditure for managing them also increases. Solution for resolving this problem is by making use of self-configuring and optimizing method. From these two techniques self-optimization is well known for reducing operating expenditure.
The handover optimization techniques are analysed for the stationary mobility users in the conventional method. The main intention of our project is to obtain better handover performance for mobility robustness.
This project provides an algorithm for adjusting the handover parameters adaptively and automatically. The algorithm considers handover failure that is caused due to the user equipment mobility changes and also we analyse the user mobility and handover results of the user equipment and that will be recorded in the database. These results are examined and selected for the next time handover when a user prefers the same mobility route. Doing this will reduce the number of handover failures and avoids the unnecessary handovers.
Keywords: Self Organizing Networks, mobility robustness, Self Optimization, Mobility Robustness Optimization, Radio Link Failures.
I.INTRODUCTION
The cellular network becomes more and more complex as the mobile traffic increases. As there is a challenge in the establishing network, then we need to adopt new technology. Moving to the new technology will lead to the increased network infrastructure cost and operating expenses. This will be a main challenge for network operator. 3rd Generation Partnership Project developed a new wireless communication system called Long Term Evolution which increases the network capacity along with the high spectral efficiency. As
mentioned in the beginning with this new implementation the Operating Expenditure also increases. The operating expenditure refers to the cost spent for the network operations and maintenance. So the 3rd Generation Partnership Project introduced the new technology called Self Organizing Network. Self-Organizing Network is broadly classified into Self-configuring and Self-optimizing. Self-configuring refers to the installation of software automatically, wireless parameters configuration, identification of neighbor cell at the time of mobility for handover purpose, Self-optimizing refers to the parameter adjustment based on the measurement results obtained from the network device when the system is running. The important aspect in Self Organizing Network is the self-optimization of handover. There is wide range of mobility supported in LTE. It starts from 0 km/hrs to 350 km/hrs for user equipment. Hence the variation of user mobility will directly effect on the performance of handover. Hence the self-optimization techniques are developed to adjust handover parameters. By this we can obtain stabilized handover performance with the changes in user equipment mobility.
The optimal setting of handover parameters are done by handover failure rate and also the ping pong handover rate. Ping pong handovers, in which the user equipment returns to the original serving cell within a certain period of time (consider 2 sec) after a handover from the original serving cell to a neighbor cell. Legg et al showed that there is a tradeoff between the handover failure rate and the ping pong handover rate for high velocity user equipments. They found that the handover failure rate and ping pong handover rate are reduced by setting the parameters for the user equipments with fixed velocity. However user equipment with variable velocity and if the direction varies then the above fixed user equipment concept may not work. Hence we are developing a new handover optimization algorithm for mobility devices with variable velocity. The project mainly deals with the parameter optimization and mobility robustness optimization with the new handover optimization algorithm.
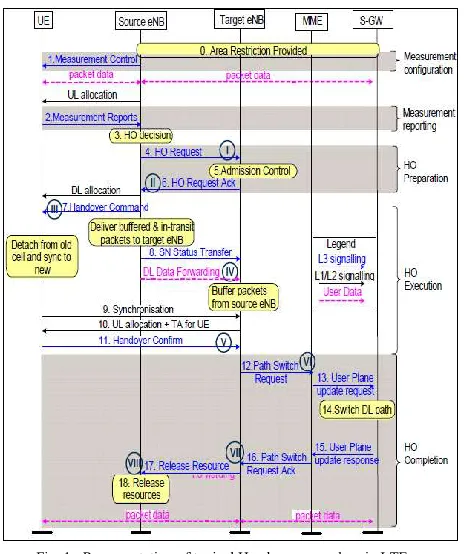
Measurement control procedure is initiated from the source eNodeB to the user equipment. User equipment sends back the measurement report to the to the source eNodeB with configured parameters. Now it’s time for the source eNodeB to decide whether handover should be performed or not. This algorithm considers the cause for handover failure, which is affected by the user equipment mobility. The algorithm which is proposed in this paper is verified by considering the different parameters by assuming variable velocity and direction for a user equipment.
Fig. 1. Representation of typical Handover procedure in LTE.
There are many decision criteria in handover techniques, they are as follows: Reference Signal Received Power (RSRP), Reference Signal Received Quality (RSRQ), Received Signal Strength Indicator (RSSI), and Signal Noise Ratio (SNR). These techniques are considered our algorithm. Mainly we focus on RSRQ and RSRP.
In Long Term Evolution systems, handover happens between the serving eNodeB and the target eNodeB. The user equipment generates the handover measurement report to the serving eNodeB that initiates the handover procedure if necessary. The measurement report from the user equipment contains the RSRP value, of the serving cell and neighbor cell. Based on these values there are different conditions for triggering the transmission of measurement reports. Here is the example, when the serving cell's received power becomes worse than the threshold and the neighboring cell's received power becomes better than threshold. A3 event is used in our
paper for triggering the handover. Figure 2 illustrates the triggering time of A3 measurement report. The A3 condition for the handover target cell b at user equipment ID l is defined as
X(b, l) −X(a, l) > T(a, b), (1)
Where X(a, l) and X(b, l) are the RSRP levels at User Equipment ID l of the serving cell a and the target cell b. T(a, b) is a cell-specific parameter called the HO margin. The user equipment begins to transmit measurement report to the serving eNodeB when equation 1 remains satisfied for the time interval named Time To Trigger. Once the serving eNodeB receives the measurement report, it initiates a handover request with the target eNodeB bases on the signal strength.
Fig. 2. Illustrating the triggering time of A3 measurement report
A.Handover Failures and Ping Pong handovers
Trigger time is very important for happening handover. When the triggering time for measurement report transmission varies then there will be a failure in handover. Based on this the handover failure are classified. They are,
Too Early handover
Triggering time in this handover will tend to the lower RSRP level of the target cell.
Too Late handover
Triggering time in this handover will tend to the lower RSRP level of the serving cell.
Handover to wrong cell
In this failure case it involves three cells i.e. the serving, target, and the reconnected cells. When the handover occurs with the unstable received power with the target cell then the failure occurs.
B.Adjustment of handover parameters
lead to handover failure events. Hence the adjustment of the measurement report triggering timing is very important for mobility changes. In real systems the mobility differs between the neighbor cells, this is mainly due to the change in mobility environment between the serving and the target cell. Hence these parameter adjustments should be independently taken care. To perform the parameter adjustment we can use Time to Triggering or Handover Margin rates. But Time to Triggering value cannot be adjusted for each neighboring cell because triggering time for each cell is different. Hence we can consider the Handover Margin for adjusting the parameters with respect to neighboring cells. Therefore, comparatively handover margin is more appropriate than time to trigger value. With the help of handover margin value we can adjust the measurement report triggering time.
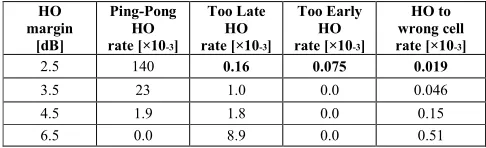
The below Table I is the basement for our analysis in this paper. This table is obtained from the base paper [1]. By making use of this table we are considering the handover failure rates which is calculated using the below formula when same handover margin is applied to all the cells.
From Table I we observe that, when the handover margin increases the Too Late handover rate and Handover rate to wrong cell also increases. On the other side Ping- Pong handover rate and Too Early handover rate decreases with the increase in handover margin. Considering the relations between handover failure events and the handover margin we developed a table for adjusting the parameters to reduce the handover failure events. From Table II, adjusting the parameters for reducing the handover failure events are different in some handover failures. Hence, the handover margin adjustment should be performed by considering each kind of handover failures that occurs. Meanwhile we need to make sure that the minimum occurrence of Ping – Pong handover rate. Hence we consider Ping – Pong handover rate under the handover failure event. The optimization criterion is represented below:
Minimize ε(T(a, b)) + γ(T(a, b)) (2)
Where, ε(T(a, b)), γ(T(a, b)) denotes the handover failure and Ping- Pong handover rate respectively.
II.MATHEMATICAL ANALYSIS
Apply same handover margin to all the neighbor cells and evaluate the handover failure rates. In the evaluation process, we use different mobility speeds with different handover margins. As the mobility speed increases the handover margin criteria keeps decrease for maintaining a minimized handover failure rate. From the analysis as shown in the Table I we can consider the optimized handover margin as 4.5 dB. Through which the overall handover failure rate can be reduced for different mobility speeds. From now on we will discuss the
parameter adjustment based on the change in mobility speed. Here is the useful fact for the parameter adjustment i.e., user equipment mobility affects the occurrence of each handover failure events. Considering an example, user equipment with high mobility leads to Too Late handover rather than Too Early handover, similarly user equipment with low mobility leads to Too Early handover rather than Too Late handover. Therefore change in the mobility of user equipment that deals with the occurrence of handover failure event can be utilized for parameter adjustment. On the basis of above facts, the adjustment procedure can be designed as shown in the Figure 6 that represents the flow diagram.
We try to implement another strategy based on the data obtained from user mobility characteristics. This is considered as one of the module in self- organizing method. It can be implemented either in eNodeB or other network elements, which are determined by user mobility database.
A.User Mobility Database:
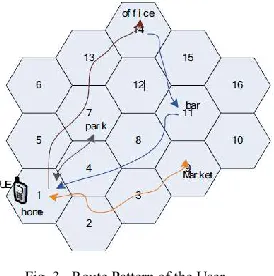
Mobility routes for most of the people are same every day. By recording the user mobility information, we can get the route pattern of the user. The route pattern consists of Cell ID and User Equipment ID. Suppose user travels from home to the office the corresponding Cell IDs are recorded in the User Mobility Database. If the route pattern for the users is determined then the appropriate parameters can be configured for the user equipment.
From the Figure 3 if we consider Cell IDs as vertices and handover parameters as edges, then the route pattern for a user is constructed as a graph path i.e., shown in the Figure 4. For vertices we use frequency and time period, for edges we use Time to Trigger, Hysteresis value and other handover parameters. These attributes are adaptive and they are updated based on the handover results. Another index used is User Equipment ID this can be IMEI or IMSI. This User Equipment ID speeds up the search in the User Mobility Database.
Fig. 3. Route Pattern of the User
User Mobility Database or not recorded into the User Mobility Database. The algorithm is shown below with the flow diagram in the Figure 6. The storage points can be User Equipment, eNodeB, MME, or other network elements which have enough storage capacity and strong computing power.
Fig. 4. Graph path representation of Route Pattern
III.METHODOLOGY
By performing this procedure some of the unnecessary cells and their corresponding edges are eliminated from the graph and the optimized routes are retained in the graph.
Second concept is updating handover parameters. These parameters are obtained by the hysteresis eNodeB when it receives the radio link failure from the source eNodeb or target eNodeB. The radio link failure is caused due to the Too Late handover or Too Early handover.
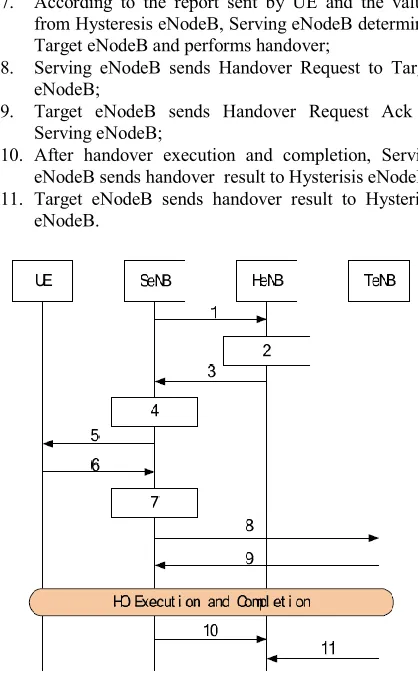
Final step is selecting the appropriate handover parameter and configuring using those parameters. When the handover is completed, the update message is sent to the hysteresis eNodeB. Now the target eNodeb will act as a Serving eNodeB which prepares for the next handover with the optimized values obtained from the hysteresis eNodeB. From this optimal parameter values and the report from the user equipment the Serving node will determines the target eNodeB and makes handover decision. The complete process is described with Figure 5 below.
1. Serving eNodeB sends request to Hysteresis eNodeB for handover values;
2. Hysteresis eNodeB searches database based on the UE ID and cell ID and finds the appropriate handover based on time period, route pattern match and frequency.
3. Hysteresis eNodeB sends the response to the Serving eNodeB with the handover attributes values;
4. Serving eNodeB adjusts and gets the new values according to other impact factors.
5. Serving eNodeB sends the values to user equipment in measurement control message;
6. User equipment generates measurement report and sends it to Serving eNodeB;
7. According to the report sent by UE and the values from Hysteresis eNodeB, Serving eNodeB determines Target eNodeB and performs handover;
8. Serving eNodeB sends Handover Request to Target eNodeB;
9. Target eNodeB sends Handover Request Ack to Serving eNodeB;
10. After handover execution and completion, Serving eNodeB sends handover result to Hysterisis eNodeB; 11. Target eNodeB sends handover result to Hysterisis
eNodeB.
Fig. 5. Handover process performed based on the algorithm.
A.Algorithm
1 Establish eNodes and UE.
2 Implement LTE protocol on the eNodes and UE’s. 3 Record Cell ID and UE ID during mobility and store
them in the database
4 if (UE ID = New UE ID) &&(Cell ID = New Cell ID) then
Choose destination = Last Cell ID in the database Return to Step 3
else
Apply handover condition
5 Obtain RSRP readings from the eNodes to perform handover.
6 if (Cell ID of HO (i) = Cell ID of HO (i+3)) && ((Targ.RSRP - Serv.RSRP) < HO Margin)
then
Analyze the handover failure rate
else
Decrease HO Margin else
Don’t perform HO
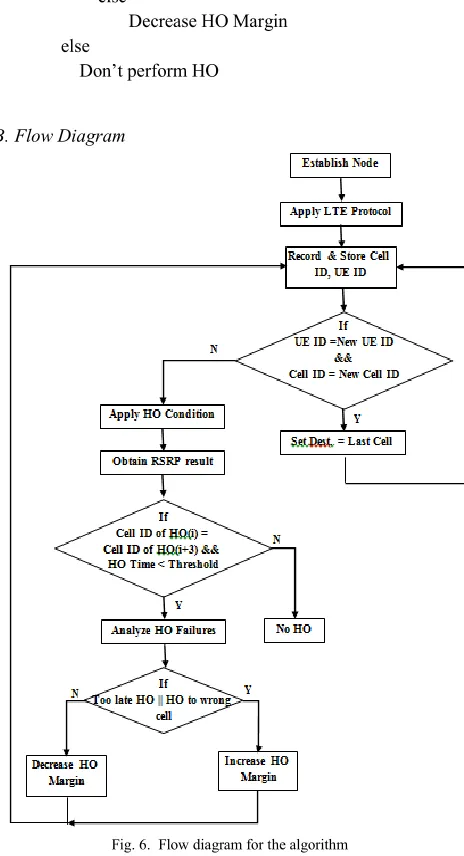
B.Flow Diagram
Fig. 6. Flow diagram for the algorithm
Code flow of the paper is illustrated with the help of the above flow diagram and the algorithm. This provides the brief description of the project.
IV.RESULTS
The proposed algorithm optimizes the handover parameters by adjusting the handover margin when the user equipment mobility changes. Varied user equipment mobility will directly impact on the handover failure events; this is highlighted in the proposed algorithm. By this it adaptively adjusts the handover margin to the user equipment mobility. From this algorithm we demonstrated that the handover failure and the ping pong handover rates are reduced successfully by considering several scenarios. When the mobility changes from 3 km/h random walk mobility to 300 km/h linear motion, the handover failure
rate is increased by 19%. for random walk and the varied velocity the handover failure rate is reduced to 0.2% by using the proposed algorithm.
A.RSRP and RSRQ analysis for different mobility rates The Figures 7 and 8 shows the RSRP and RSRQ representation between the eNodeBs and user equipment for different handover margin and with a constant speed of 200m/s. From this we can clearly analyse that as the RSRP and RSRQ value of the serving cell decreases then it switches to the neighbour cell. We can also conclude that the selecting handover margin of 4.5 can give better result.
Fig. 7. RSRP and RSRQ representation of user equipment mobility =200m/s and hysteresis= 2.5.
Fig. 8. RSRP and RSRQ representation of user equipment mobility =200m/s and hysteresis= 4.5.
The Table III provides the clear picture of selecting the handover margin for different speed of the user equipment mobility. From these readings the best handover margin to perform handover procedure is 4.5. This hysteresis value can be used for all the user equipments with varied mobility speeds.
HO margin
[dB]
Ping-Pong HO rate [×10-3]
Too Late HO rate [×10-3]
Too Early HO rate [×10-3]
HO to wrong cell rate [×10-3]
2.5 140 0.16 0.075 0.019
3.5 23 1.0 0.0 0.046
4.5 1.9 1.8 0.0 0.15
6.5 0.0 8.9 0.0 0.51
TABLE II. THE PARAMETER ADJUSTMENT DIRECTION
TABLE III. ANALYSIS OF HANDOVER MARGIN FOR DIFFERENT
MOBILITY RATES
V.CONCLUSION
The algorithm will cost some computing power and storage capacity, and compared to standard handover process. But compared to the cost of unnecessary handovers and failure handovers, it is worth to be used. The lives of most people are regular, so their mobile routes are regular. The algorithm helps us to find these regularities to reduce handover number in the routes and provide more precise parameters for users.
Our focus is to reduce the handover failures and unnecessary handover. This can be achieved by using above algorithm. Only the area of improvement is reducing the cost of implementation. Another area of improvements is, this
algorithm best suits for rural areas because the eNodeBs are separated with more distance. But in case of urban areas the eNodeBs are densely clustered. In such case the handover margin cannot be less. It should be considered more than the specified value.
REFERENCES
[1] Koichiro Kitagawa, Toshihiko Komine, Toshiaki Yamamoto, Satoshi Konishi, “A Handover Optimization Algorithm with Mobility Robustness for LTE systems,” 2011 IEEE 22nd International Symposium on Personal, Indoor and Mobile Radio Communications.
[2] Heng Zhang, Senior Researcher, “A User Mobility Analysis
Assistive MRO Algorithm for Handover Parameters
Optimization in LTE SON System,” 2012 IEEE Wireless Advanced (WiAd)
[3] 3GPP LTE TR 36.902 version 9.3.1 Release 9 “LTE; Evolved Universal Terrestrial Radio Access Network (E-UTRAN); Self-configuring and self-optimizing network (SON) use cases and solutions”
[4] 3GPP TS 32.500 version 9.0.0 Release 9 “Self-Organizing Networks (SON); Concepts and requirements”
[5] 3GPP TS 36.300 version 10.5.0 Release 10 “LTE; Evolved Universal Terrestrial Radio Access (E-UTRA) and Evolved Universal Terrestrial Radio Access Network (E-UTRAN); Overall description; Stage 2”
[6] 3GPP TS 36.214 version 10.1.0 Release 10 “LTE; Evolved Universal Terrestrial Radio Access (E-UTRA); Physical layer; Measurements”
[7] 3GPP TS 36.331 version 10.3.0 Release 10 “LTE; Evolved Universal Terrestrial Radio Access (E-UTRA); Radio Resource Control (RRC); Protocol specification”
[8] 3GPP standardization, “Evolved Universal Terrestrial Radio Access (EUTRA) and Evolved Universal Terrestrial Radio Access Network (EUTRAN) Overall description Stage 2,” TS 36.300 v9.2.0, January 2010, http://www.3gpp.org/
[9] 3GPP standardization, “Self-organizing networks (SON) concepts and requirements (Release 9),” TS 32.500 v9.0.0, December 2009, http://www.3gpp.org/.
[10]3GPP standardization, “Self-configuring and self-optimizing network (SON) use cases and solutions (Release 9)”, TR 36.902 v9.1.0, March 2010.
[11]Z. Wei, "Mobility robustness optimization based on UE mobility for LTE system," 2010 International Conference on Wireless Communications and Signal Processing (WCSP), pp.1-5, 21-23