Performance Comparison of K-means and
Rectangle Segmentation Algorithms in
Compression of Color Images
Kitty Arora Manshi Shukla Student Assistant Professor
RIMT-Institute of Engineering and Technology RIMT-Institute of Engineering and Technology Mandi Gobindgarh ,Punjab Mandi Gobindgarh ,Punjab
Abstract-With Development of Science, Advancement of Technology, lot of Images are transported in compressed data formats.The use of color in image processing is motivated by two Principal factors; First color is a powerful descriptor that often Simplifies object identification and extraction from a scene. Second, human can discerned thousands of color shades and Intensities, compared to about only two dozen shades of gray.The main objective of this paper is to compare performance based on quality measures towards the compression of color images using K-means and Rectangle segmentation algorithms. In this paper, color image compression using Rectangle Segmentation is proposed, in which adjacent pixel points satisfying consistency condition are viewed as the same image block. Also, without the restriction of square which abides to 2n, the image block can be rectangle which reduces the amount of block, and improves the compression ratio. The algorithm is tested On several color images and results are compared with other image compression technique like K-means in terms of performance metrics like PSNR , CR,Execution Time etc.The experimental resuls show the K-mean algorithm is better than Rectangle segmentation in terms of PSNR leads to good quality Image , effect of changing cluster size on image quality is noticed.
Keywords-Color Image compression, Rectangle segmentation, Sparse Matrix, K-means.
1. INTRODUCTION
An image is essentially a 2-D signal processed by the human visual system. The signals representing images are usually in analog form. However, for processing, storage and transmission by computer applications, they are converted from analog to digital form.Image compression is a method through which we can reduce the storage space of images, videos which will helpful to increase storage and transmission process’s performance. Image compression may be lossy or lossless. Lossless compression involves with compressing data which, when decompressed, will be an exact replica of the original data .In Lossy compression some of the finer details in the image can be sacrificed for the sake of saving a little more bandwidth or storage space. Humans have always seen the world in color but only recently have been able to generate vast quantities of color images with such ease. In the last three decades, we have seen a rapid and enormous transition from gray scale images to color ones.
Today, color and multi spectral properties of images are becoming increasingly crucial to the field of image
processing often extending or replacing previously Known gray scale techniques. In a digital true-color image, each color component is quantized with 8 bits and so a color is specified with 24 bits. As a result, there are 224 possible colors for the image. Furthermore, a color image usually contains a lot of data redundancy and requires a lot of storage space. In order to lower the transmission and storage cost image compression is desired[2].
2. IMAGE COMPRESSION
Image compression is getting more and more attention day by day as high speed compression and good quality of image are in high demand. One advantage of an Image compression is to reduce the time taken for transmission of an image. Different image compression methods are presented in literature.
decomposition of image compression Method characters with relative simplicity and fast calculation, however compression ratio is not very high. In order to overcome this flaw, one new segmentation method named the Rectangle Segmentation is proposed, in which adjacent pixel points satisfying consistency condition are viewed as the same image block. Also, without the restriction of square which abides to 2n, the image block can be rectangle which reduces the amount of block, and improves the compression ratio. Image compression ratio can be further augmented by combining the storage method of sparse matrix. Therefore, a new image compression algorithm proposed named the Rectangle Segmentation and Sparse Matrix Storage (RSSMS) compression algorithm [10].
Organization of this paper as follow: section 2 introduces image compression methods, then Section 3 describes our proposed work and in section 4 we present our results and the last section is conclusion.
3. PROPOSED METHODOLOGY
In this paper we have performed color image Compression by using Rectangle segmentation algorithm and comparative analysis with K-means algorithm in terms of Performance metrics i.e PSNR,CR,Execution time etc.
3.1 Rectangle Segmentation Algorithm
To overcome drawback of Quarter-tree Decomposition method a new method called Rectangle segmentation and Sparse Matrix Storage is proposed by Shengli Chan[9].In Quarter-tree Decomposition method,An image is segmented into four square blocks A layer-by-layer by the size of 2n in the Quarter-tree decomposition method. Any image block meeting consistency condition but not size of 2n will still be segmented into different smaller blocks.
3.1.2 FLOWCHART OF ALGO.
Working of Rectangle Segmentation algorithm is explained in terms of flowchart:
Fig.1 Rectangle Segmentation Algorithm
3.2 K-means Algorithm
K -means is a simple algorithm that has been adapted to many problem domains. K-means clustering is a method of vector quantization originally from signal processing, that is popular for cluster analysis in data mining. K-means clustering aims to partition n observations into k clusters in which each observation belongs to the cluster with the nearest mean, serving as a prototype of the cluster. Clustering technique is used to put similar data items in a same group. K-Means algorithm is an unsupervised clustering algorithm that classifies the input data points into multiple classes based on their inherent distance from each other.K-means is a widely used partitional clustering method. While there are considerable research efforts to characterize the key features of K-means clustering, further investigation is needed to reveal whether the optimal number of clusters can be found on the run based on the cluster quality measure.
3.2.1 FLOWCHART OF ALGO.
Working of Rectangle Segmentation algorithm is explained in terms of flowchart:
Fig.2 K-means Algorithm
Divide the Original Image into 4*4 Size Quad tree blocks
Declare and Initialize the K No of Clusters
Input Source Image
Compute Centroids of each cluster based on mean value of all thepoints belonging to that cluster
Compute closest Centroid for each point based on distance between the point and the centroids
Place Adjacent pixels pointssatisfying consistency condition as the same image Block
Computes the Performance Metrics i.e. PSNR, CR, Execution Time etc.
Reconstructed
Image/Compressed Image
Read the Image File
Declare and initialize no of times K-Means iteration run to find best centroids
Compute final cost of all the points belonging to their respective clusters
Display final compressed image for each iteration
3.3 Block Diagram of Proposed Research Work
Working of Proposed Research Work is explained in terms of Block Diagram:
• Fig 3 Enumerates the block diagram of compression of color Images using K-Mean Clustering and Rectangle segmentation algorithms.
• The same set of Input Images/Test Images is applied to both of algorithms and their results are evaluated. .
• Evaluation of results is done by using
Compression Metrics i.e. PSNR,CR,Execution Time.
• The motive of this research is to compress the color images and measure their Quality parameters for comparative analysis.
Input /Source
Image
Compressed Image
Fig3.Proposed Research Methodology
4. EXPERIMENTAL RESULTS AND ANALYSIS
In this section, We descried the experimental verification of both algorithms on different set of color images as test images to perform comparative analysis using Compression metrics like PSNR,CR,Execution Time etc.The experimental results show that K-means Algorithm outperforms Rectangle Segmentation Algorithm in terms of Quality of color images.The Quality of Reconstructed Image is measured in terms of Compression metrics like PSNR,CR,Execution Time etc.The simulation results are performed using MATLAB SOFTWARE.Different Quality metrics are:
a)PSNR
Peak Signal to Noise Ratio (PSNR) is one of the quantitative measures for image quality evaluation. PSNR is based on Mean Square Error (MSE).
PSNR =10 log10 (255 ^ 2 / MSE ) (1) where MSE is the Mean Square Error and is used to obtain the total amount of difference between two images. MSE iscalculated as below:
M S E =( ∑ I ( m , n ) -D I ( m , n ) ) ^ 2 / ( M * N ) (2)
Where M*N are the size of original image, I(m,n) andDI(m,n) are original image and decompressed image,respectively.
b)Compression Ratio:
Compression Ratio (CR) is defined as follow:
CR= Original file size/ Compressed file size (3)
c)Execution Time:
The time taken by algorithm to compress the image is called execution time of that algorithm.it is generally measured in seconds or minute.
4.2 Simulation Results of K-means algorithm
To evaluate the Performance of K-means Algorithm,experiments are conducted on several color images as test images using MATLAB Version 7.10. I
Fig1.Giraff.jpg(PSNR=108.7843db)
Fig2.lena.png( PSNR= 119.1838db)
K-means Algorithm
Rectangle Segmentation Algorithm
Fig3.Babbon.tiff(PSNR=116.41db)
Fig4.Peppers.tif(PSNR=124.1785db)
Fig5GreatBarrierReef.jpg(PSNR=133.0857)
4.3 Simulation Results of Rectangle Segmentation algorithm
To evaluate the Performance of Rectangle Segmentation Algorithm,experiments are conducted on several color images as test images using MATLAB Version 7.10. I
Test Image 1:Giraff.jpg
(a)
(b)
100 200 300 400 500 600 700 800 900 1000 100
200
300
400
500
600
700
800
900
1000
Rectangular blocks on Padded Image
(c)
(d)
Fig6.Giraff.jpg(PSNR=77.2108db) a)Original Image b)Padded Image c)Rectangular blocks on Padded Image
Test Image 2:Lena.png
Original Image
50 100 150 200 250 300 350 400 450 500 50
100 150 200 250 300 350 400 450 500
(a) Original Padded Image
50 100 150 200 250 300 350 400 450 500 50
100 150 200 250 300 350 400 450 500
(b)
50 100 150 200 250 300 350 400 450 500 50
100 150 200 250 300 350 400 450 500
Rectangular blocks on Padded Image
(c) Decoded Image
50 100 150 200 250 300 350 400 450 500 50
100
150
200
250
300
350
400
450
500
(d)
Fig7.Lena.png (PSNR=86.75db) a)Original Image b)Padded Image c)Rectangular blocks on Padded Image
d)Reconstructed Image
Test Image 3:Baboon.tiff
Original Image
50 100 150 200 250 300 350 400 450 500 50
100 150 200 250 300 350 400 450 500
(a) Original Padded Image
50 100 150 200 250 300 350 400 450 500 50
100 150 200 250 300 350 400 450 500
(b)
(c) Decoded Image
50 100 150 200 250 300 350 400 450 500 50
100
150
200
250
300
350
400
450
500
(d)
Fig8.Baboon.tiff (PSNR=84.25db) a)Original Image b)Padded Image c)Rectangular blocks on Padded Image
TestImage4:Peppers.tiff Original Image
50 100 150 200 250 300 350 400 450 500 50
100 150 200 250 300 350 400 450 500
(a) Original Padded Image
50 100 150 200 250 300 350 400 450 500 50
100 150 200 250 300 350 400 450 500
(b)
50 100 150 200 250 300 350 400 450 500 50
100
150
200
250
300
350
400
450
500
Rectangular blocks on Padded Image
(c) Decoded Image
50 100 150 200 250 300 350 400 450 500 50
100 150 200 250 300 350 400 450 500
(d)
Fig9.PeppersRGB.tiff (PSNR=86.75db) a)Original Image b)Padded Image c)Rectangular blocks on Padded Image
d)Reconstructed Image
TestImage5:GreatBarrierReef.jpg
Original Image
100 200 300 400 500 600 700 800 900 1000 100
200
300
400
500
600
(a) Original Padded Image
100 200 300 400 500 600 700 800 900 1000 100
200
300
400
500
600
700
800
900
1000
(b)
100 200 300 400 500 600 700 800 900 1000 100
200
300
400
500
600
700
800
900
1000
Rectangular blocks on Padded Image
(c) Decoded Image
100 200 300 400 500 600 700 800 900 1000 100
200
300
400
500
600
(d)
Fig10.GreatBarrierReef.tiff (PSNR=79.39db) a)Original Image b)Padded Image c)Rectangular blocks on Padded
Table1.Comparative Analysis of K-mean and Rectangle Segmentation Algorithm
4.3 Comparative Analysis
Comparative analysis of both the algorithms are done using performance metrics like PSNR,CR,Execution Time etc.The comparative results are shown in form of table: 1
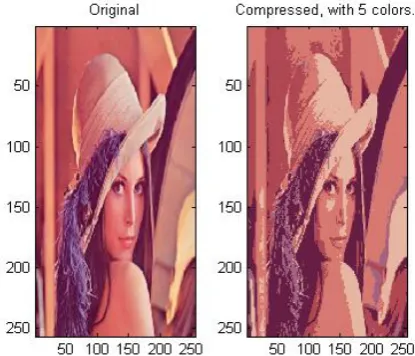
4.4 K-mean Based Image Compression Quality Using Different no of Cluster sizes
To evaluate the effect on quality of Image in terms of PSNR,when same set of image is applied under different cluster sizes(K=5,K=10,K=20,K=30).
Test Image Lena.Tiff
Original
100 200 300 400 500 50 100 150 200 250 300 350 400 450 500
Compressed, with 5 colors.
100 200 300 400 500 50 100 150 200 250 300 350 400 450 500 Fig11(a)K=5(PSNR=116.41db) Original
100 200 300 400 500 50 100 150 200 250 300 350 400 450 500
Compressed, with 10 colors.
100 200 300 400 500 50 100 150 200 250 300 350 400 450 500 Fig11(b)K=10(PSNR=120.0005db) Original
100 200 300 400 500 50 100 150 200 250 300 350 400 450 500
Compressed, with 20 colors.
100 200 300 400 500 50 100 150 200 250 300 350 400 450 500
Fig11 (c) K=20(PSNR=127.93db)
Original
100 200 300 400 500 50 100 150 200 250 300 350 400 450 500
Compressed, with 30 colors.
100 200 300 400 500 50 100 150 200 250 300 350 400 450 500
Fig11 (d) K=30(PSNR=149.98db)
TableII.Effect of Changing Cluster Size on Image Quality of Lena
Cluster Size
Performance metrics
PSNR CR Execution
Time(sec)
K=5 116.32 0.00039 78.68/1.31min
K=10 120.19 0.00056 314.96/5.24min
K=20 127.93 0.00088 1268.02/21.13min
K=30 149.98 0.00118 2998.97/49.98min
Fig12.Effect of Changing Cluster Size on PSNR of Lena Image 0 20 40 60 80 100 120 140 160
PSNR 116.32 120.19 127.93 149.98 K=5 K=10 K=20 K=30
Increase in Cluster Sizes increases PSNR of Reconstructed Images
Test Image
Performance Metrics Algorithm Used
K-means Rectangle Segmentation
PSNR CR Execution
Time(sec) PSNR CR
Execution Time(sec)
1.Giraff.jpg 108.78 0.0018 112.35 77.21 0.27 115.89
2.Lena.png 119.18 0.00065 77.17 86.75 0.035 26.53
3.Baboon.tiff 116.41 0.00039 78.40 84.25 0.112 177.87
4.Peppers.tiff 124.17 0.00037 41.65 86.75 0.031 40.41
5. CONCLUSION AND FURTHER RESEARCH
In this Paper, We have discussed Comparison between Rectangle Segmentation and K-means Algorithms using color images as test images in terms of Performance metrics like PSNR,CR,Execution time etc.
From the Table 1,PSNR value of K-means algorithm is far better than Rectangle Segmentation which leads to better Image Quality,But Compression Ratio of K-means algorithm is low. The execution time of K-mean algorithm is low as compared to Rectangle Segmentation algorithm in most of cases as per Experimental Analysis.
From Table 2, Effect of Changing cluster size is measured in terms of PSNR. High PSNR leads to High Quality of Reconstructed Image. As the Value of K increases, Higher is PSNR from Experimental study. From the result Images in section 4.4 it is clear that when value of K is gradually increasing, the image quality also gradually better, and we noticed. For, K=30 the reconstructed image is almost similar to original image.
Further Directions to Research Work includes Improving Execution Time /Speed of K-mean Algorithm as Value of K increases. Further Compression Ratio of K-mean Algorithm is improved ,may be combined with sparse matrix storage concept to improve CR. To Improve the Speed of K-mean Algorithm, Concept of Coresets can be used which is till now applied to 3D datasets in area of data mining[15]. Both of algorithms in future also experimented with Medical Images like MRI,X-ray etc.
REFERENCES
[1] Digital Image Processing Using Matlab by Rafael C. Gonzalez & Richard E. Woods.
[2] S. J. Sangwine and R. E. Horne, (1998). “The Color Image Processing Hand Book”, Chapman &Hall, 1st Ed.
[3] XiHongZHOU” Research on DCT-based Image Compression Quality”IEEE, 2011.
[4] Sonja Grgic, Mislav Grgic, Branka Zovko-Cihlar “Performance Analysis of Image CompressionUsing Wavelets”,IEEEVol. 48, No. 3, June 2001.
[5] Kitty Arora, Manshi Shukla, “A Comprehensive Review ofImage Compression Techniques” International Journal of Computer Science and Information Technologies(IJCSIT),Vol 5, No.2,2014 [6] Shiping Zhu, Juqiang Chen” Research on Fractal Image Coding
Methods” International Conference on Computer Science and Information Processing (CSIP),2012.
[7] SeyyedHadi ,Hashemi-Berenjabad, Ali Mahloojifar, and Amir Akhavan” Threshold Based Lossy Compression of Medical Ultrasound ImagesUsing Contourlet Transform” IEEE,2011.
[8] Anilkumar Katharotiya, Swati Patel1 Mahesh Goyani, “ComparativeAnalysis between DCT & DWT Techniques of Image Compression”Journal of Information Engineering and Applications Vol 1, No.2,2011.
[9] Tao Wang” Research of Image Compression Based on Optical Wavelet Transform”IEEE, 2006.
[10] Shengli Chen, Xiaoxin Cheng, Jiapin Xu” Research on ImageCompression AlgorithmbasedonRectangleSegmentation and Storagewith Sparse Matrix”IEEE, 2012.
[11] Tassos Markas” Quad Tree Structures For Imagcompression Applications” Information Processing & Management Vol. 28, No. 6, pp. 707-721, 1992.
[12] Abhishek Kaushik, Maneesah Gupta,”Analysis of image compression algorithms”, International journal of engineering research andapplication, April 2012
[13] GREGORY M.HUNTER,”Operations on Images Using Quad trees” IEEE, 1979.
[14] Azhar Rauf, Sheeba, ” Enhanced K-Mean Clustering Algorithm to Reduce Number of Iterations and Time Complexity” Middle-East Journal of Scientific Research, 2012.
[15] Gereon Frahling ” A fast k-means implementation using coresets” , 2005.
AUTHOR PROFILE
Kitty Arora received the B.Tech degree in Computer Science and
Engineering from the Institute of MIMIT MALOUT, Punjab Technical University (PTU), in 2011.She is currently doing M.Tech at RIMT Mandigobindgarh, Punjab under Punjab Technical University (PTU).Her area of research includes Digital Image Processing.