Evaluating Multi-party Multi-modal Systems
Laurie E. Damianos*, Jill Drury*, Tari Fanderclai†, Lynette Hirschman*, Jeff Kurtz*,
Beatrice Oshika*
The MITRE Corporation
202 Burlington Road; Bedford, MA 01730 USA *{laurie, jldrury, lynette, jkurtz, bea} @mitre.org
Abstract
The MITRE Corporation’s Evaluation Working Group has developed a methodology for evaluating multi-modal groupware systems and capturing data on human-human interactions. The methodology consists of a framework for describing collaborative systems, a scenario-based evaluation approach, and evaluation metrics for the various components of collaborative systems. We designed and ran two sets of experiments to validate the methodology by evaluating collaborative systems. In one experiment, we compared two configurations of a multi-modal collaborative application using a map navigation scenario requiring information sharing and decision making. In the second experiment, we applied the evaluation methodology to a loosely integrated set of collaborative tools, again using a scenario-based approach. In both experiments, multi-modal, multi-user data were collected, visualized, annotated, and analyzed.
1.
Introduction
The Evaluation Working Group (EWG) in the Defense Advanced Research Projects Agency (DARPA) Intelligent Collaboration and Visualization (IC&V) program has developed a methodology for evaluating multi-modal groupware systems and collecting data on human-human as well as human-computer interactions.1 The methodology consists of a framework for describing collaborative systems, a scenario-based evaluation approach, and metrics for evaluating the various components of collaborative systems.
The EWG at the MITRE Corporation designed and ran two sets of experiments to validate the methodology, gain insight into collaboration, and improve data collection techniques. Both experiments involved the evaluation of groupware systems being used to perform a collaborative task. In both experiments, multi-user, multi-modal data, including spoken language, were collected, visualized, annotated, and analyzed.
The first experiment, the Map Navigation Experiment (Kurtz et. al, 1999), was a comparison of two configurations of a multi-modal collaborative application: one with audio available for human-human communication, and one with text chat only. In the experiment, pairs of participants worked jointly on a task which required information sharing. Our goal was to demonstrate a relationship between the use of audio and a number of other factors: time to task completion, number of turns, amount of participation, user satisfaction, and styles of human-human communication. The resulting analysis did show that task completion time was affected by the audio configuration used.
In the second experiment, the CVIM (Collaboration, Visualization / Information Management) Laboratory Experiment, the evaluation methodology was applied to a loosely integrated set of collaborative tools, again using a scenario-based approach (Damianos et al., 2000).
1 This work was funded, in part, by DARPA under contract number DAA-B07-99-C-C201.
The purpose of the second laboratory experiment was to evaluate the utility of integrated tools for performing semi-realistic military operations. The set of systems chosen for integration included a shared document management system, an Internet search engine with an integrated language translation system, an audio conferencing tool, and a shared whiteboard. In this experiment, we learned about the complexity of designing effective experiments with research software, the user interface issues when using multiple tools simultaneously, and the different ways people work together.
2.
Evaluation Methodology
To date, there are few well-accepted, inexpensive methods for evaluating interactive systems. Computer-supported cooperative work involves multiple humans interacting with networked systems. This makes the problem at least an order of magnitude more complex than single user systems because it is necessary to deal with the human-human interaction and the change in workflow that comes with the use of collaborative tools. The heuristic or expert reviews used effectively for single user interfaces do not take into account these additional dimensions.
The Evaluation Working Group was established to define reliable and low-cost methods of evaluating collaborative environments. The Evaluation Methodology Document (Drury et al., 1999) describes the EWG’s work, focusing primarily on inexpensive evaluation of systems in the early stages of their development. Researchers can use the methodology to evaluate systems in an iterative process. User groups can apply these evaluation methods to choose a collaborative system that supports their requirements.
The methodology provides a framework for describing a system, illustrates the use of scenarios in performing evaluations, and identifies easy-to-measure correlates of more important, but complex, behaviors.
2.1.
The Framework for Evaluation
and Kraemer (1993) consists of four levels: requirement, capability, service, and technology, each of which provides a different view into a collaborative system.
At the top level, requirements are generated from the types of collaborative tasks a user group might need to perform, such as problem solving, planning, brainstorming and information dissemination. The requirement level also describes group characteristics (size, location) and social protocols (agenda, roles, meeting conduct). The capability level describes the system functionality which enables user groups to perform tasks, e.g., shared workspace. The service level includes the mechanisms which support capabilities, and the technology level consists of the specific implementations of those services. For example, in order to support a group’s requirement for a collaborative planning task, communication would be a necessary system capability. Email is a service that would support synchronous communication, and Netscape Messenger is an example of an implementation of electronic mail.
The framework can be applied top-down to determine the services and technology needed to match a group’s requirements. Alternatively, a bottom-up approach reveals the types of collaboration supported by a given system. The two approaches can be combined in order to compare multiple systems with respect to a set of requirements. For example, given the systems to compare, one would map the existing services onto capabilities. From the top, the required tasks, group characteristics, and social protocols would map onto the available capabilities that support those requirements.
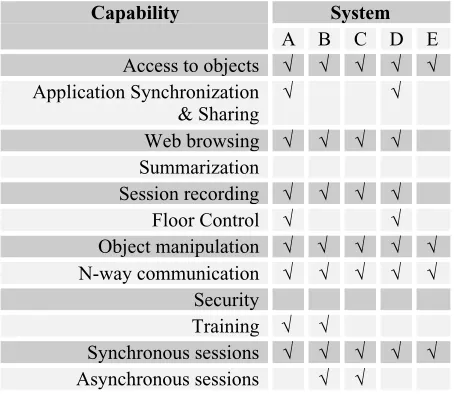
Table 1, below, shows a comparison of five systems at the capability level. This table was generated from the bottom-up; the five technologies were mapped onto services which then were mapped onto the capabilities listed. Working from the top-down, one could easily choose which system better supports a set of given requirements. In this example, System A offers the most capabilities but cannot be used asynchronously and requires training. System A also supports application sharing while System C does not.
System Capability
A B C D E
Access to objects √ √ √ √ √ Application Synchronization
& Sharing
√ √
Web browsing √ √ √ √ Summarization
Session recording √ √ √ √
Floor Control √ √
Object manipulation √ √ √ √ √ N-way communication √ √ √ √ √
Security
Training √ √
Synchronous sessions √ √ √ √ √ Asynchronous sessions √ √
Table 1: Capability comparison of five systems. (Only a partial listing of capabilities is shown.)
2.2.
Scenario-based Evaluation
Scenarios provide a versatile and reproducible means of evaluating a system. A scenario is an instantiation of one or more representative work tasks (McGrath, 1984) and transitions linking those tasks. A scenario also specifies social protocols and group characteristics. The granularity of the scenario is dictated by the level of the framework; a scenario can be highly scripted or loosely defined. For example, a scenario might consist of a one-to-many briefing of open issues followed by a brainstorming session open to the entire group and then a final decision-making activity limited to a subset of the group.
2.3.
Metrics
The Methodology Document specifies possible evaluation metrics associated with each level of the framework. The levels help frame the problem and allow the evaluator to focus on different aspects of evaluation. These suggested metrics can be collected manually or via automated data capture. Combinations of these metrics can be used in evaluating more complex behavior of both system and user. For example, at the requirement level, task outcome can be evaluated by combining measures for successful task completion, the number of generated artifacts, expert ratings on quality of outcome, and user ratings of outcome.
3.
The Experiments
During the three-year lifetime of the Evaluation Working Group, the MITRE Corporation conducted two experiments involving collaborative research tools. The experiments shared common goals: to exercise the scenario-based methodology defined by the EWG, to provide feedback to the developers of the research systems, to improve data collection techniques, and to gain insight into human-human interactions as well as human-computer interactions.
3.1.
The Map Navigation Experiment
People cannot work together without coordinating their efforts, and that coordination requires information exchange, or communication. Furthermore, there are multiple ways of communicating different types of information in order to accomplish different kinds of work. This raises the question: which communication modalities allow efficient exchange of various types of information (Krauss and Fussell, 1990)? Our interest in this issue was partial motivation for the design of our first experiment.
The Map Navigation Experiment (Kurtz et al., 1999) was designed to compare two configurations of a multi-modal collaborative application: one with audio available for human-human communication and one with text chat only. In the experiment, pairs of participants were asked to work jointly on a map navigation task in which sharing of information was crucial to completing the task.
involved a division of labor; one participant annotated the map while the other planned the route around the obstacles. Strategy C was a trial and error strategy where neither participant annotated the map, and the route planning was entirely verbal, one step at a time. The strategy used by a group frequently changed across trials and even within a single trial. The evolution of strategies usually started with Strategy C and ended with Strategy A. We had hoped we could show a relationship between strategy selection or strategy shift and other factors such as limitations of the tools, demands of the task, prior working relationships of the participants, or prior experience in using collaborative tools. However, with the small sample size, we were not able to show any correlation.
3.2.
The CVIM Experiment
The second laboratory experiment involved evaluating a loosely integrated set of tools. We were tasked to evaluate the utility of these tools for performing military operations. Additionally, we wanted to apply the EWG methodology and data collection techniques to further our own research, and we wanted to gain more insight into how people collaborate.
3.2.1. The Tools
The tools for this experiment were selected from those under development in DARPA’s Collaboration, Visualization / Information Management program. We used real-time, multi-party, multimedia applications for audio conferencing and shared whiteboard (Katz et al., 1999). We used a distributed communication and knowledge management system for document management and sharing (Virdhagriswaran et al., 1999). We also used a prototype for a system which provided web access (and document retrieval from a set of documents) and text summarization, in addition to translation into English (Hovy and Lin, 1999).
3.2.2. Application of the Framework
The CVIM experiment also started with a bottom-up approach. We evaluated each of the research systems to determine what services were supported and then mapped those onto capabilities. Using the top-down approach, we matched the mission requirements to the tool capabilities.
3.2.3. The Scenario
Our scenario was developed around the functionality of the tools we had available, the relative training time of each feature we wanted to test, and easily accessible data. We chose a humanitarian assistance / disaster relief situation in which a typhoon had caused considerable damage to an island and non-critical hospital patients needed to be transported inland to a facility that could accommodate them. Situation reports, maps, and news stories were made available via the tools. Random updates during the experiment session alerted the participants to changing conditions.
3.2.4. Metrics and Data Collection
Our data capture focused on requirement level metrics since we were interested in evaluating the utility of the integrated systems for standard operations. We focused on metrics relating to task completion, time spent on
subtasks, the number of words and turns used in communication, and system malfunctions. We also wanted to examine user satisfaction and usability issues of the individual tools as well as of the integrated set.
Due to proprietary code and the early development stage of the tools, it was not feasible for us to access and instrument the source code. Fortunately, some of the tools had already incorporated some type of automated data collection, and we were able to work with the developers of the systems to augment existing logging capabilities. Although the logging format and level of detail differed from system to system, each mechanism recorded events with a time stamp. Data was automatically collected from each system and imported into the Multi-Modal Logger (MML) which interleaved the various data in chronological order.
We recorded speech, whiteboard activity, email messages, web browser activity, and events relating to tool usage.
Once all the data were stored in a common format, the suite of MML tools were then used for visualization, annotation, replay, and output for subsequent analysis. Captured audio was transcribed manually and saved as annotations to the speech data.
Additional data used in our analysis came from observations made during the experiments as well as feedback provided by the participants via questionnaires.
3.2.5. Data Visualization, Annotation, and Replay One of the MML tools allowed the analyst to display each data type visually along a time line. (See Figure 2, next page.) The resulting graphical display helped us to identify patterns of tool usage and interactions between the users. Contents of individual data points could easily be viewed or the entire session could be “replayed.” For example, plug-ins played the saved audio files and recreated whiteboard activity. Additionally, this tool allowed us to annotate groups of data points across user and system. The annotations were then saved as meta-data, similar to the stored speech transcriptions.
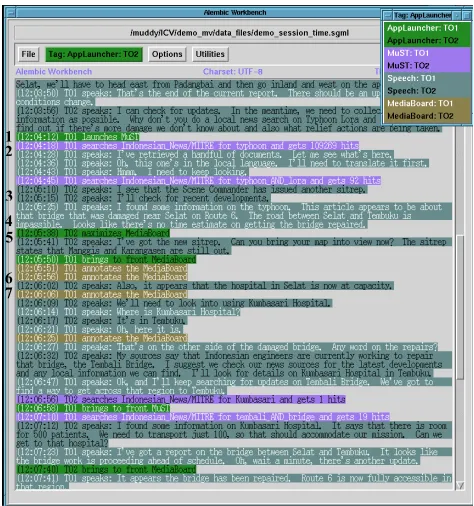
The Alembic Workbench (AWB), a natural language environment for developing tagged corpora (Day, 1999), provided an alternate means of visualizing and annotating the experiment data (Figure 3). We wrote a tailored script to generate Standard General Markup Language (SGML) from the data stored in the MML database. The data were visualized in the AWB as lines of text. The tagged data were then color-coded for ease in distinguishing user, event, and system. Subsequently, we used the AWB to generate a Hypertext Markup Language (HTML) version to facilitate sharing the annotated data over the Internet.
The two tools provided us with differing views of the same data. (Compare the data visualization in the MML, Figure 2, with that in the AWB, Figure 3.) Table 3 outlines the events indicated by the numbered data points in both views.
3.2.6. Experimental Design
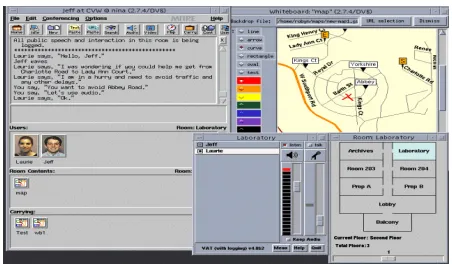
Figure 2: Data visualization in the Multi-Modal Logger Annotate-Session Tool. Data types are listed on the left while data points are displayed along a time line. The contents of a selected data point are shown in the top of
the window.
participants would have access to the same Internet information. The participants were volunteers from a technically savvy population. None had significant prior experience to using any of the tools, but most were familiar with collaborative tools.
We had originally planned to have three participants work together at different sites. Due to last minute technical problems, a relatively small set of available users, and time constraints, our scenario was adapted to two users plus minimal, scripted participation by one of the experimenters. We ran six sets of two users plus two sets for the baseline comparison. Each session was completed in less than two hours, including time allocated to self-paced, hands-on training.
3.2.7. Results and Discussion
The experiment was a success from many perspectives. We were able to evaluate the utility of the integrated systems. We also provided constructive feedback to the developers of each of the systems. Additionally, we made some important observations on the interactions of the systems that would not have been apparent from studying the systems independently.
Screen real estate was an issue with each of the multiple systems having at least one window. We often observed users engaged in window management, rearranging windows in order to view multiple displays simultaneously or shuffling through windows in search of a hidden window. Similarly, tool controls made simultaneous use of different modalities difficult. When a participant wished to discuss an annotation she was making on the shared whiteboard map, she had to locate the audio panel, push the talk button, bring the whiteboard back into focus, continue annotating the whiteboard, and then return to the audio panel to toggle the talk button once she had finished speaking. The sheer number of windows contributed to issues in user awareness. With no
Figure 3: Data visualization in Alembic Workbench. Events are displayed as lines of text. Use of foreground
and background color distinguishes users and systems.
# Event
1 User A launches search tool 2 User A performs search
3 User B announces discovery of updated report 4 User A talks about results of search
5 Both users bring map into view 6 User A draws on map while
7 User B provides information from report
Table 3: Session events illustrated in the MML and AWB.
audio cues and slow refresh rates, users were not always immediately aware of changes to shared documents and repositories, and situation updates often went undiscovered. As compensation for lack of awareness features, many participants notified each other upon completion of an activity.
Participants took between 40 minutes and one hour to complete the task using the collaborative tool set, but, for the baseline, participants finished in about 30 minutes. Interestingly enough, participants in our study responding to a questionnaire believed that it would have taken more time to complete the task using the baseline tools. However, these results were not significant. Furthermore, we were not able to draw conclusions about whether the tools actually improved collaborative work. Factors that may have influenced these results include the following: non-optimized system performance, tool down time, system workarounds to compensate for inconsistent tool behavior, inadequate training, and lack of prior experience in using similar tools. Additionally, collaborative tools might have improved task completion time if more participants had been involved in each session; there may
4 1
2
3 5
6 7
6 2
4 1
3
5
have been significantly more overhead with three or more participants working together via telephone.
While examining the transcripts of each session, we noticed a high incidence of “tool intrusion” or negative mention of a tool when it interfered with the completion of the task. Comparing tool intrusion to user satisfaction revealed a loose, but expected, correlation; users mentioned tools more often if they were less satisfied with those tools. Notably, only the research collaborative tools were mentioned negatively in the user dialogue; no mention was made of the Internet search engine or any of the baseline tools. These results could show that tool intrusion was an indicator of not managing user expectations. Would more training or increased familiarity have helped reduce the number of negative mentions? The Technology Transition Model (Briggs et al., 1998) predicted that “People develop their attitudes toward a new technology based on their exposure to it.” They identified three kinds of exposure as testimony, observation, and experience, none of which our participants had for the collaborative research tools.
Another phenomenon we noticed while examining the audio transcripts was what we have called "collaborative verification." An instance of collaborative verification occurred whenever one participant requested verbal confirmation from the other participant regarding a collaborative activity. For example, when the audio tool was used, a speaker would often ask if the other person could hear. Similarly, after drawing on the whiteboard, the annotator often questioned the other participant on what was visible. This behavior was a clear example of participants attempting to establish mutual knowledge, or common ground (Krauss and Fussell, 1990; Clark and Brennan, 1991; Brennan, 1998). Clark and Brennan (1991) stated that “Collective actions are built on common ground and accumulation” which would suggest that these instances of confirmatory dialogue were a normal part of the cooperative activity. However, examples of this behavior were not evident in the baseline study where participants were familiar with the collaborative tools. We postulate that these data were simply measures of lack of user confidence in the research tools.
We also studied strategies used by participants. We noted that some users divided the labor while others failed to communicate and often duplicated efforts. Still others would replicate some of the work as a way of verification. Some of the strategies followed were dependent on tool availability and the ease of use of the tools; the failure or intermittent availability of a tool for one of the users often dictated the division of labor. The reverse was true as well; certain strategies enforced a participant's use or lack of use of some of the tools. We were not able to find any correlation to other factors, but we believe there may be some relationship between strategy evolution and prior experience of participants in working together as well as prior experience to working with collaborative tools.
4.
Conclusions
We showed that the EWG Methodology could be used successfully at an early and late stage evaluation of research technology. We applied the framework using both bottom-up and top-down approaches together to map the given systems to an appropriate set of requirements. The framework provided the focus for suitable measures
of system and user performance. The methodology also guided scenario development from collaborative work tasks for reproducible evaluation.
The visualization, annotation and replay tools gave us ways of integrating and analyzing user, multi-system data. The combination of automated data capture, human observations, and user feedback was effective in conveying the importance of usability issues to the tool developers. The usability data also played a particularly useful role in understanding the utility of the tools and tool services for performing specific tasks. We learned that testing a set of tools in multiple modalities revealed issues that would not have been seen by testing the individual tools.
We gained insight into human and human-computer interactions with collaborative systems in numerous ways. In the Map Navigation Experiment, the audio service proved more effective at communicating information when solving a particular planning task. In the CVIM Experiment, awareness and user confidence in tools were factors contributing to behavior patterns such as grounding and tool mention. Exposure to tools and managed expectations may also be linked to user performance.
5.
Current Research
The Evaluation Working Group is currently involved in the capture of collaborative data during a multi-national naval exercise. The goals motivating this project include a better understanding of the contribution of collaborative logs to information sharing and dissemination in a naval exercise, as well as the discovery of trends and process improvement over time. A collaborative logbook, with analytic capabilities, has been installed on several sea-based battle labs. Human-human and human-computer interactions will be automatically captured across groups of users over time.
In addition to extending our research on evaluation methodologies and data collection techniques, we aim to improve collaborative tool design, use data visualization to heighten situational awareness, and provide event recreation of real world missions and navy training.
6.
References
Bayer, S., Damianos, L., Kozierok, R., and Mokwa, J., March 1999. The Multi-Modal Logger: Its Use in Evaluation of Collaborative Systems, ACM Computing Surveys, Vol. 31, No. 3e.
Bayer, S, Damianos, L., Kozierok, R., Mokwa, J., 1998. M I T R E : M u l t i - M o d a l L o g g e r , http://www.mitre.org/technology/logger.
Brennan, S. E., 1998. The Grounding Problem in Conversations With and Through Computers in S. Fussell & R. J. Kreuz (eds.), Social and cognitive psychological approaches to interpersonal communication. Mahweh, NJ: Lawrence Erlbaum, pp. 201-225.
Clark, H. and Brennan, S., 1991. Grounding in Communication in L.B. Resnick, J. Levine, and S.D. Behrend (eds.), Perspectives on Socially Shared Cognition, Washington, DC: American Psychology Association, pp 127-149.
Damianos, L., Drury, J., Fanderclai, T., Hirschman, L., Kurtz, J., and Oshika, B., 2000. Scenario-Based Evaluation of Loosely-Integrated Collaborative Systems. CHI 2000 Proceedings.
Damianos, L., Hirschman, L., Kozierok, R., Kurtz, J., Greenberg, A., Walls, K., Laskowski, S., and Scholtz, J., March 1999. Evaluation for Collaborative Systems, ACM Computing Surveys, Vol. 31, No. 3e.
Day, D, 1999. MITRE: Alembic Workbench, http://www.mitre.org/technology/alembic-workbench. Drury, J., Damianos, L., Fanderclai, T., Hirschman, L.,
Kurtz, J., Linton, F, 1999. Methodology for Evaluation of Collaborative Systems, v. 4.0, www.nist.gov/nist-icv. Hovy, E. and Lin, C., 1999. USC Information Sciences
Institute: MuST, http://www.isi.edu/natural-language/nlp-at-isi.html.
Katz, R., Brewer, E., McCanne, S., and Jacobson, V., 1999. UC Berkeley: MASH, h t t p : / / w w w -mash.cs.berkeley.edu:80/mash.
Kurtz, J., Damianos, L., Kozierok, R., and Hirschman, L., March 1999. The MITRE Map Navigation Experiment. ACM Computing Surveys, Vol. 31, No. 3e.
Krauss, R., and Fussell, S., 1990. Mutual Knowledge and Communicative Effectiveness in Jolene Galegher, Robert E. Kraut and Carmen Egido (eds.), Intellectual Teamwork: Social and Technological Foundations of Cooperative Work. Erlbaum, Hillsdale, NJ: 111-145. McGrath, J. E., 1984. Groups: Interaction and
Performance, Englewood Cliffs, N. J., Prentice-Hall. Pinsonneault, A. and Kraemer, K., 1993. The Impact of
Technological Support on Groups: An Assessment of the Empirical Research, in Baecker, R. (Ed.) Readings in Groupware and Computer Supported Cooperative Work, pp. 754-773.
Spellman, P. J. and Carlson, J., 1995. Technology for Virtual Organizations. Extended abstract in Proceedings GroupWare '95, Boston, MA., http://www.mitre.org/resources/centers/it/g061/cvw.htm l.
Traum, D. and Heeman, P., 1996. Utterance Units in Spoken Dialogue in Proceedings ICSLP ’96, Vol. 3, pp 1884-1887.