reporting structure for
Continuous Improvement
July 4th 2007
Building a reporting structure for
Sara Lee International
Paper final assignment
Company
Sara Lee International
Vleutensevaart 100
3532 AD Utrecht
Tel.: 030-2979111
Company Companion
Hennie Monsou
University Companion
Peter Schuur
Christiaan Katsma
Author
Roderik Met
Kanaalstraat 100bis
3531 CM Utrecht
Tel.: 06-18633423
Continuous Improvement
Preface
This paper represents the outcome of my final internship to round up my studies Industrial Engineering and Management at the University of Twente in Enschede. In the summer of 2005 I had a discussion with the study advisor to finalise my studies. We spoke about courses and two internships which had to be done. In February 2006 I started a training on the job at Uniq Salads in Losser. My assignment was to introduce a new warehouse management system. During this assignment I became interested in the UQ Excellence program, resulting in a positive working environment and shorter lead times. The UQ Excellence program was based on Lean Manufacturing.
Lean Manufacturing is applied exemplary by Toyota and is seen as the new concept for companies. Sara Lee International is applying Lean not only to its operations organisation but even beyond on non operations. Interested in the concepts of Lean and Sara Lee International as a great opportunity to finalise my studies with an internship I applied for a position.
I started in September 2006 with introductions to the organization and the principles of continuous improvement. Immediate in my first week I was involved in a workshop for process improvement. Within Sara Lee
International I have been working in the Continuous Improvement PMO team. The purpose of this team was to design and implement a reporting structure for continuous improvement. As follow up I have been in a supportive role for the CI department. The PMO team reported monthly to the board of managers. Daily work was tracking activities, numbers on people trained and improving systems and processes.
After eight months at Sara Lee International I look back on a valuable period. I have been working on the assignment with a lot of enthusiasm. This
pleasure was caused by the character of the assignment and the comfortable working environment. I would like to use the opportunity to thank all the people inside and outside Sara Lee International whom I have been working with, and the supervision teachers from university. I would like to specially thank Wim Heine for offering me this position in Sara Lee International and Hennie Monsou for his direct support as head of the continuous improvement PMO team.
Special thanks go out to my family who has always been supporting during my studies.
Roderik Met
Management Summary
Sara Lee is an international company manufacturing and selling high quality, branded consumer packaged goods. The organisation is divided in three business segments. Two of these business segments, Sara Lee Food & Beverage and Sara Lee Foodservice focus on the United Sates operations. Sara Lee International is the last business segment and focuses on the operations in world wide countries, except the US. Sara Lee has adopted the continuous improvement to be able to compete in the market and have an edge over their market competitors. This report presents a reporting structure for Sara Lee International to report on the progress of
implementing the continuous improvement methodology in the organisation. Continuous improvement starts by identifying the value stream. The focus of this report is to facilitate in good value stream mapping. Secondary there needs to be a structure for training the employees on different aspects of continuous improvement. Tools need to be trained and explained so that they can be used and applied in daily work. The third and last focus of this report is to introduce performance management in the continuous improvement structure.
To be able to identify the value stream in operations as well as in
non-operations a special hierarchy structure was identified. A structure has been developed for the new situation in which the value stream has it’s own level. The value stream map is the basis for the ideal state. To emphasise the importance of the value stream it is also a special phase in the reporting structure for Operations and Non-operations.
By designing a common process for all projects in Operations and
Non-operations a much higher level of insight is given to participants in a project. These common processes are based on the cyclical way of organizational learning. They are called plan-do-check-act cycles. These cyclical processes start with a plan to create a schedule for an improvement on a machine or process. This plan has to be executed by a team, built up of people involved in the process. They are also involved in setting op the plan. This reveals show the bottom up methodology of continuous improving. A check of the new situation is needed to see if the future state is achieved. If not,
adjustments can be made or by starting a new cycle the incremental improvement can proceed.
Many papers and books state that continuous improvement is about creating a mindset among all employees in the organisation. Top management needs to be involved to support and understand ideas from the lowest
organization. At the production line a small awareness event can be
organized about implementing a continuous improvement tool. Whereas and extensive CI facilitator program is available to train leading figures for
implementing continuous improvement in all part of the organisation. The training structure is also available on the intranet of the company. All training material is accessible to the employees.
PREFACE... 1
MANAGEMENT SUMMARY... 2
1. INTRODUCTION... 6
1.1 SARA LEE CORPORATION... 6
1.1.1 Business Groups... 6
1.1.2 Mission Statement... 8
1.1.3 Vision... 8
1.1.4 Values... 8
1.1.5 Transformation... 9
1.1.6 Continuous Improvement...10
1.1.7 Goal of Continuous Improvement...11
1.1.8 Timeline of processes...11
1.2RESEARCH METHOD...13
1.2.1 Problem definition...13
1.2.2 Goal...13
1.2.3 Problem owners...13
1.2.4 Research questions...15
1.2.5 Approach...15
1.3STRUCTURE OF THE REPORT...16
2. CURRENT SITUATION...18
2.1ROLL-OUT OF CONTINUOUS IMPROVEMENT...18
2.2REPORTING STRUCTURE...22
2.2.1 Charters...22
2.2.2 Key performance indicators...23
2.2.3 S-curves...24
2.2.4 Exceptions...25
2.2.5 Library...25
2.3REMARKS...25
3. CONTINUOUS IMPROVEMENT...28
3.1PRINCIPLES OF CONTINUOUS IMPROVEMENT...28
3.1.1 Value...29
3.1.2 Value Stream...29
3.1.3 Flow...32
3.1.4 Pull...36
3.1.5 Perfection...36
3.2ORGANIZATIONAL CHANGE...36
3.3PERFORMANCE MANAGEMENT...37
3.4CONCLUSION...38
4. FUTURE STATE...40
4.1INTRANET ENVIRONMENT...40
4.2HIERARCHY STRUCTURE...42
4.3SMARTTOOL FOR REPORTING...46
4.3.1 Managerial control...47
4.4COMMON PROCESSES...50
4.4.2 Operations...55
4.4.3 Reporting requirements...58
4.5TRAINING STRUCTURE...59
5. PROPOSED SOLUTION...62
6. CONCLUSION AND RECOMMENDATIONS...66
REFERENCES...69
GLOSSARY...70
APPENDIX A...71
APPENDIX B...72
APPENDIX C...74
APPENDIX D...76
1. Introduction
As introduction to the report I will start with a description of the company where I have been working for in the past months. I will highlight the three business groups of Sara Lee Corporation. Succeeding this general description I will give an impression of the transformation process which Sara Lee
started in 2005 to reposition the company and describe the background of continuous improvement for Sara Lee. In the second paragraph the research method will be pointed out. The last paragraph of this chapter describes the structure of the report.
1.1
Sara Lee Corporation
From its delicious Douwe Egberts coffee to its Sanex shower gel, Sara Lee is in touch with consumers through innovative products they use virtually every day. Chicago-based Sara Lee Corporation is a global manufacturer and
marketer of high quality, branded consumer packaged goods that have become household names around the world. Sara Lee’s greatest strength is its skill at developing mega brands—products people everywhere know and trust. Behind these mega brands, Sara Lee has a management team
dedicated to positioning Sara Lee for continued growth.
1.1.1 Business Groups
Sara Lee Corporation is setup out of three business segments: Sara Lee Food & Beverage
Sara Lee Foodservice Sara Lee International
Sara Lee Food & Beverage is the North American retail food division of Sara Lee Corporation. Based in Chicago and lead by C.J. Fraleigh the Food & Beverage group develops and markets baked goods, packaged meats and coffee. Leading brands and products include Sara Lee fresh breads, frozen desserts and deli meats, Hillshire Farm lunchmeats, Jimmy Dean sausage and breakfast foods, Ball Park franks and the Senseo single-serve premium coffee system.
Sara Lee Foodservice also operates from Chicago. This business group is
Using a customer-centric marketing approach that leverages comprehensive category expertise and a tradition of selling excellence, Sara Lee Foodservice is positioned for long-term, profitable growth. The business goes to market through foodservice distribution partners as well as through an extensive direct route delivery system, offering innovative Sara Lee products to full- and quick-service restaurants, retail establishments, schools, healthcare facilities, hospitality venues, warehouses and other foodservice operators.
Sara Lee International has its headquarters in Utrecht, the Netherlands. This business group comes under the responsibility of A. Nühn. Sara Lee International manages Sara Lee’s non-US Coffee and Tea businesses, the worldwide Household and Body Care operations and the non-US Bakery businesses. This is done by five business segments: Coffee and Tea, Household and Body Care, Fresh bread and baked goods, Frozen desserts and baked goods and number five is Refrigerated dough and baked goods.
Sara Lee International markets a wide range of brands across the world, many of which are leader in their market. International brands such as Douwe Egberts coffee, Pickwick tea, Natreen sweeteners, Sanex body care products and Ambi Pur air fresheners are established success-stories in many countries. In fact, the Sara Lee Kiwi brand ranks number one in shoe care worldwide and is sold in nearly 200 countries.
Sara Lee International also has an impressive offering of local brands, many of which are household names in their home countries. In Spain,
connoisseurs of good coffee cherish the Marcilla brand. It is a similar picture in France with Maison du Café, Café Pilão in Brazil and in Denmark with Merrild. Meanwhile, in the United Kingdom, Sara Lee’s Radox brand of body care products is a deeply embedded household name. In Germany, the same applies to Duschdas.
The Financial situation of Sara Lee is shown in figure 2. This figure is an abstract of the financial report over fiscal year 06.
Figure 2: Facts & Figures(financial report FY 06)
1.1.2 Mission Statement
The mission of Sara Lee is To Simply delight you… every day. As a part of
this mission Sara Lee has to gather around its customer and carefully listen what the customer requires.
1.1.3 Vision
Sara Lee’s vision is To be the first choice of consumers and customers around
the world by bringing together innovative ideas, continuous improvement and people who make things happen.
1.1.4 Values
Sara Lee has identified five corporate values
• Act with integrity
• Use imagination
• Be inclusive
• Work as a team
• Have passion to excel
The first value of Sara Lee is to act with integrity, model and inspire high levels of integrity and trust. Use imagination, challenge the way things have Results of Operations July 1st, 2006 July 2nd, 2005
Continuing operations
Net Sales
15.944
16.029
Operating Income
911
1.369
Income before income taxes
683
1.180
Income
410
1.081
Eff. Tax Rate
40 %
8.4 %
Income per share of common stock
Basic
0.54
1.37
Diluted
0.53
1.36
(
Loss)income from discontinued operations
256
362
Gain on sale of discontinued operations
401
-
Net income
555
719
Financial Position
Total assets
14.522
14.300
Total debts
5.959
4.731
Other Information
Net cashflow from operating activities
1.232
1.350
been done in the past, by seeking exposure to new ideas and new ways of looking at things. Be inclusive, proactively develop a culture where people with diverse perspectives, styles and experiences feel valued, included and enabled to contribute to business success. Work as a team, build teams that achieve great things together. Fifth value is to have passion to excel,
enthusiastically drive for the success of Sara Lee.
1.1.5 Transformation
In February 2005 Sara Lee Corporation announced a comprehensive transformation plan designed to dramatically improve performance and better position Sara Lee for long-term growth. This plan will transform the entire enterprise into a tightly focused food, beverage and household products company and enable Sara Lee to compete more successfully in today’s dynamic marketplace and thereby generate consistent, long-term top line growth and bottom-line profitability for its shareholders.
The new organization structure consists of three business segments.
1. Sara Lee Food & Beverage includes the bakery, packaged meats
and Senseo coffee businesses in North America.
2. Sara Lee Foodservice is comprised of the North American
foodservice business in the bakery, coffee and meats foodservice segments.
3. The third business segment is Sara Lee International, which
includes the bakery and beverage businesses outside of North America and the global household products business. For the business segments in North America, all employees will be located in a new headquarters in Downers Grove, Illinois. Sara Lee International will continue to have its main offices in Utrecht, The Netherlands.
The transformation plan also included the spin-off of one business and several divestitures. The Branded Apparel business in the Americas and Asia will be spun off into an independent, publicly traded company. Divestitures in the European apparel business included the European package meats
business, the direct selling business, and the U.S. Retail Coffee business, excluding the Senseo brand. These divestitures and the Branded Apparel spin-off represent approximately 40 percent of the company’s annual revenues.
1.1.6 Continuous Improvement
Sara Lee has embraced LEAN or Continuous Improvement to focus on its on processes. Eliminate waste, taking non value added tasks out of everything Sara Lee employees do and eliminating things the customer will not pay for.
Continuous Improvement is going to be applied in three areas:
1. Priority Processes
2. IT Projects / Programs
3. Daily work
Priority Processes are processes that will provide Sara Lee with a competitive advantage over its market competitors and improve the operational
excellence. These processes are collectively felt to make the biggest difference in business to help Sara Lee achieve its goals. Currently, these priority processes are Innovation, Supply & Operations, Pricing / Trade Spend, Business Planning and Customer Management Excellence.
IT projects are initiatives focused on delivering a common infrastructure and information technology capabilities needed to accelerate Sara Lee’s move toward operational excellence. Companies fail by putting IT systems in place before optimizing and creating common processes. For example order to cash and procure to pay.
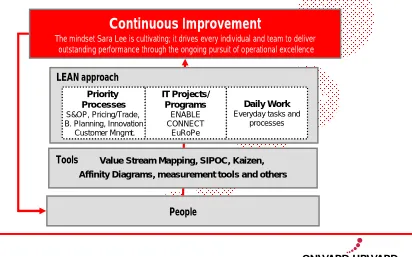
Continuous Improvement: What is it?
Sara Lee is cultivating a continuous improvement mindset by applying a LEAN approach to priority processes, information technology projects and programs, and daily work, all supported by tools and executed by people.
Continuous Improvement
The mindset Sara Lee is cultivating; it drives every individual and team to deliver outstanding performance through the ongoing pursuit of operational excellence
People
Value Stream Mapping, SIPOC, Kaizen, Affinity Diagrams, measurement tools and others Tools
LEAN approach
Daily Work
Everyday tasks and processes
IT Projects/ Programs
ENABLE CONNECT
EuRoPe
Priority Processes
S&OP, Pricing/Trade, B. Planning, Innovation
Customer Mngmt.
Figure 3: Continuous Improvement framework (source: presentation CEO)
1.1.7 Goal of Continuous Improvement
The goal of the continuous improvement (CI) approach is a short term and long term one. On the short term the goal is to increase all Sara Lee
associates’ knowledge of Lean, and develop the skills to use the principles and tools within their roles.
The long term goal of continuous improvement is to develop a culture, a tradition of excellence, founded in lean principles and tools that will drive
operational performance within Sara Lee over the next decade and beyond.
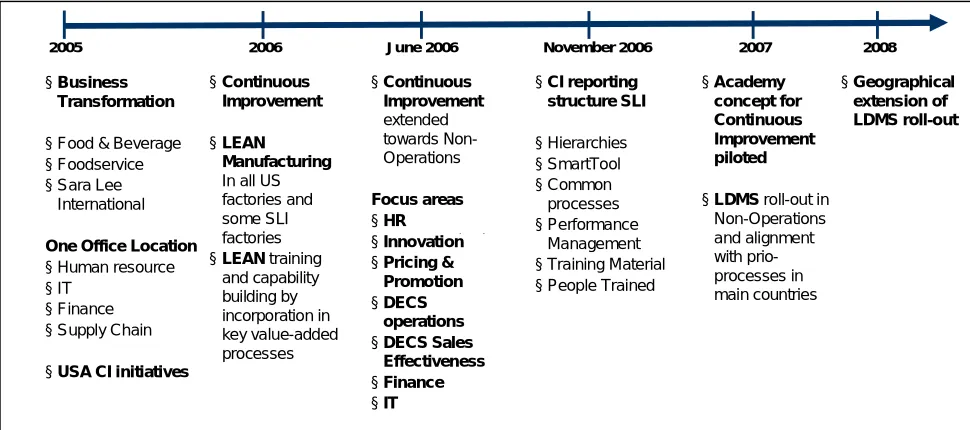
1.1.8 Timeline of processes
To put the transformation process and the continuous improvement initiatives together in one framework I have created a timeline in figure 4 below. This figure shows the start of the transformation process in 2005. During transformation the number of brands was reduced to create a smaller portfolio of leading brands. Brands like Duyvis and Lassie were sold to other market parties. Beside this reduction in the brands portfolio also several divisions, like Meat Europe and Direct Selling were sold. They were not fitting properly in the future direction of the company. Concurrently with the
were started in Food & Beverage and Foodservice, the two US business segments. This was followed by implementation of Lean manufacturing in all US factories in 2006 and the first factory within SLI, the Senseo coffee plant Grimbergen. This program developed towards other SLI factories. It was determined to start implementing continuous improvement also in Non-Operations in June 2006. A twelve week training program for continuous improvement group leaders started. They were appointed to lead the change in the company. In November 2006 a reporting structure to report on
continuous improvement implementation in Sara Lee International was built. This design of this process will be described in this report.
Figure 4: Timeline
In 2007 the concept of a continuous improvement academy is piloted for training materials. Special training kits containing theoretical papers,
materials, simulations and games are made available. The materials already available in English are translated to other main languages. In the Non-Operations environment LDMS, Lean Daily Management Systems will be installed to gradually build the foundation skills necessary for success of continuous improvement. This will first be done in the main countries. In 2008 and the years beyond roll-out this will spread to all other countries.
2006 June 2006 2007 2005
§Business Transformation
§Food & Beverage
§Foodservice
§USA CI initiatives
§Continuous
1.2 Research Method
In the Dutch language we have an expression stating that “a good start is
half the work”! Related to the report of my final internship this phrase can be translated in a good research method is a big step towards useful result. In this second paragraph I will outline a solid research method which can serve a guideline for the rest of the report.
1.2.1 Problem definition
The cultural change for adopting continuous improvement must start at the top and cascade throughout the organization. It is not a simple bottom up program but has many links with strategic goals set by top management (Kerrin, 1999). An extensive program of training is used to expand the Lean methodology in the company. To supervise this change management a special continuous improvement department has been established. Senior leadership wants to track the progress of the lean development throughout the organisation. The CI department is assisted by a project management organization to help reporting on progress and results. The project team has to track the number of people trained, update schedules of Continuous Improvement Workshops scheduled. Important is also to report key performance indicators and financial data on how much is saved by using Lean.
It is a difficult question how to setup a relevant infrastructure for reporting progress to the continuous improvement department, the Sara Lee
International board of managers and the Sara Lee Corporation board of managers. Which information is relevant on different levels.
Continuous Improvement Change Agents and -Group Leaders are using a special SmartTool to report on the financial side of their projects. They have a target for Fiscal Year 07 and Fiscal Year 08. The SmartTool also registers the actual amount achieved and displays the gap between target and Actual. If there is a gap the SmartTool will indicate if there are enough activities approved to close this gap. In the SmartTool the Continuous Improvement Change Agents and -Group Leaders have the possibility to track KPI’s. For instance these KPI’s can be number of FTE, Overall Equipment Efficiency, average visits per route, sales per visit, number of stocks or the number of calls solved by the helpdesk. These KPI’s can vary from project to project.
1.2.2 Goal
The goal of this research is to create a reporting structure that is appropriate to support Continuous Improvement within Sara Lee International.
1.2.3 Problem owners
Improvement as a key element to a future of success of the company and stands firmly behind it. The continuous improvement program is not in addition to all the work that’s going on right now but is in support of the commitments employees have made in their operating plans. The question arises how to implement the program in the existing new structure after the transformation plan.
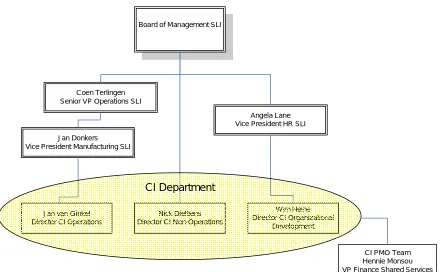
Within Sara Lee International a special Continuous Improvement department has been established to implement LEAN. The organizational chart of the functions and persons is shown in figure 5. The continuous improvement department consists of three persons who perform a leading role. The directors continuous improvement Operations and Non-operations are responsible for the implementation of the continuous improvement
methodology in the organization. The Director Continuous Improvement Non-operations reports directly to the board of management. He also has
responsibility for all annual operating plan Initiatives in Non Operations. The Director Continuous Improvement Operations has responsibility for all annual operating plan Initiatives in Operations. Operations is responsible for two branches: Manufacturing and Supply Chain. As Director he reports to the Vice President Manufacturing SLI. This function is directly linked under the Senior VP Operations which reports direct to the board of management. Third member of the continuous improvement team is the Director
continuous improvement Organizational Development. He is the expert on Human Resource. He reports to the Vice President Human Resources SLI which directly falls under supervision of the SLI board.
The team has a mixed background of Non-Operations, Manufacturing and Human Resource. They have been chosen to best implement the Continuous Improvement program in the organization.
Besides these three leading functions in the Continuous Improvement department there is a support team. This CI project management
Board of Management SLI
Coen Terlingen Senior VP Operations SLI
Jan Donkers Vice President Manufacturing SLI
Jan van Ginkel Director CI Operations
Angela Lane Vice President HR SLI
Wim Heine Director CI Organizational
Development Nick Dieltiens
Director CI Non-Operations
CI PMO Team Hennie Monsou VP Finance Shared Services
CI Department
Figure 5: Organizational chart
1.2.4 Research questions Current Situation(IST)
1) What is LEAN or Continuous Improvement?
2) How is LEAN applied within Sara Lee International?
3) Which information is reported to steer Lean Implementation?
Future Situation(SOLL)
1) How can we build a reporting structure to provide required
information?
2) Which specific modules need to be in place for reporting?
3) Can a common reporting structure be built?
1.2.5 Approach
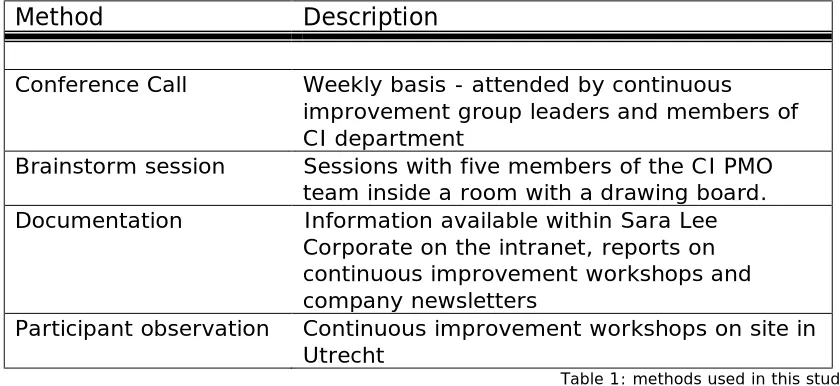
The approach to the problem was rather straightforward. I started to work with the PMO team in September. My role in the PMO team was to analyse the current state and share my findings with my colleagues. Besides this analysis I also had an important role in idea generation about the new situation. The PMO team itself was established late September. The
improvement. This useful information was combined with findings from Sara Lee Corporate where continuous improvement initiatives were already
running for some time. The methods used are shown in table 1.
Because of the immediate need for a reporting system it had to be created rather quickly. A research for months was not possible. A good fundament needed to be formed by a current state analyses. This current state analysis enabled the PMO team in creating a new working situation at once.
I have also been in a supportive role for the CI department. The PMO team reported monthly to the board of managers. Daily work was tracking
activities, numbers on people trained and improving systems and processes.
Method
Description
Conference Call Weekly basis - attended by continuous
improvement group leaders and members of CI department
Brainstorm session Sessions with five members of the CI PMO
team inside a room with a drawing board.
Documentation Information available within Sara Lee
Corporate on the intranet, reports on continuous improvement workshops and company newsletters
Participant observation Continuous improvement workshops on site in Utrecht
Table 1: methods used in this study
1.3 Structure of the report
In this first chapter I have presented the context of the assignment at Sara Lee International. The most important goal is to create a reporting structure which is up and running within several weeks. The initiatives have already started and the big issue is how to report progress to the board of
management.
In the remainder of this report I will first describe the current situation of the continuous improvement initiatives. This current state analysis results in a draft for the future state. The third chapter concerns the theory background of continuous improvement and implementation methods. Based on a
junction of the previous two chapters chapter four will provide the future state for reporting of continuous improvement. I will not only present a reporting structure; concurrently I present a reporting procedure for
structure to create a comprehensive solution for Sara Lee International and even beyond.
Appendices, referred to in this report several times have been added at the back of this report. Table 2 below functions as a bookmark for this report.
Chapter
Description
Chapter 1 Introduction to Sara Lee International and a
description of the assignment at Sara Lee International.
Chapter 2 The current situation, consisting of the current
roll out as well as the currently on hand reporting structure.
Chapter 3 Theoretical background of continuous
improvement, organizational change and performance management. This chapter ends with a framework for the remainder of the report.
Chapter 4 Proposal for future state based on a new
hierarchy structure, the SmartTool and creation of common processes.
Chapter 5 Solution based on the proposed solution, the
elements mentioned in chapter four.
Chapter 6 Conclusion of this report.
2. Current situation
Chapter two of this report is used to describe the current situation as observed at the start of the project. In the first paragraph a description of the roll is given. I will describe the existing structure used for reporting progress on continuous improvement in the two US business segments. The analysis of the current state results in a draft picture for the new reporting structure.
2.1 Roll-out of continuous improvement
Sara Lee has started to work with continuous improvement in the US business segments. Sara Lee Food & Beverage and Sara Lee Foodservice were the first segments to embrace continuous improvement thinking. They were assisted by an external agency to set-up training material and provide knowledge about Lean. To implement continuous improvement several initiatives were launched. The initiatives have their focus mainly on
operations. Within Sara Lee International the focus is also on non operations. This is even in the eyes of gurus a relatively new playground for continuous improvement.
The implementation process of continuous improvement and adopting the theory to create a mindset within the organization is set to a limit of time. This program is not running endlessly, however the continuous improvement methodology will become the ideological fundament for Sara Lee. It is an ongoing cyclical learning process which will be running for years. The thought behind the limited timeframe for support and reporting on implementation is that you cannot forever report on how the implementation is going. At a specific moment in time the organization will reach a point in which it can be stated that Sara Lee International is continuously improving.
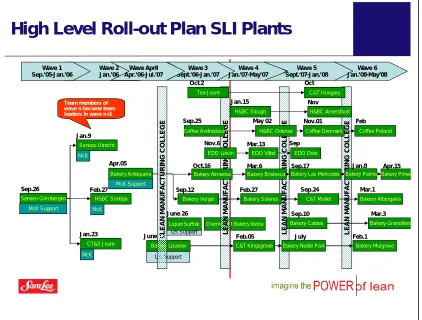
In the operations section of continuous improvement all factories are
grouped in 6 waves. The starting point was September 2005 and finish date
is June 30th 2008. The roll-out plan for the Sara Lee International plants is
shown in figure 6. A wave method of implementation in factories was chosen especially not to disrupt all factories and processes at the same time. By doing the implementation in waves only a small set of factories would start an implementation path at a time. Dividing the factories in waves provides more control to the CI department. As can be concluded from the wave pattern in figure 6 all factories will be applying continuous improvement at the end of fiscal year 08. Four times during this roll-out a lean manufacturing college will be organized. During such a meeting of two up to five days the CI facilitators will meet together with leading management. The running
Figure 6: Roll-out plan plants (source: CI strategy report)
Roll-out started in September 2005 in Senseo coffee plant Grimbergen. This factory was used as a kind of playground to test certain practices and
reactions of employees. The implementation was done by Sara Lee
employees supported by experts from McKinsey. Currently the Grimbergen factory has all people trained. They use several CI techniques like 5s and kaizens to improve their performance day by day.
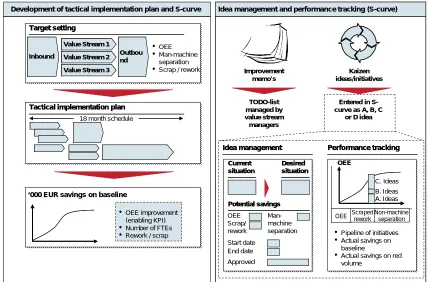
Figure 7 is in short a picture of the approach used in the Grimbergen coffee plant. Target setting is done by value stream analysis. This can result in higher overall equipment efficiency or the reduction of scrap and rework. The tactical implementation plan represents the implementation plan for the lean program. A sample of this kind of planning, at a high machine level is shown in appendix A. There are three value streams identified, Senseo, Anvar / Whole bean and DeVac. Within each value stream the machines or production lines are represented by arrows. For instance in the value stream Senseo, a production line is Opem 22, or Cloud 53. A more detailed plan per line is created in a tactical implementation plan on a one step lower level. This more detailed planning shows the objective and the impact on OEE, FTE or scrap. The planning describes the duration and what kind of continuous improvement tool is needed. A detailed version of this planning is also shown in appendix A, the second picture.
Overweight Bakery Iberia
High Level Roll-out Plan SLI Plants
Wave 2
C&T Kingsgrove Bakery Mulgrave
June 12 Feb.05 July Feb.1
H&BC Amersfoort Tea Joure
H&BC Slough
H&BC Santiga Bakery Solares
Liquid Suffolk
Team members of wave n become team leaders in wave n+1
The approach in figure 7 also shows how idea management is done. Memo’s can be used by employees to post their ideas. Kaizen events result in
improvements and new ideas. These ideas can be classified and can be used for performance tracking. I will further discuss this when I describe the SmartTool in paragraph 4.3.
Figure 7: Approach (source: Grimbergen report out)
As a result of this approach Senseo coffee plant Grimbergen managed to reduce the percentage of scrap and rework from 5,8 percent to 2,9 percent. This is a reduction of 50 percent. Strive is to become a zero defect plant, with no scrap and rework. Another result was a reduction in the number of FTE by 65. At an average yearly personnel cost of € 42.227 (based on figures of FY06) this results is a yearly savings equal to 2,74 million Euros.
The finish date for continuous improvement is June 30th 2008. This is also the
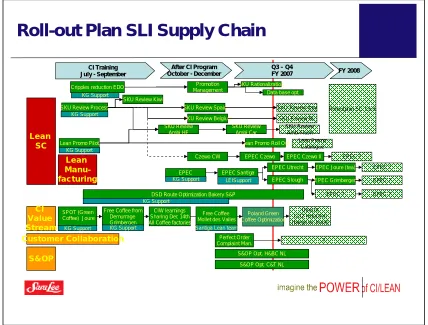
deadline for supply chain and non-operations. They will have to be Lean, or continuously improving by the end of fiscal year 08 as well. These two business segments started at the beginning of fiscal year 07. Sara Lee employees in supply chain and non-operations were trained by continuous improvement experts from Kaufman group. The roll out plan for Sara Lee International supply chain is shown in figure 8. This figure shows four focus areas
• Lean SC
• CI Value Stream
Development of tactical implementation plan and S-curve
Inbound Inbound
Value Stream 1
Value Stream 2
Value Stream 3 Value Stream 1 Value Stream 1
Value Stream 2
‘000 EUR savings on baseline
• OEE improvement (enabling KPI)
• Number of FTEs
• Rework / scrap
Idea management and performance tracking (S-curve)
Improvement
Idea management Performance trackingPerformance tracking
Current
OEE Scraped reworkNon-machine separation
• Pipeline of initiatives
• Actual savings on baseline
• Customer Collaboration
• S&OP (supply & operations).
In Lean SC the focus is mainly on the review of stock keeping units (SKU’s). Reduce the number of SKU’s and improve the cashflow of the remaining set of products. This is done per country, per brand or per product range in a brand. It is also combined with lean manufacturing. KG support stands for support from Kaufman Global, a training and consultancy company. LEI support means support from the Lean Institute. CI Value Stream focuses on the supply of coffee beans from the warehouses to the factories. In Customer collaboration the aim is to have a perfect order system, orders that are touch less, complete, on time, invoiced correctly and damage free.
Figure 8: Roll-out plan SC (source: CI strategy report)
To set up a continuous improvement culture a cultural change must start. Employees will need to analyse their own working procedures day by day and improve by making small steps every day. Creating a mindset for continuous improvement is not done overnight. This process takes weeks, months or even years to change the habit of an organization. Sara Lee has assigned corporate talents to become a driver of the new Sara Lee. They are named
Roll-out Plan SLI Supply Chain
S&OP
CI Training July - September
After CI Program
October - December FY 2008 Q3 – Q4
SKU Review Spain SKU Review Italy
Lean Promo Roll Out
EPEC Czewo
S&OP Opt. H&BC NL
S&OP Opt. C&T NL
EPEC Grimbergen EPEC Joure (tea)
EPEC ? EPEC ? Rolloutplan SC t.b.d.
Continuous Improvement Change Agents (CICA) and Continuous
Improvement Group Leader (CIGL). In this report I will refer to them as CI Facilitators. I have proposed this name to the CI department to overcome confusion. Their tasks and duties are almost the same however a CICA has already realised a bigger amount of projects. The CI Facilitators receive an intensive training program of 16 weeks to learn the theory behind continuous improvement and to practice tools to make Sara Lee continuously improving.
2.2 Reporting Structure
For reporting progress on continuous improvement Sara Lee Corporate
currently uses the intranet. This intranet environment is called InSite. It is an environment which can be accessed from every office within Sara Lee. On InSite a special page is designed for continuous improvement. SL CI InSite is a page where all initiatives can be tracked.
The current page contains several tabs:
• charters
• key performance indicators
• S-curves
• exceptions
• library function
These aspects will be explained in the next part of this paragraph. The Sara Lee continuous improvement InSite environment is used for Food & Beverage and Foodservice continuous improvement Initiatives. This domain contains all northern American businesses.
2.2.1 Charters
The charters provide information about the intention of the initiative. This information is available for everyone in the organisation. The usage of this information is mainly managerial. It contains the name of the initiative and it is stated if it is a priority process yes or no. Priority processes as mentioned in paragraph 1.1.6 will provide the company with a competitive advantage over its competitors. All initiatives are lead by one ore more CICA’s or CIGL’s. The CICA’s are mainly active in operations, CIGL have a focus more on non operations and supply chain. The charters also contain information on the objective, the scope and the key interdependencies of the initiatives. This information is all relatively static. It is provided at the beginning of a project and not a lot of this information is changed afterwards.
There are however some parts of the charter that do change every month. The CI Facilitator is obliged to update
• the status
• project phase
• stoplight
The status of the initiative can either be active, completed, deferred or cancelled. With the monthly status update of the CI Facilitator also has a project phase which needs to be specified. The project can be in one out of five phases:
1. (aop) initiative planning
2. planning (pre-work and scoping)
3. execution
4. implementation
5. sustainment
The third field to update is the stoplight. The stoplight colour is either green, orange or red. The colours, as obvious as they can be are explained in figure 9, shown below. The last field is the percentage complete field which is to be filled in a range from 0 % up to 100 %.
These four fields are also marked as sort fields on the SL CI InSite page, as this also applies for CI Facilitator and title. For managerial control this makes it a page easy to overview and to track & control progress and status of initiatives.
Figure 9: Stoplight Criteria (source: SLC InSite)
2.2.2 Key performance indicators
The tab Key performance indicators (KPI’s) does provide the KPI’s selected per initiative. This is only static information which will not change. Sara Lee has a lot of different KPI’s. Per functional area there is a document on the intranet available providing the KPI’s to track. Within a continuous
numerator and a denominator. This definition is supported by a description of how the KPI should be calculated. In appendix B the calculation of inventory turnover (ITO) is shown as an example of how the document is setup.
The CI Facilitator may use this KPI list as a pick list, instead of creating own key performance indicators. Having a centralised set of KPI’s is preventing the creation of all different kind of KPI’s on local levels. The KPI’s are defined by the corporate control and reviewed every year. This financial department has two responsibilities. One is to control the calculations behind a KPI, improve KPI’s if necessary. When correct they will enter them into the system. There second task is to prevent proliferation of KPI’s.
2.2.3 S-curves
The SL CI InSite page also displays S-curves. The S-curves refer to visual displays of savings. An S-curve is a project management tool and consists of a display of cumulative savings plotted against time. An example of an S-curve is shown in figure 10. The X-axis represents the time line, which is divided in periods. Each fiscal year has 12 periods. The Fiscal year of Sara
Lee starts at July 1st and ends on June 30th. The Y-axis represents the Euro
savings.
Figure 10: S-curve example
In a normal S-curve, as shown in figure 10, three lines are visible. The first line is the representation of the AOP, the Annual Operating Plan. This
operating plan in constructed ultimately in the third quarter of the previous
EUR
savings
Target
AOP
(baseline)
Forecast
Actual
1
2
3
P1
P3
P5
P7
P9
P11
fiscal year. The AOP line is a fixed line in the s-curve. It is not adjusted over the year. The second line is the forecast of the project. It represents the forecast made by the CI Facilitator at the beginning of the project. The third and last line drawn in the S-curve is the actual level. This actual number is updated per month.
By using this kind of visual control the CI Facilitator can see if the initiative is above or below the forecasted savings. The S-Curves are generated from figures reported via the SmartTool. The SmartTool is an MS Excel based file for reporting financial figures and project management by CI Facilitator. The name of the tool stands for Specific, describe a single observable
performance outcome; Measurable, ideally you can measure the result;
Achievable, choose a goal that is within reach; Relevant, do not waste energy and Time bound, define completion dates.
2.2.4 Exceptions
The Exceptions tab on the SL CI InSite page is designed for management by exceptions. Managers or CI Facilitators could create selections of certain initiatives. For instance they could get a display of all initiatives with a red stoplight. Or a view could be created of projects that have reached the sustainment phase.
2.2.5 Library
The last tab on the SL CI InSite page is the Library. This tab contains documents of several kinds. It contains training material for the CI
Facilitators. The planning over workshops is on this part of the site. Every month a continuous improvement newsletter is published and this is also located in the library.
2.3 Remarks
Figure 11: Current situation
For a couple of reasons Sara Lee International can not use this intranet environment for continuous improvement. First, Sara Lee International is a totally different kind of organization. It is operating in multiple countries and as a result of that has a different organizational structure. Secondly the continuous improvement initiative started in the US. Sara Lee International followed just a few years later after the first positive results. Continuous Improvement thinking is much more wide spread in the US than it is in Europe. It is harder to find specialists on continuous improvement in Europe than it is in the US.
Figure 12 shows the draft picture for a new InSite environment. This draft is a result of numerous discussions in with the CI facilitators in conference calls. I combined their ideas with ideas from brainstorming sessions in the CI PMO team.
The Sara Lee Corporate CI Site should be functioning as upper layer of all continuous improvement initiatives. The running initiatives in the Sara Lee Foodservice and Sara Lee Food & Beverage are directly linked to this intranet environment. I wondered if the Sara Lee International initiatives should also be linked directly to this page?
Observing the variety of countries and the different organizational structure I came to the conclusion that it would not be a proper idea to create a direct link for a couple of reasons.
First reason is that Sara Lee International is a different organization with its own board of management. The BoM is a management layer which does not exist in the US Food & Beverage and Foodservice segment.
A second reason is based on the loss of operational control for the CI
department over all initiatives. Initiatives within SLI are just starting up and projects in the SLC segments are already running since 2005. I refer also to the timeline in figure 4. A third driver for the decisions not to create a direct link is the size and importance of some information. The information and
•Scope
•Objective
•Background
•Status
•Project Phase
•Stopligth
•% complete
SLC on Continuous Improvement Initiatives
Charters KPI’s S-curves Exceptions Library
•KPI List •SmartTool
1) AOP
2) Forecast
3) Actual
•Management by Exceptions
•Training material
•Planning
•CI News
•Documentation
output from a local initiative in a small business area does not need to be populated to the highest level in Sara Lee Corporate.
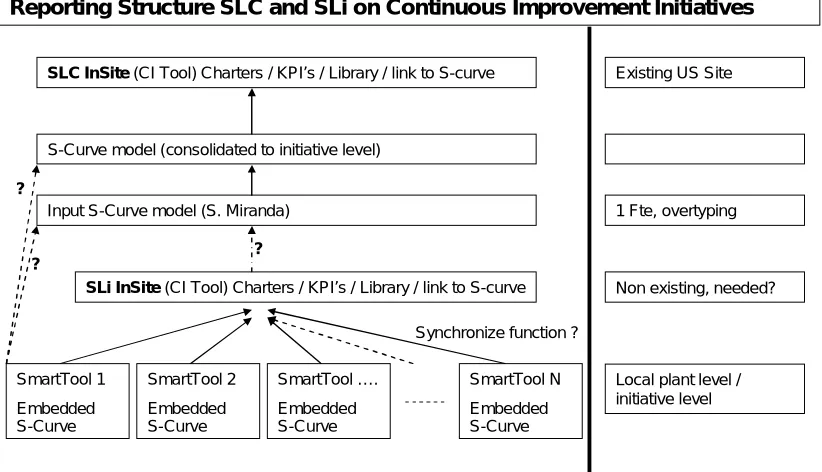
Therefore it was concluded continuous improvement enrolment in Sara Lee International needed a new, own environment on the intranet. This could be a copy of the SLC CI page and linked to the upper layer. The existing SLC CI page would be functioning as the top layer. The challenge is to create a link between the two parts to consolidate the figures from SLI level to the SLC level.
To continue reporting throughout the development process the InSite business team proposed a solution. This solution was based on temporarily reporting figures on a single sheet of paper. These figures would then periodically be gathered by a management assistant. This person (one or more FTE) would then manually input the figures to SLC CI S-curves. This is a rather time consuming activity but could very well function as a first
dressing. Although not a bad idea it would mean that a special sheet had to be designed and procedures needed to be defined to implement this in the organization. I proposed instead of continuing to reporting on CI to stop during the design and setup phase of the new SLI environment. The PMO team could then fully concentrate on its assignment.
In the new situation the SmartTools used on local plant and project level could be linked to the new SLI CI page. As a result the data is gathered on Sara Lee International level and the overall totals can than be populated to the overall SLC CI page functioning as upper layer.
Figure 12: Draft future situation
SLC InSite(CI Tool) Charters / KPI’s / Library / link to S-curve
S-Curve model (consolidated to initiative level)
Input S-Curve model (S. Miranda)
SLi InSite(CI Tool) Charters / KPI’s / Library / link to S-curve
SmartTool 1
Embedded S-Curve
SmartTool 2
Embedded S-Curve
SmartTool N
Embedded S-Curve SmartTool ….
Embedded S-Curve ?
?
?
Existing US Site
1 Fte, overtyping
Non existing, needed?
Local plant level / initiative level Synchronize function ?
Reporting Structure SLC and SLi on Continuous Improvement Initiatives
3. Continuous Improvement
A good understanding of the challenge comes with a good explanation on theory. In this chapter I will explain what the meaning of continuous improvement is. I will highlight the five key elements. In the second part I will highlight the process of organizational change required for implementing continuous improvement. During organizational changes management wants to keep up service levels. To do so performance management is needed. The third paragraph discusses performance management within continuous improvement.
3.1 Principles of Continuous Improvement
Continuous Improvement is about getting the right things, to the right place, at the right time, in the right quantity while minimizing waste and being flexible and open to change. Lean thinking is what it is also called, it provides a way to do more and more with less and less. Less human effort, less
equipment, less time and less space while coming closer to providing customers exactly what they want (Womack, 2003).
Continuous improvement was pioneered in manufacturing companies in Japan and is the antidote towards muda which means waste. The
methodology is often named as the cornerstone of the Japanese economy; however continuous improvement is not necessarily seen as a Japanese invention (Kerrin, 1999). The Japanese have become very successful,
especially Toyota, with continuous improvement after World War II. A perfect example for them was American based Ford Motor Company. By using the potential of continuous flow the amount of effort required to build a Model T Ford dropped by 90 percent (Womack, 2003). Flow is only one of the
principles of continuous improvement. Toyota concluded that continuous flow was essential combined with small-lot production systems. Preventing
millions of Model Ts each of them exactly the same like Ford Motor Company had done in the early twenties.
Toyota executive Taiichi Ohno was one of the founders of continuous
improvement. He identified the following seven types of muda which absorb resources but do not create value:
1. mistakes which require rectification (defects)
2. production of items customers do not want (overproduction)
3. inventories and remaindered goods pile up (inventories)
4. processing steps which are not actually needed (processing)
5. movement of goods and persons from A to B without a
purpose (movement)
7. groups of people in a downstream position waiting because an upstream activity is not on time schedule (waiting)
Womack and Jones added a final one: goods and services which do not meet the needs of the customer (Womack, 2003).
Continuous Improvement is a philosophy build around five key principles: Value
Value Stream Flow
Pull
Perfection
These key principles will be discussed in the next paragraphs.
3.1.1 Value
The starting point for continuous improvement is value. A company that wants to banish waste from its processes needs to identify value. What is value, from the customer’s point of view value is why producers exist. As a company you need to specify what creates value from the customer’s
perspective. Continuous improvement must start with a conscious attempt to precisely define value in terms of specific products with specific capabilities offered at specific prices through a dialogue with specific customers. Rethink your product or service and ignore existing technologies and assumptions (Jones, 2006).
3.1.2 Value Stream
The term value stream represents all activities or specific actions (both value added and non-value added) currently needed to bring a specific product through the main flows essential to every product: first activity is the
production flow from raw material into the arms of the customer. The second one is the design flow from concept to launch (Rother, 2003).
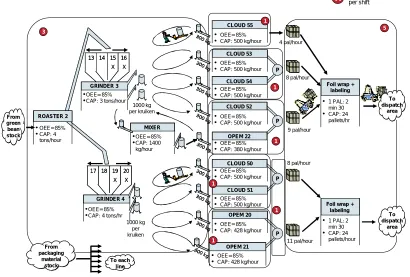
Figure 13: Senseo Value Stream (source: Grimbergen status report)
However, like a coin which has two sides there is also another stream. This other stream is called the information value stream. The information stream tells each process what to do or make and what is up next. In mapping the value stream both streams must be mapped. Figure 13 above shows the material flow through the Senseo value stream. In the figure below I show an example of the counter wise information value stream.
Figure 14: Senseo Value Stream (source: Grimbergen status report) From green
• CAP: 428 kg/hour
From
• CAP: 500 kg/hour
CLOUD 53
• OEE= 85%
• CAP: 500 kg/hour
CLOUD 54
• OEE= 85%
• CAP: 500 kg/hour
CLOUD 52
• OEE= 85%
• CAP: 500 kg/hour
OPEM 22
• OEE= 85%
• CAP: 380 kg/hour
CLOUD 50
• OEE= 85%
• CAP: 500 kg/hour
CLOUD 51
• OEE= 85%
• CAP: 500 kg/hour
OPEM 20
• OEE= 85%
• CAP: 428 kg/hour
300 kg
•CAP: 3 tons/hour
In mapping the value stream you identify and describe each action required to design, order and make a specific product or service. Next step and challenging is to sort these actions in three categories:
• First category contains steps which actually create value as
perceived by the customer. Notice the direct importance to identify value from the customer’s perspective.
• Second are the actions which do not create value but are
currently required by R&D, order filling, or production systems and can not be eliminated just yet.
• Third and last category is those actions which do not create
value as perceived by the customer. This last category should be eliminated immediately. Removing these actions would enable the company to work on the remaining non-value-creating actions (second category) through the use of flow, pull and perfection techniques.
Flow, pull and perfection will be described in the following paragraphs. Value stream mapping helps a company to see more than waste, it also reveals sources of waste in the value stream. A value stream map forms the basis of an implementation plan, it is the current state. It helps a company to design how the door-to-door flow should operate and becomes a blueprint for continuous improvement (figure 15). From this current state the ideal state can be designed. This state will be reached by small incremental
improvements.
Figure 15: Current to Target State (source: CI strategy report)
Current state
Sept ’06 ** 01/07/08
Scope lean
Improvement potential on a 3-5 year horizon
Improvement potential on a 3-5 year horizon
24/03/06 Potential identified excluding hard constraints but including
soft constraints Time frame of 3-5 years
Target State Potential ** After pilot experience: Taking into account all types
of constraints and considering time frame of
18- 24 months
Starting from Greenfield design, no
constraints
Sept ’06 ** 01/07/08
Scope lean
Improvement potential on a 3-5 year horizon
Improvement potential on a 3-5 year horizon
24/03/06 Potential identified excluding hard constraints but including
soft constraints Time frame of 3-5 years
Target State Potential ** After pilot experience: Taking into account all types
of constraints and considering time frame of
18- 24 months
Starting from Greenfield design, no
3.1.3 Flow
Once value is defined and the value stream(s) have been mapped a company must start to make value flow. We live in a world of batch and queue,
already loathed by Taiichi Ohno (Womack, 2003). For instance, if you go to a doctor you will have to make an appointment a few days ahead. After a few days waiting you visit the doctor at the appointed time but you will have to wait again in a waiting room. The doctor makes a judgment about what your problem could be and you are routed to the appropriate specialist. Once again you will have to make an appointment, and sit in the waiting room. You will be examined and from this diagnose further treatment will be routed. Perhaps you will have to come back or you will need hospital
treatment. Probably you will enter another process of queuing and waiting. Glenday talks of a vicious circle which is driven by batch logic (Glenday, 2005). This vicious circle is shown in figure 16.
Figure 16: Vicious circle
Batch logic adversely affects people’s motivation. It makes it hard to develop standard work, which is the basis of sustainable continuous improvement. Standard work is the most efficient way, to do the job that maximizes safety, quality, cost, schedule and customer satisfaction. It is focused on the actions of a single worker to produce a single piece of output (Kaufman, 2006). In batch logic, each time a batch plan is calculated it will generate a different plan. First because demand is variable, the actual demand will be different to the forecasted demand. Second reason is that only a subset of all the stock keeping units that could be produced are included in each batch plan. Batching causes ongoing customer service to suffer. It sub-optimizes
time (Glenday, 2005). Despite every effort of their employees to resolve the symptoms and improve performance at all levels, their problems remain.
Perfect flow means producing and supplying at exactly the same rate as market demand. This is also referred to as levelled production (Womack, 2003) and is the foundation for the Toyota Production System(TPS). To achieve perfect flow in a company changes are needed in the production schedule based on large batches.
The starting point is batch logic, in which the biggest batch is produced in the longest run possible to minimize the number of changeovers and maximize the efficiency. A representation of such a schedule is production schedule A in the upper left corner of figure 17. This production system needs to change towards one piece flow, or batches of one. First by bi-monthly production, batches are broken in two and produced twice a month (figure 17, schedule B). Next step is to halve these batches again to create a weekly production run of each product. These weekly batches can be broken into batches produced every day. Finally these daily batches can be separated into batches of one. The resulting schedule E represents this situation.
Figure 17: One Piece Flow
By using Every Product Every Cycle (EPEC) a company can change its production plan from batch production to daily production.
The methodology of every product every cycle is a support structure to gradually implement one piece flow. If you just compare one piece flow to batch logic very often the batch logic system will end up as being the
One Month
Batch Production Bi-Monthly Production
Weekly Production Daily Production
One Piece Flow
A B
C D
cheapest. First reason is that one piece flow requires to much changeover time. Secondly the suppliers will not be able to supply smaller batches at the same price.
By using EPEC Sara Lee can slowly resolve these constrains. By using lean techniques a reduction of the changeover time can be reached. Applying lean and just in time at is suppliers will enable them to supply small batches at a competitive price. The final result is a more efficient production system. Besides this first positive result the production system will also be quicker and more flexible to react on questions from the market. This will help to create the fourth essential of continuous improvement, which is pull (paragraph 3.1.4).
EPEC can be used as a false bridge (figure 18) to support the initial start phase of mixed sequence one piece flow. If you compare EPEC to a keystone arch a structure to support the arch is built up. Only when the final stone, keystone is in place this arch is stable and the supporting structure can be removed. To come to perfect flow and mixed production sequence of one piece flow EPEC is the wooden structure to support the initial phase.
Figure 18: False bridge
However, EPEC is a push system with fixed sequence and volume. This push sytem is used to achieve the opposite: pull. The fixed sequence and fixed volume are used to get from monthly production to daily production. This phenomenon is called economies of repetition (Glenday, 2005).
Economies of repetition has three aspects.
• First is aid in creating a learning curve by getting better at tasks
performed repeatedly.
• Second aspect is that an economy of repetition comes with routines.
Employees are less stressed if their routines are not disturbed.
• Third aspect of economies of repetition is they help to create the
environment where standardization can flourish.
of Glenday into a virtuous circle (2005). Every product every cycle provides a platform for sustainable continuous improvement. The virtuous circle is
shown in figure 19.
A soft benefit is less stress because there is less fire fighting to be done. It clarifies responsibilities and reduces the need for management supervision. An environment for greater empowerment, more teamwork and better motivation can be created resulting in less required fixed costs.
Figure 19: Virtuous Circle
3.1.4 Pull
The fourth key principle of continuous improvement is called Pull. Creating flow was one step, the goal is to get a consumer driven supply network. Pull is an essential part of continuous improvement. It is about manufacturing only products that are pulled by the customer just-in-time. Flow is very hard to realize and only gets realized when products are pulled through the
system. Several steps need to be taken to create pull instead of push in the system. First step is to reduce stock levels. A company must decrease the number of reserve bins in the warehouse and increase the number of active bins. A next step is to introduce standard work and visual control. Standard work is the most efficient way to do the job that maximizes safety, quality, cost, schedule and customer satisfaction (Kaufman, 2006). Visual control reduces the need for supervisors as everyone can look on the control board, see what is falling behind and provide some assistance. Along with the introduction of visual control comes another advantage. That is the ability to properly address the causes of disruptions. These causes can be solved by a kaizen, small improvement activity and by making use of performance management. Performance management will be discussed in the third paragraph of this chapter.
Posting performance results on whiteboards helps to encourage teams to set new performance records (Swank, 2003). At first reactions and feelings from employees will be very uncomfortable. Workers will fear that results will be used to punish and assign low performers. Employees grow accustomed to these boards and understand that they will be evaluated and rewarded for objective results they can track themselves, rather than by a subjective opinion from their bosses.
3.1.5 Perfection
The first four principles of continuous improvement interact like a virtuous circle. Just like the circle described in paragraph 3.1.3. This virtuous circle brings to the surface the muda or waste to be taken out of the system. The more value flows through the system the more muda is revealed and
removed. As value is pulled harder more disruptions in flow appear and can be expelled. Product teams can get in contact with the customer to get to know more about specifications of value and enhance value, flow and pull. Strive for perfection by continually removing successive layers of waste.
3.2 Organizational change
straightforward process. It is a cyclical learning process. Starting with introducing ideas by upper management. Second step is propagating the ideas by middle management. Next is reinvigoration and improvement of the ideas. The ideological tone begins to weaken and a new drive is needed. The last step is spreading reinvigorated ideas. This process cycle seems to
progress at different speed in different companies. Factors affecting this speed are resistance embedded in market labour systems or lack of gaining sufficient support. As a result change efforts tended to be abandoned.
The cyclical process tends to have two directions:
1. intensity
2. speed
Intensity is related to the manner carrying out the implementation and the content of training programs. It is related to the effectiveness and the
visibility of innovation efforts. These vary by company. Speed is an indicator of the pace of development and is related to the degree of activity of
disseminating ideas.
Savolainen argues that competitive advantages can only be realized if continuous improvement development managers understand the cyclical nature of organizational change (1999). Top management has a significant role in promotion of the ideology of continuous improvement. The middle management is in a key position in relation between supervisors and employees. Teaching the ideology and repopularizing continuous improvement theory.
3.3 Performance management
Companies all over the world have adopted numerous programs for
performance management. Nevertheless these performance management programs would only in a risk free and static environment be functioning at their best. Sudden changes and disruptions harm their functioning. These systems provide mechanisms for relating company wide improvement policies to action at a local level. They concern product and process
improvement policies which are developed by upper management and need to be translated to local organizational levels. A research by Bond (1999) describes a process life cycle in four stages:
1. process maintenance
2. process improvement
3. process re-engineering
4. achieving stability in the process
Process maintenance can be done by using kaizen activities to identify small problems and solve them on low cost scale. Kaizens arise bottom-up and sometimes spontaneous largely outside control of upper management. Process improvement is the next step as only the fist step, process
using Deming’s virtuous circle of Plan-Do-Check-Act, also called a PDCA circle (Bond, 1999). These phases refer to setting a new target in the Plan phase. The implementation of this plan is done in the so called Do phase. The last two phases are installed to make sure the desired plan is achieved and an action is taken if needed to correct errors. No incentives are used; continuous improvement relies on doing a good job as driving force to improve current processes. Process re-engineering is described by Bond (1999) as a great leap forward. Instead of improving on a continuous basis this step focuses on the increase of competitive results by involving
customer, process and products. It proceduralises double-loop learning into a central management policy. Double-loop learning is characterized by
challenging the fundamentals of products and processes. The final phase is regaining stability after phases of change. This can be done by using a set of qualitative measures. Critical is to provide accurate documentation on new processes and products. The continuous improvement process moving from value towards perfection can start again.
3.4 Conclusion
In this chapter I presented the theoretical background of continuous improvement. Continuous improvement is the remedy for waste. Applying continuous improvement allows a company to provide almost exactly what the customer wants in the right quantity and the right time. To be able to do this a company has to focus on the five key principles of continuous
improvement.
1. Value
2. Value Stream
3. Flow
4. Pull
5. Perfection
These five elements together are the basis of continuous improvement. Although they all have to act together the second one is actually the most critical (Rother, 2003). The value stream forms the basis of an
implementation plan. The value stream map is the depiction of the current state. From this current state the ideal state can be designed.
I have also argued that it is important to understand the cyclical way of learning in organizational change. The ideas to change the organization come from top management. They have to back the ideas and understand the methodology of continuous improvement. This creates the necessity for a clear training structure. The middle management has to propagate the ideas in the organisation. Line management and employees have to understand the ideas and provide ideas for improving their situation. These ideas have to be picked up by higher management again.
incentives; it relies on doing a good job as driving force to improve current processes.
In the remainder of this report I will check if there is a good focus for these three critical points. I will check if there a good structure available to identify the value stream. Besides good values stream mapping a training program needs to be on hand. All the employees from top management down to the production employee operating the machine on the line need to be trained on continuous improvement tools. This training material needs to be available in the organization to create an open structure for learning and improving. A third aspect in the framework is the need for accurate performance
4. Future state
In this fourth chapter I describe the proposed new situation. To create this future state a clear hierarchy structure had to be created. This hierarchy is discussed in paragraph two. To report to the PMO team the SmartTool is used. It is explained in the third paragraph and the changes which were needed for managerial control. The fourth paragraph is focussing on the process of continuous improvement. To prevent employees from reinventing the wheel common processes have been created. In the last section of this chapter I will discuss the training part. The five levels of continuous
improvement training are explained and I will clarify how these figures are consolidated through the organization.
4.1 Intranet environment
The conclusion of chapter two was that a special continuo