Predicting Private Equity Performance
The development of a private equity performance-forecasting model for AEGON
Asset Management
Master’s thesis
Author: Coen Tolkamp
Student number: 0006564
Final report: May 2007
University of Twente, Enschede
Professors: Dr. D. Dupont
Dr. B. Roorda
Predicting Private Equity Performance
The development of a private equity performance-forecasting model for AEGON
Asset Management
Master’s thesis “Industrial Engineering & Management” University of Twente
Doctoraalprogrogramma Technische Bedrijfskunde Universiteit Twente
Company: AEGON Asset Management
AEGONplein 20 2591 TV The Hague The Netherlands
Company supervisor: Drs. M. Entzinger
Portfolio Manager Alternative Investments +31 (0) 70 344 8717
Professors: Dr. D. Dupont
Dr. B. Roorda
Student: C.T. Tolkamp
Herengracht 12 2511 EH The Hague The Netherlands +31 (0) 6 52657611 Student number: 0006564
Management Summary
Private equity is a growing asset class and is renowned for its opaque characteristics. Being a large investor in private equity AEGON Asset Management is interested in macroeconomic factors that drive private equity performance. Evaluation and forecasting of private equity performance in two distinct geographic areas, Europe and the United States, are of key interest to AEGON Asset Management.
This research shows that it is reasonably well possible to evaluate and forecast private equity performance albeit under a series of assumptions and without back-testing results. The used estimation model based approach is constructed flexibly to adapt to more available
information in the future. The validity of the results will increase with the availability of more quantitative and qualitative information on private equity (performance) and with
improvements to the used algorithm.
Potential macroeconomic drivers are based on a literature search and the opinion of professional portfolio managers at AEGON Asset Management and external professionals. Aggregated private equity performance data of both the US and Europe is used as the basis for an estimation model to determine a “private equity index”. Linear regression is used to relate this index with the determined macroeconomic drivers.
The results of this research quantitatively confirmed the expectations of AEGON Asset Management about private equity: private equity performance is highly cyclical and thus depends strongly on economic conditions. This research was not aimed at determine risk adjusted performance or alpha performance. High yield credit spreads and stock market developments are important drivers / forecasting indicators for private equity performance.
Management samenvatting
Private equity is een groeiende asset class en staat bekend om haar ontransparante karakteristieken. AEGON Asset Management is als grote investeerder in deze asset class geïnteresseerd in macro economische factoren die private equity performance beïnvloeden. AEGON Asset Management is vooral geïnteresseerd in het evalueren en voorspellen van private equity performance in twee verschillende geografische gebieden: Europa en de Verenigde Staten.
Dit onderzoek laat zien dat het redelijk mogelijk is om private equity performance te evalueren en te voorspellen zij het onder een aantal aannames en zonder backtest resultaten. Het gebruikte schattingsmodel is flexibel geconstrueerd en kan zich aanpassen aan betere toekomstige informatie. De validiteit van de resultaten zal toenemen als er meer kwantitatieve en kwalitatieve informatie beschikbaar komt over private equity (performance) en met de verbetering van het gebruikte algoritme.
Potentiële macro economische factoren zijn gebaseerd op literatuuronderzoek en de inzichten van professionele portfolio managers van AEGON Asset Management en enkele externe partijen. Geaggregeerde private equity rendementen van zowel de Verenigde Staten als Europa zijn gebruikt als basis voor een schattingsmodel methode om een “private equity index” te bepalen. Lineaire regressie is gebruikt om de private equity index te relateren aan macro economische factoren.
De resultaten van dit onderzoek bevestigen kwantitatief de verwachtingen van AEGON Asset Management over private equity. Private equity performance is sterk cyclisch en dus sterk afhankelijk van macro economische factoren. Dit onderzoek is niet bedoeld om risico gecompenseerde rendementen of alfa rendementen bepalen. High yield credit spread en aandelenmarkten zijn belangrijke waardestuwers / voorspellende indicatoren voor private equity performance.
Een kwadrantenmodel is ontwikkeld voor AEGON Asset Management. Dit is een
Preface
During the intense period of the last examinations of my graduation programme I solicited at AEGON Asset Management for a thesis project. This project concerned the attribution of macro economic performance drivers to private equity performance. I have a strong interest in the private equity asset class since I did an earlier internship at a corporate finance / merger & acquisition advisory organisation. I was aware of the potential pitfalls in researching private equity regarding the lack of appropriate information. Nevertheless this thesis project appeared to me a wonderful opportunity to learn more about private equity in combination with asset management so I gladly accepted the challenge.
After the initial phase of literature analysis and data collection I spent a long time determining an appropriate research method. This research lacked the data that is available to other
academic researchers; this made it difficult to execute a straightforward analysis. The challenge of this research was to find a research method that could cope with the available data and the research objectives. After three attempts I created an alternative research method to attribute macro-economic performance drivers to private equity performance under a series of assumptions.
This research could not be completed without the help of several people. Since this thesis project marks the end of my study I would like to thank my parents who supported me and never lost confidence in me actually completing this study. I would like to thank my
girlfriend, Martine, who supported me at all times, especially in the last period when I spent most of my time working and writing this thesis.
At AEGON Asset Management I would like to thank Michael Entzinger and Rutger Schreuder. Michael Entzinger, my company supervisor, helped me arranging private equity industry contacts, finding other information sources and helped me whenever possible. Michael and I held weekly sessions about the research developments, which were helpful to reflect on my progress. Other colleagues at AEGON Asset Management helped me with gathering useful information as well and provided a pleasant and interactive working environment.
I would like to thank Sam Robinson, from SVG Capital Plc, for providing the most important information for this research: private equity performance data! Without this information I could not perform this research at all.
Last but not least I would like to thank Dominique Dupont and Berend Roorda, my professors from the University of Twente, who took the time to understand my estimation model, gave me valuable feedback during several meetings and stimulated alternative research methods.
I hope that one, after reading this thesis, better understands private equity in an asset management environment and finds that alternative research methods can provide a useful perspective in the absence of extensive information.
Coen Tolkamp
The Hague, May 2007
List of figures and tables
Figure 1 Organisational chart AEGON Asset Management...9
Figure 2 General outlay quadrant model...11
Figure 3 Quadrant models with different time horizons ...12
Figure 4 Direct and indirect private equity investing...19
Figure 5 Number of buyout funds (US and Europe)...20
Figure 6 Fundraising buyout funds (US and Europe) ...20
Figure 7 J-curve private equity ...23
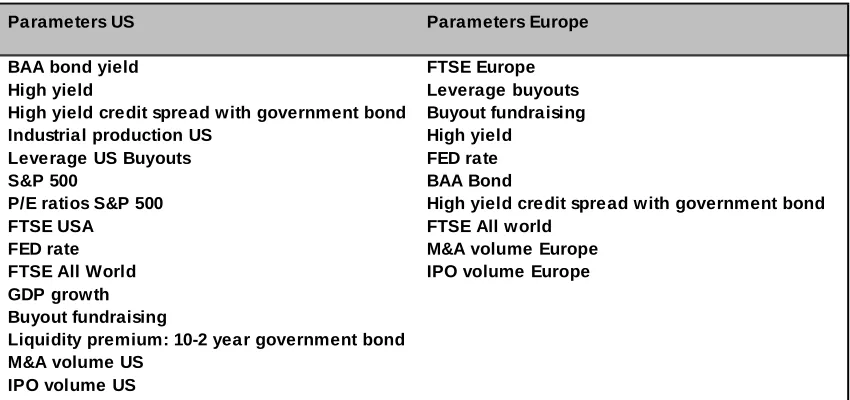
Figure 8 Macroeconomic parameters (US and Europe)...38
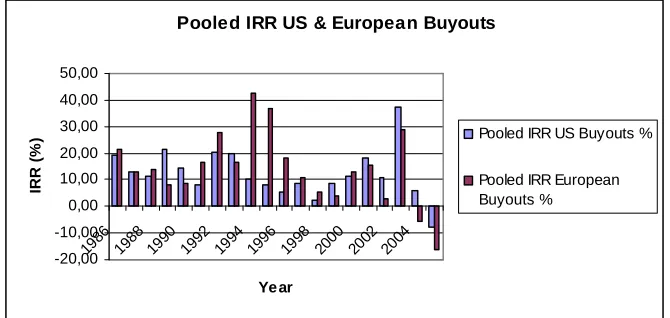
Figure 9 Pooled IRR’s (US and Europe)...41
Figure 10 Pooled TVPI (US and Europe)...41
Figure 11 Private equity index and historical private equity performance ...42
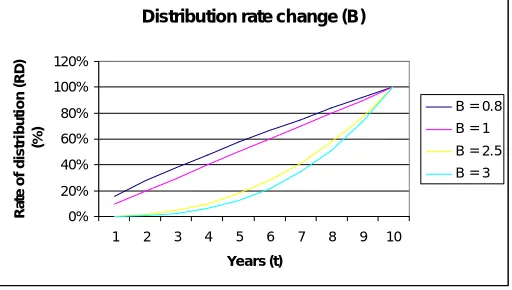
Figure 12 Different divestment paces ...44
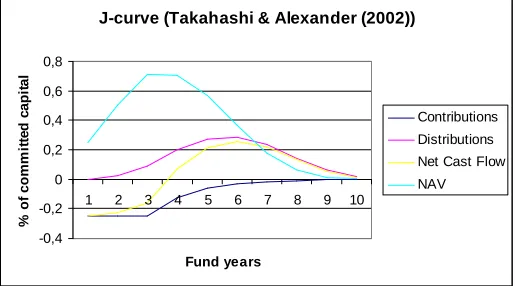
Figure 13 J-curve model by Takahashi & Alexander (2002) ...45
Figure 14 Stability of the algorithm (Europe) ...52
Figure 15 Stability of the algorithm (US)...52
Figure 16 Private equity indices estimation model Ia (US and Europe) ...53
Figure 17 Actual and fitted IRR estimation model Ia (US)...54
Figure 18 Actual and fitted TVPI estimation model Ia (US)...54
Figure 19 J-curve with different divestment paces ...55
Figure 20 Divestment paces estimation model Ib (US and Europe)...56
Figure 21 Private equity indices estimation model Ib (US and Europe)...57
Figure 22 Actual and fitted IRR estimation model Ib (US) ...57
Figure 23 Actual and fitted TVPI estimation model Ib (US) ...57
Figure 24 Results objective function with different divestment paces (US and Europe) ...58
Figure 25 Output estimation model II (US)...59
Figure 26 Output estimation model II (Europe) ...59
Figure 27 Best fitting private equity indices estimation model II (US and Europe) ...59
Figure 28 Actual and fitted IRR estimation model II (US) ...60
Figure 29 Actual and fitted TVPI estimation model II (US) ...60
Figure 30 Actual and fitted IRR estimation model II (Europe) ...60
Figure 31 Actual and fitted TVPI estimation model II (Europe)...61
Figure 32 Actual and fitted TVPI estimation model II (US) ...62
Figure 33 Residuals actual and fitted TVPI estimation model II (US) ...63
Figure 34 One-factor regression analysis Europe...65
Figure 35 One-factor regression analysis US ...66
Figure 36 S&P 500 vs. US Private equity index (relative)...66
Figure 37 S&P 500 vs. US Private equity index (absolute) ...67
Figure 38 One-factor forecasting regression analysis Europe...68
Figure 39 One-factor forecasting regression analysis US ...69
Figure 40 Multiple-factor forecasting regression analysis US ...71
Figure 41 Multiple-factor forecasting regression analysis Europe ...71
Table of contents
Management Summary...1
Management samenvatting ...2
Preface ...3
List of figures and tables ...4
Table of contents ...5
Table of contents ...5
Introduction...7
Chapter 1: AEGON ...8
1.1 AEGON Asset Management ...9
1.2 Alternative Investments ...10
1.3 Quadrant models...11
Chapter 2: Research formulation ...14
2.1 Problem identification...14
2.2 Research approach...15
Chapter 3: Private equity characteristics ...16
3.1 Introduction ...16
3.2 Definition ...16
3.2.1 Venture capital funds ...17
3.2.2 Buyout funds ...17
3.2.3 Fund Structure ...18
3.3 Historical development ...19
3.3.1 The development of private equity strategies in the past 25 years ...19
3.4 Fund lifecycle ...20
3.5.1 Private equity phases and the J-Curve ...23
3.5.2 Company valuation methods ...23
3.5.3 Remarks...24
3.6 Private equity performance measurement...25
3.7 Private equity risks & risk measurement ...26
3.7.1 Liquidity risk ...26
3.7.2 Business risk...27
3.7.3 Interest rate risk ...27
3.7.4 Manager risk...27
3.7.5 Risk measurement...27
Chapter 4: Risk / return properties of private equity...29
4.1 Capital asset pricing model ...29
4.2 Systematic risk & return ...30
4.3 Unsystematic risk & return ...31
4.4 Remarks ...31
Chapter 5: Private equity investments in an institutional portfolio ...32
5.1 Markowitz portfolio theory...32
5.2 Private equity in an institutional portfolio ...33
5.3 AEGON, private equity and portfolio management ...33
6.1 Performance drivers...34
6.1.1 Financing environment ...34
6.1.2 Business Environment...35
6.1.3 Market Environment ...36
6.2 Overview of (non-) literature related performance drivers...37
6.2.1 Current performance indicators used by AEGON...37
6.2.2 Overview ...38
6.3 Research methods in literature ...38
6.3.1 Bias reduction...39
Chapter 7: Methodology...40
7.1 Introduction ...40
7.2 Rationale ...41
7.2.1 Illiquid alternative asset fund model...43
7.2.2 Assumptions ...45
7.3 Mathematical formulation of the estimation model ...46
7.3.1 Modified Takahashi & Alexander model...46
7.3.2 Estimation model for the private equity index ...48
7.4 Algorithm for the general estimation model ...50
7.4.1 Stability of the algorithm ...50
7.5 Estimation model Ia...53
7.6 Estimation model Ib...55
7.7 Estimation model II ...58
7.8 Robustness of the estimation model output ...61
7.8.1 Reliability and validity of the private equity index ...61
7.8.2 Residual analysis ...62
7.9 Future development of estimation models...63
Chapter 8: Results ...65
8.1 (Non-forecasting) one-factor regression analysis...65
8.2 Comparison regression results with literature...67
8.3 Forecasting regression analysis ...68
8.3.1 Forecasting one-factor regression analysis ...68
8.3.2 Forecasting (multiple factor) regression analysis per quadrant...69
8.4 Out of sample back-testing ...71
Chapter 9: Quadrant model...72
9.1 Input...72
9.2 Output ...72
9.3 Quadrant model in practice ...73
Chapter 10: Conclusions...74
A.1 Algorithm in practice ...81
A.2 Divestment paces of estimation model II...85
Introduction
What drives private equity performance? And how do certain factors influence private equity performance? These questions are stated by AEGON Asset Management in the perspective of the US and European private equity markets. The ultimate objective of this research is to construct a model that evaluates and forecasts private equity performance based on macro-economic parameters.
This research report is structured as follows to provide answers to all questions of AEGON Asset Management regarding private equity.
First a general of AEGON is given in Chapter 1. This chapter presents the organisational structure of AEGON, AEGON Asset Management and the Alternative Investments team. This chapter will also give a general introduction to so-called quadrant models. This is a modelling philosophy used by AEGON Asset Management and is a blueprint for the private equity quadrant model, which is developed in this research.
Chapter 2 describes explicitly what the research background of this research is, culminating in two research objectives.
Thirdly, a thorough background on private equity as an asset class is given in Chapter 3. All private equity characteristics and risk and return properties are discussed. This chapter is especially interesting for people that are not familiar with private equity in general.
In Chapter 4 and Chapter 5 private equity risk and return characteristics are discussed in a CAPM and portfolio management perspective. These chapters analyse private equity with conventional finance theories and methodologies.
The 6th Chapter evaluates private equity literature that relates private equity performance to macro-economic drivers. This chapter discusses the research methods in literature and gives an overview of all performance indicators that will be used in this research.
Chapter 7 describes the methodology used in this research. The results of this research hold under a series of assumptions. The research results are presented in Chapter 8 and the construction of the quadrant model is given in Chapter 9.
Chapter 1: AEGON
AEGON is one of the world’s largest listed life insurance and pension companies and an important provider of investment products. AEGON is mainly active in the Netherlands, the United States and the United Kingdom. Besides these main markets, AEGON is also active in a number of other countries including Canada, China, Poland, Slovakia, Spain, Taiwan and the Czech Republic. Headquartered in The Hague, the Netherlands, AEGON employs approximately 27,000 people worldwide. Total revenues in 2005 were EUR 30.3 billion and the income after tax was EUR 2.7 billion.
AEGON serves both private individuals and corporate clients like SME’s (Small / medium enterprises), large companies and pension funds. The products AEGON offers range from collective and individual pensions, life insurance, indemnity insurance, social welfare insurance, wealth management to saving and investing.
(Source: annual report 2005 AEGON)
Originally AEGON started in 1759 in Haarlem, the Netherlands, where one of its predecessors, called “De Broederlijke Liefdesbeurs” started the first cooperative funeral insurance company in the Netherlands. After merging in a larger entity, called “De Groot-Noordhollandsche van 1845”, of life insurers, funeral funds, widow funds, social welfare insurers and endowments, this group became one commercial enterprise in 1983.
The name AEGON incorporates the characters of 5 of its most important predecessors: “Algemeene Friesche” (1844), Eerste Nederlandsche”(1882), “Groot-Noordhollandsche” (1845), “Olveh” (1879) and “Nillmij”(1859). After the last merger, between the cooperative “AGO” and the listed company “ENNIA”, the name AEGON was born. The name AEGON
would be a “Greek name with a classy charisma: reliable, correct and solid”. 1
AEGON The Netherlands consists of 5 service centres (or business units) for administrative organisation and product innovation. These service centres are: Life Insurance (life insurance, mortgages and funeral insurances), Banking (savings and investing), Asset Management (asset management), Pensions (individual and collective pensions) and Non-life insurance (social welfare insurance and indemnity insurance). The service centres provide the sales organisation with new products, services and take care of the contract administration.
AEGON The Netherlands employs approximately 5690 people. The head office is located in The Hague. Total revenues in The Netherlands were EUR 6.1 billion in 2005.
1
1.1 AEGON Asset Management
Like other large insurance companies AEGON N.V. has its own asset management services. Being a multinational company there are several business units at AEGON N.V. that execute asset management services. AEGON USA and AEGON UK have their own asset
management business units that serve these geographic areas. In the Netherlands, AEGON Asset Management in The Hague and TKPI in Groningen execute asset management services.
AEGON Asset Management in The Hague serves internal clients and external clients. Internal clients provide insurance premiums and products that need to be invested in all kinds of assets depending on insurance mandates. External clients are mostly institutional clients such as pension funds and a minority of investments are for retail clients.
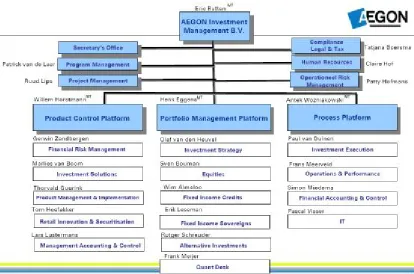
AEGON Asset Management is a business unit of AEGON Nederland with approximately 125 employees. The figure below presents the organisational chart of AEGON Asset Management with all functional and servicing departments or teams.
Figure 1 Organisational chart AEGON Asset Management
Depending on desired risk / return and liquidity preferences clients of AEGON Asset
Management can choose from a large range of different funds to invest their capital in. These funds have different mandates that impose restrictions on the investments regarding asset classes, benchmarks, accounting & tax benefits, allocation limits, etc. For large institutional accounts funds are constructed upon request and designed according to specified desired mandates. At AEGON Asset Management the Product Management & Implementation team designs these funds.
The different investment categories or asset classes at AEGON Asset Management are managed by the different departments or teams at the Portfolio Management Platform. The Equities team is responsible for European and Asian equity investments. The Fixed Income Credits team is responsible for investment grade and high yield corporate bonds (global focus). The Fixed Income Sovereigns team manages governmental bonds (global focus). The Investment Strategy activities will be described in the Quadrant models section. The Quant Desk is responsible for data analysis and decision model development for the different teams at the Portfolio Management Platform. The Alternative Investments team is mainly
responsible for fund-of-fund investments in hedge funds and private equity. This team will be described in the next section.
1.2 Alternative Investments
The Alternative Investments team consists of two separate functional groups: Derivatives,
Hedging and Fund Management and Alternative Investments.
The former is a group that performs a range of tasks that are not covered by other teams within AEGON Asset Management. These tasks comprise of foreign exchange risk hedging for (international) equity portfolios, execute liquidity management and the development of hedging solutions for fund management.
The latter is the group that coordinates private equity and hedge fund investments at AEGON Asset Management. These investments are not direct investments. The investments are indirect via a fund-of-fund concept. This means that AEGON invests in diversified portfolios of funds managed by a fund-of-fund manager. The Alternative Investments team selects the fund-of-funds manager, monitors the managers and reports to AEGON on the private equity portfolio under management. The private equity investments are Europe-based. The hedge fund investments are mainly exposed to US and European markets.
1.3 Quadrant models
At AEGON Asset Management so-called quadrant models are used for the decision making process concerning asset allocation. The quadrant models are used at different levels of asset allocation. Below a figure present the general outlay of a quadrants model.
Figure 2 General outlay quadrant model
Quadrant models are used in several forms but have the same underlying framework. First the underlying systematic will be discussed and subsequently the different forms of quadrant models.
Investment decisions are based on numerous aspects. To structure this decision process at AEGON Asset Management quadrant models have been introduced. Quadrant models consist of four quadrants or four decision categories. The four decision categories are: macro,
valuation, sentiment and technical. The macro and valuation quadrant are used for long-term indicators and the sentiment and technical quadrant contain short-term indicators. The macro quadrant usually contains macroeconomic indicators such as inflation, industrial growth and GDP growth. The valuation quadrant usually contains valuation indicators such as
price/earnings ratios or liquidity premium proxies. The sentiment quadrant contains indicators that are believed to drive market sentiments such as IPO numbers or headlines in news papers. The technical quadrant incorporates technical analysis components of an investment decision. The macro-, valuation- and technical quadrant are usually driven by quantitative information. (Sentiment factors, often hard to define quantitatively, are qualitatively defined in the
sentiment quadrant.)
The different quadrant model forms which will be described hereafter apply scores per quadrant ranging from -2 to +2 depending on the performance of the particular indicators on market or asset conditions. The total quadrant model consequently has a score ranging from -8 to +-8. With --8 being the worst score and + -8 being the best score for an asset (class) or
market. These scores are used to forecast and evaluate performance of a certain market or
asset (class) over a certain time period. Some quadrant model forms are used daily (individual asset classes), monthly to yearly (tactical asset allocation) and some for even longer periods (dynamic strategic asset allocation).
Macro
Technical Sentiment
Valuation
Score:
Score:
Score: Score:
Macro
Technical Sentiment
Valuation
Score:
Score:
Investment decisions are based on these scores and the relative scores in a certain timeframe (being a day, a month or even a year). For example, a stylised application could be: “The quadrant model of European equity markets indicated a score of +5 for the coming year (2007) compared to +4.5 of 2006, this increase is largely driven by a stronger macro quadrant. Low inflation and strong employment rates indicate a good year for the European equity market.” Maybe the Asian equity markets have a less fortunate forecast for coming year and on the highest portfolio level European equity markets are overweighed compared to Asian equity markets.
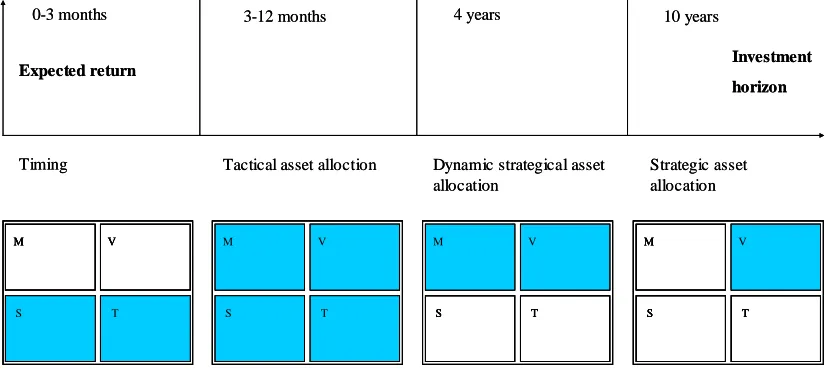
Figure 3 Quadrant models with different time horizons
The figure above represents the different quadrant model forms used at AEGON Asset Management. As one can see, the different forms are used for different time periods.
The strategic asset allocation is a very long-term decision tool and is only based on the valuation quadrant. The main question is: how much value does every asset class add to the total portfolio over the very long term? The Investment Strategy team at AEGON Asset Management tries to answer this question. Obviously this is not a very realistic question for asset management since performance over such a long period is generally hard to predict for asset managers! Therefore the dynamic strategic asset allocation forms the basis for strategic asset allocation.
The dynamic strategic asset allocation is usually based on macroeconomic reports. AEGON Asset Management publishes a quarterly and yearly macroeconomic report with long-term scenario forecasts. This outlook contains AEGON’s view on global markets and reports expected return, expected volatilities and correlations of all asset classes (equities, bonds, commodities, real estate, hedge funds, emerging market debt etc). Combined with
international reports and the Global Fixed Income Strategy report (a combined report of TKPI in Groningen, AEGON Asset Management in The Hague and AEGON Asset Management in the US) the yearly macroeconomic report is used as input for the dynamic strategic asset allocation quadrants model. This results in a medium term asset allocation (1-4 years) for the total investment portfolio of AEGON Asset Management. For this decision process only the macro and valuation quadrant, both consisting of long term indicators, are used. This decision process creates the possibility to upgrade or downgrade portfolio weights and is executed by the Investment Strategy team.
M
0-3 months 3-12 months 4 years 10 years
Investment
0-3 months 3-12 months 4 years 10 years
The tactical asset allocation also depends strongly on macroeconomic views of the various reports. This process is used to add value across assets classes (for example stocks versus bonds) and within asset classes (regional or country allocation in stocks) over a longer time period (3-12 months). Tactical asset allocation is executed by the Investment Strategy team with the use of the tactical asset allocation quadrant model. This quadrant model uses all four quadrants for its forecasts.
Timing quadrant models are used to evaluate and forecast most asset classes also called “timing” asset classes. Liquid asset classes such as stocks and (corporate) bonds are timing asset classes and are evaluated on a daily basis or longer ranging from 0-3 months. For such short forecasting periods, the short-term focus becomes more important and therefore usually the sentiment and technical quadrants are leading.
Illiquid asset classes, the focus of this research, are obviously not a timing asset class. Due to illiquidity issues purchase and selling decisions are not executed in short-term periods. Especially private equity investments are long term investments and decisions concerning this asset class are only made at the strategic asset allocation level. Forecasting and evaluating private equity performance is only reasonable over longer periods, such as a year.
The last three quadrant models in the figure are used by the Investment Strategy team. This team is responsible for strategic portfolio management. This means that this team determines the long term asset allocations of the different asset classes at AEGON Asset Management.
The first model, meant for timing asset classes are used by the different asset class teams at AEGON Asset Management. Portfolio managers run quadrant models daily, weekly or monthly depending on the preferred decision support.
Chapter 2: Research formulation
2.1 Problem identification
Like other asset management teams at AEGON Asset Management, the Alternative
Investments team wants to gain more insight in their alternative investments portfolio. Unlike other asset classes, industry information and academic research is not as widespread as with other asset classes. Hedge funds and private equity funds are both relatively young asset classes that are developing and are regularly related to controversies.
Besides the controversies both hedge funds and private equity funds are said to offer favourable risk / return properties. Other relevant aspects of hedge funds and private equity are that these funds are said to offer positive returns independent of market movements. Low correlation with general market movements is a desired property for diversifying market portfolios.
The characteristics of private equity, the risk / return properties, its dependency on market conditions and its correlation with other asset classes and macro economic variables are of interest to Alternative Investments.
As mentioned before AEGON Asset Management uses quadrant models for the evaluation and forecasting of asset class performance. Currently Alternative Investments only uses a qualitative quadrant model for private equity.
Asset management and portfolio management are always viewed in a risk / return perspective. This research only focuses on returns and forecasts of returns. The model developed in this research will not specifically generate risk forecasts. On the strategic level of portfolio management at AEGON Asset Management a certain allocation is assigned to private equity. If that allocation is determined it is very important that the allocated capital is monitored closely. Risks are minimised within the private equity allocation by diversification over managers, geographic regions and different years. For portfolio management it is important to understand what influences private equity performance in a macroeconomic perspective.
Private equity is not a so-called timing asset class, it is not possible to invest today and sell tomorrow or in three months. Nevertheless, a quantitative analysis of how the market conditions influence private equity performance can be useful for long-term decision-making processes.
With the problem identification in mind the main research goal is stated as follows:
Develop a quantitative quadrant model for private equity performance.
The goal of this research is translated into a research problem:
How can private equity performance be forecasted quantitatively?
It is not the intention of AEGON Asset Management to evaluate individual funds or specific sectors. The research is meant to forecast private equity performance in general or otherwise in a large geographical perspective, for example the United States and Europe. Therefore the quality of fund managers, the sector focus or other fund specific aspects is not included in this research.
Based on the research problem several sub-problems are identified:
• What private equity performance data is available to AEGON Asset Management?
• What is an appropriate research method to relate private equity performance data to
performance drivers given the availability of private equity performance data?
• What is the reliability of the forecasting method?
2.2 Research approach
To find an answer to the research problem and the additional sub-problems two research objectives are stated to structure this research.
Find relevant performance drivers for private equity.
This objective requires analysis of the private equity industry and relevant academic literature. Specific characteristics of the private equity industry as well as risk / return properties are analysed. In this analysis research methods in literature are discussed.
Find and use an appropriate research method to forecast private equity performance. Based on the results of the first objective a research method is to be specified. Private equity industry characteristics, data availability and research methods used in literature have a large influence on the research method used. This method should be able to reliably relate
macroeconomic factors to (future) private equity performance.
The results from both objectives are used as input for the goal of this research: the
Chapter 3: Private equity characteristics
3.1 Introduction
In the search for risk diversification or return enhancement, institutional and other investors are always looking for new opportunities. Easier access, ICT developments, globalisation, increased liquidity, an increased product offering and a growing complexity characterise the financial markets in the past two decades. All these developments are driving new investment opportunities. These new opportunities are offering risk / return characteristics that are appealing but sometimes are complex to understand. In this relatively young asset class, also known as alternative investments, private equity and hedge funds are the most prominent categories. Other alternative investments are for example commodities, real estate,
infrastructure, timber or carbon emission trading. These investments are not discussed in this research.
These investment categories are said to offer a different alpha / beta exposure compared to traditional asset classes. Beta exposure indicates how sensitive security returns are towards general market movements. Alpha exposure indicates that a part of a security returns are independent of market movements.
Institutional investors are always looking to outperform certain benchmarks. Currently, institutional investors are very interested in alpha exposure, adding value independently of market movements is an appealing idea when trying to deliver strong
positive returns. Due to the illiquidity and opacity of the alternative investment categories it is not always easy to determine whether institutional investors face alpha or beta exposure.
Hedge funds offer a wide range of trading strategies based on bonds, stocks, futures, interest rates and commodities which are able to generate returns in both up and downwards markets. This asset class is best known for its alpha exposures. Hedge funds are among the most complicated asset classes due to opacity and complexity of trading strategies. Some trading strategies are even controversial. An example of controversial hedge fund strategies are the “activist-fund” strategies. These funds use activist shareholder methods and publicly “attack” listed companies. Recent examples are Paulson and Centaurus targeting Stork N.V. or TCI targeting ABN Amro. For a more detailed discussion on hedge funds I refer to Nicholas (1999).
Private equity funds are topic of this research. Whereas hedge funds are based on shorter term trading strategies, private equity funds are focusing on long-term value creation. Just like hedge funds, private equity funds do not have undisputed reputations. The historical evolution of this alternative investment category has known some controversial activities as well. In the search for cost-reductions private equity funds could sell real estate and fire employees. The use of considerable amounts of debt to structure transactions is also a well-known argument against private equity. In the next sections the characteristics of private equity will be discussed.
3.2 Definition
The EVCA, the European Venture Capital Association uses the following definition for private equity: “Private equity is the universe of all Venture and Buyout investing, whether such investments are made through funds, fund of funds or secondary investments”.
Venture capital funds invest in companies that are in the first phases of the company life cycle. These funds invest in and support young entrepreneurial companies, which often do not generate profit or even sales yet. There is a low emphasis on active management of the
portfolio companies by the venture capital fund. These funds invest in approximately in 20-40 companies during their lifetime.
Buyout funds invest in more mature companies with steady (free) cash flows. Free cash flows can be defined as the cash flows that remain after all projects with a positive net present value are financed. Compared to venture capital funds there is more emphasis on active
management of the portfolio companies. These funds invest in 10-15 companies during their lifetime.
Other forms of private equity funds are related with mezzanine financing or distressed securities financing. These latter categories will not be discussed because of their minor importance in the private equity industry.
3.2.1 Venture capital funds
Venture Capital (VC) funds often specialise in different stages of the company life cycle. A venture capital fund can also lead a young company through the different phases depending on the performance and potentials. Usually venture capital funds hold minor equity interests.
VC funds are considered to be the riskiest investments in the private equity industry. The target companies are small and not well diversified. The value created by VC funds is based on finding the best potential revenue generating ideas and companies. By accumulating a portfolio of these companies, the probability that one or more of the portfolio companies will grow exponentially increases. The few successful companies are the value generators for VC funds.
VC funds can be distinguished by the maturity of the target companies:
• Seed stage: Investments in the seed stage are meant for research & development and prototype development. This phase is the predecessor of the early stage phase. • Early stage: In this phase marketing and product development are the important
activities that need financing. Sales and thus profit are not generated yet.
• Late stage: This phase requires financing for expansion and growth. The company is breaking even and needs financing for production capacity or working capital. Product or marketing development activities could require financing as well. • Expansion capital:The company reaches maturity and other investors purchase a
minority of shares. The majority of shares are still owned by the company founder.
3.2.2 Buyout funds
restructured or strategically repositioned. After a few years the target company will be sold by the private equity fund.
This mechanism of buying, reorganising and selling of companies obviously creates different risk and return properties than ordinary stocks have. Industry professionals often relate the skills of the private equity fund manager to alpha generating capabilities. Due to the lack of appropriate market information it is debated if private equity funds generate alpha at all.
In this research the definition of private equity is narrowed to buyout funds only.
3.2.3 Fund Structure
A private equity fund is a financial vehicle (Limited Partnership) that invests in companies during a limited time period of in general 10-12 years. After a fund raising period, the private equity fund closes and new entrants are not allowed. It is also not allowed to leave the fund once you are in. After this initial period, the private equity fund starts investing in companies.
If the general partner (GP) finds investment opportunities, he will give a capital call to each
of the limited partners (LP), the investors. At that moment the LP’s are obliged to submit a portion of their commitment. If a portfolio company is sold the revenues are distributed to the
limited partners. The vintage year of a fund marks the start of the funds investing activities.
The general partner usually earns management fees and a performance incentive, also known
as a carried interest. The carried interest is based on value growth beyond a certain level, the
hurdle rate.
The mandate of the limited partnership arranges aspects of the investment scope, commitment features and financial agreements. Typical aspects are: the geographical investment scope, the frequency and magnitude of capital calls, the specific sector focus, type of deals, type of exit strategy etc. The fund is usually structured to benefit the investor in terms of tax regulations and legal jurisdictions. To prevent an additional tax layer the fund is based on a transparent limited partnership.
There are several ways to invest in private equity. A direct investment in private equity means that you select and invest in companies yourself.
An indirect investment in private equity is established with a private equity fund. A fund manager (the GP) controls the fund you are investing in. This construction inevitably requires a management fee.
Figure 4 Direct and indirect private equity investing
Some investors prefer publicly listed private equity vehicles because of liquidity issues. A disadvantage of listed private equity vehicles is that their stocks usually trade at a discount to the Net Asset Value (NAV) of the underlying fund. These stocks are also highly correlated to stock market movements, a potentially undesired characteristic.
The secondary market for private equity investments or even entire private equity portfolios is developing but mostly offer unfavourable conditions to sellers.
3.3 Historical development
The first private equity funds date back to 1945 and 1946. The Industrial and Commercial Finance Corporation was the first official private equity fund, founded in 1945 in the United Kingdom. This fund still exists under the name Investors in Industry or 3i and is a large player with thousands of companies in its portfolio. One year later, the first United States private equity fund, Whitney, was founded.
The private equity industry has grown significantly since that first period.
Governments stimulated the availability of capital for small businesses in the post war period. In the 1970’s the legal possibilities increased by the introduction of the limited partnership construction. With this limited partnership construction and the regulatory changes for banks and pension funds in the 1980’s, the private equity industry really started to grow in size. In this period, large institutional investors took over the role of private individuals in investing in private equity. In the 1980’s the industry became generally known when large takeovers were executed by private equity funds. After a small recession in the early 1990’s, the number of private equity funds increased enormously in the late 1990’s. After the “internet-bubble” in the year 2000, the private equity industry and its venture capital category experienced a few hard years. However, the industry has showed its resilience, mostly based on global macro
economic growth.2
3.3.1 The development of private equity strategies in the past 25 years
According to Smit (2002) the strategy of private equity funds evolved in the past decades. In the 1980’s, highly leveraged buy-outs were the main method for private equity funds to earn money. A short-term profit making focus was the main driver for the industry. This resulted in a bad reputation for the private equity industry. In 1992, at the peak of this development,
2
private equity strategies started anticipating more on growth. Instead of being aggressive takeover firms, private equity cooperated with the takeover target and invested in growth with capital, management advice and business network support. A more long-term vision replaced the short-term money making vision. At the end of the nineties in the last century, strategic industrial players became fierce competitors for private equity funds. Private equity funds turned their growth strategy into a buy-and-build strategy. Private equity funds may for examply purchase several companies and ultimately merge them in one consortium with the objective to create added value.
Number of buyout funds
0 50 100 150 200 250 300
1970 1973 1975 1978 1980 1982 1984 1986 1988 1990 1992 1994 1996
# of US f unds
# of EU f unds
Figure 5 Number of buyout funds (US and Europe)
3.4 Fund lifecycle
The lifecycle of a private equity fund consists of 4 phases that are overlapping. All of the four phases are crucial to the performance of a private equity fund. In the next section all phases with their specific characteristics will be described.
3.4.1 Fundraising phase
The fund raising phase starts the cycle. Without funds a private equity fund is not able to invest. This phase normally takes between half a year and two years.
Fundraising (in USD billions)
0 20 40 60 80 100 120 140 160
1981 1983 1985 1987 1989 1991 1993 1995 1997 1999 2001 2003 2005
US Funds raised
E U Funds raised
3.4.2 Investing phase
After the fundraising phase private equity funds start investing. The investment phase can last up to 6 years. The target companies are either publicly listed or privately held. If companies are publicly listed, private equity funds preferably delist these companies.
Usually private equity funds use debt to finance their acquisitions. So for successful investing, private equity funds rely in this phase on favourable market conditions to purchase debt and to acquire a company. Short-term and intermediate-term interest rates for low-grade bonds are the most important factor in this phase.
3.4.3 Holding phase
The phase between investing and divesting is called the holding phase. In this phase the target company is restructured or strategically reoriented. Aim of a private equity fund is to create shareholder value in this phase. In this phase the private equity fund, as a large (or largest) shareholder, has a large influence on the management of the company. With this influence the private equity fund tries to maximise the value of the target company. The factors described below are only important in the holding phase of the private equity fund.
According to Van der Wurf & Mertens (2001) private equity funds create shareholder value with three different factors: stakeholder, operational and financial factors.
3.4.3.1Stakeholder factors
According to the agency theory there is a distinction between management and the
shareholders. The agent, the management, makes the operational decisions for the principal, the shareholders. The interests of the management may not comply with the shareholders’ interests. Due to these potential conflicting interests agency costs will emerge like monitoring costs and bonding costs. Bonding costs are costs that arise from legal issues between the principal and the agent.
In a leveraged buyout (LBO) the management usually gets a stake in the new company. In the new situation the management’s interests are aligned with that of the new shareholders, the private equity fund. In this situation no costs are related to the principal-agent problem.
The management of companies usually has an information advantage compared to its current shareholders. Due to this information asymmetry the management could be able to buy the company (with the help of a private equity fund) because of hidden value unrecognised by the current shareholders (Van der Wurf & Mertens (2001)).
3.4.3.2 Operational factors
After alignment of interests the management will focus more on profitability (instead of growth by acquisitions). This focus is driven by management equity stakes and interest / redemption of the debt burden used for the acquisition. Non-core activities (and sometimes real-estate) will be sold.
investments, higher turnover per employee and a more efficient use of working capital are measured indicators in reported research (Van der Wurf & Mertens (2001)).
3.4.3.3 Financial factors
Short-term cost management is used to serve the debt; this increases efficiency of a company. Ultimately this short-term cost management will be the basis for long term performance. This last statement has not been confirmed in literature yet.
High financial leverage used in the acquisition requires management to make value creating decisions and efficiency improvements. The capital structure of the company will be
improved and non-core activities will be sold. High interest and redemption costs will affect the resilience of a company. This can be compensated by the increased operational efficiency.
The free cash flow theorem states that managers try to invest as much as free cash flow as possible in new investment projects because their bonuses are related to company size. The free cash flow is defined as the remaining cash flow after all investment projects with positive net present values are financed. By financing an LBO with debt, the free cash flow will be minimised and this will prevent managers from investing and making acquisitions (Van der Wurf & Mertens (2001)).
3.4.4Divesting phase
From year 3 private equity funds start divesting up to the last year of the funds lifetime.
An exit of the companies is either done by an Initial Public Offering (IPO), a trade sale, a secondary buy out or even a write off. A paradoxical result could be a delisted company that is brought back to the stock market by a private equity fund.
An IPO is not a commonly used exit route. Only experienced private equity funds use this (expensive) exit route if the market conditions are favourable. IPO’s are usually clustered in small time intervals with strong market sentiments often related to strong stock market performance. An IPO could generate significantly more value for the private equity fund than other exit routes.
A trade sale, or an exit via a strategic buyer, is the most preferred exit route. This route usually generates the best value compared with the internally reported value.
A secondary buyout is used when an IPO or a trade sale are not available options. A
secondary buyout is the sale of a company to another private equity fund. A secondary buyout will generate less value compared to an IPO or a trade sale. A lack of trade sale and IPO opportunities and the increase in private equity investments created an increase in popularity of this exit route in the past 5 years.
3.5 Cash flows
Unlike stocks or bonds there is no continuous trading in private equity funds. Because continuous trading does not exist, prices or valuations are not available at any given moment. Usually private equity funds provide financial information on a quarterly basis. This
includes the valuation of the current portfolio, which is a subjective figure. The financial information is not broadly available in the market, which is a specific characteristic of private equity. This makes it hard to do quantitative performance research on private equity.
Jenkinson (2006) and others acknowledged this issue and this is still a big challenge in researching this asset class.
For LP’s it is difficult to measure performance of their private equity investment. Besides the fact that the portfolio of companies is valued subjectively, the timing and magnitude of capital calls and the timing and magnitude of return distributions are often unknown. These capital
calls and return distributions are usually analyzed in a cash flow framework to measure
performance. Of course market and deal conditions combined with the quality of the private
equity fund influence these uncertain distribution properties.
3.5.1 Private equity phases and the J-Curve
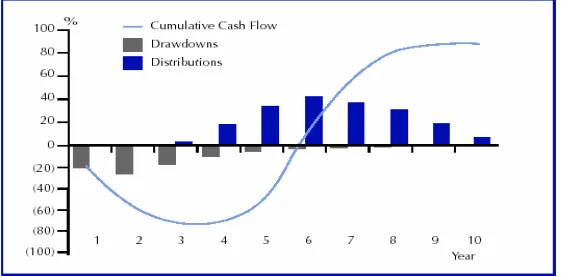
Every phase in the private equity lifecycle has a distinct effect on the cash flow pattern of a private equity fund. The investment phase obviously generates negative cash flows. When the fund starts divesting, positive cash flows are generated. When both cash flow sequences are combined a net cash flow sequence emerges. A private equity fund can also be characterised by its Net Asset Value (NAV) pattern. The net cash flow pattern of a private equity fund is often called the J-Curve. In the figure below a stylised J-curve is presented.
Figure 7 J-curve private equity
Only fully liquidated funds have a determined performance measured by the Internal Rate of Return (IRR) or a multiple. For funds that are not liquidated yet, the performance is calculated based on the investments and divestments so far and the reported estimated NAV. The
companies in the private equity fund portfolio, or the NAV, are valued by the general partner on a quarterly basis and provide an indication for future cash flows. Valuing companies is an arbitrary exercise. The GP could provide too positive or too conservative valuations to the fund’s LP’s and this distorts performance measurement for the LP’s.
3.5.2 Company valuation methods
does not need to be equal to the price offered by the market in case of an exit. Ergo, valuing companies is a subjective matter and evaluating performance based on subjective valuation requires caution.
A vast body of literature is written on valuing companies. Both professional and academic literature provides a range of valuation techniques and methodologies. The next section will classify the most commonly used methods for valuing companies. Key
determinants in using a certain valuation method are expected growth, the size and maturity of a company.
Corporate finance professionals usually use several methods parallel and generate a certain bandwidth for the value of a company. This bandwidth is based on unfavourable, intermediate and favourable future scenario forecasts.
Asset valuation and income valuation are the two main approaches for valuing
companies. (Source: http://www.ventureline.com/bizval.asp) The former method will be
treated first and subsequently the latter. The two main approaches are not inflexible; they can be combined to improve the valuation. A third approach is based on company comparisons, also known as “multiple-analysis”, which will be described as well.
3.5.2.1 Asset valuation
Asset valuation uses mainly the balance sheet as a foundation for the company valuation. Traditionally this was the only method of valuing a company. In the early days, you only used the book value of assets minus debts and that was the value of a company. Asset valuation is still based on this basic principle but new (additional) methods have been developed. The adjusted book value method, economic balance sheet method and the liquidation method are examples of the extended book value method.
3.5.2.2 Income valuation
Income valuation uses the P&L account for valuation calculations. The methods based on income valuation analyze the cash flow and profit generating abilities of a company. Methods in this category are: capitalization of earnings, discounted future income, discounted cash flow and the economic income method.
3.5.2.3 Multiple analysis
The previous two methods were implicit methods. The valuation is based on internal, company unique information. This method, the multiple analysis, is an explicit method that compares certain profit and sales multiples with comparable publicly listed companies. For this analysis, comparable companies preferably are from the same industry and have the same size and maturity.
3.5.3 Remarks
3.6 Private equity performance measurement
This research focuses on factors influencing future performance of private equity. For this reason it is of key importance to have methods to measure private equity performance. Measuring private equity performance is not straightforward and not immediately comparable with other (more liquid and publicly listed) asset classes. The next section will describe several performance measurement methods with their (dis-) advantages. Usually several methods are used to measure and present private equity performance, in this way the disadvantages of each method are diminished.
A simple but effective private equity performance measurement method is the multiple method. The multiple is the ratio of the cash inflow and the cash outflow. If this multiple is larger than one, the private equity fund has created value. Usually when investments are held for longer periods the private equity fund is able to create more value. The related
distributions are larger and thus positively influencing the multiple. The multiple can be subdivided in distributed value to paid in capital (DPI) and residual value to paid in capital (RVPI); combined it is total value to paid in capital (TVPI):
TVPI = DPI + RVPI =
But as mentioned before, the time value of money is important to calculate the real performance of a private equity fund. The disadvantage of this method is that it does not incorporate the time value of money.
A method that incorporates the time value of money is the Internal Rate of Return (IRR) method. For example Ljungqvist & Richardson (2003) use the excess IRR based on the S&P 500 index to analyze the profitability of private equity funds. This method is based on in and outgoing cash flows and on the Net Present Value (NPV) method. The IRR is the return rate that results in a NPV of zero. Obviously, the NPV method is also a way of measuring private equity performance. The disadvantages of the NPV method are equal to that of the IRR method. The first disadvantage is that the fund managers determine the NAV of an unsold portfolio. The second disadvantage of the IRR method is that the time pattern of cash flows is unknown so officially the cash flows need to be reinvested at an interest rate equal to the IRR. The second disadvantage is that the IRR rate is not straightforward comparable with stock and fixed income markets. In these markets, performance is measured accurately with recorded returns in predetermined time intervals with so called Time Weighted rates of Return (TWR). The returns in each of these periods are equally weighted unlike the IRR method that depends on the time pattern of cash flows.
In the case of IRR measurements it is important to notice that IRR numbers can be non unique. If a sequence of cash flows has more than one sign change (For example: 3, +2, +2, -1) more than one IRR number can be calculated (Brealey & Meyers (2003)) In the rest of this research it is assumed that J-curves only have one sign change and thus exhibit one unique IRR number.
IRR, which in his turn is comparable with an ordinary stock time series. The time-weighted-IRR of several funds can be combined to create a “private equity market” rate of return series.
This method still relies heavily on subjective NAV figures.3
The IRR method uses the NAV of a private equity portfolio to be calculated. The NAV is a subjective metric as mentioned before. To cope with this subjective figure one could use the Public Market Equivalent (PME) measurement method. Kaplan & Schoar (2003) use the PME and find that the average fund returns are comparable with the S&P 500 returns. This method is able to compare the IRR results with public markets. The methodology is based on timing investments and divestments in an index when a private equity fund has draw downs and distributions. This strategy replicates the irregular investment and divestment pattern. The investments and divestments in the return index can be adjusted in magnitude to ensure a better fit in NAV at the end of the investment period. An improved version of PME is PME+,
which will not be discussed here.4
Phalippou & Zollo (2005) use a profitability index (PI) to measure the return of a sample of mature private equity funds. This profitability index uses the present value of cash inflows and divides them with the present value of cash outflows. In their research the return of the S&P 500 is used as the discount factor. Outperformance of this index is measured if the PI is larger than one.
3.7 Private equity risks & risk measurement
Compared to other asset classes private equity exhibits unique risks. This section will describe the most important distinguishing risk factors. Private equity risks are described by numerous authors and in this section the risk descriptions are based on the Partners Group Research Series.
3.7.1 Liquidity risk
Private equity fund investments are subject to liquidity risk. Liquidity of public securities is measured by the bid-ask spread (among others). A larger spread indicates a lower liquidity of the security. Due to infrequent and subjective valuations of portfolio investments by private equity funds it is complex to determine a bid-ask spread. The question is: are potential buyers willing to pay the price you ask for the investment given your valuation?
Rational investors would demand a compensating liquidity premium for the liquidity risk. What is a reasonable premium for private equity investments? There are several factors influencing the bid-ask spread of private equity investments. Infrequent and subjective valuations, asymmetric information, long holding periods, transfer restrictions and other factors are of importance to answer the question.
A quantitative analysis of liquidity risk will not be given here. For private equity it is important that portfolio companies cannot be sold at any moment for your desired price. Unless you lower the price (this is the bid ask spread) and sell it, but this obviously affects private equity performance.
3
Source: Robeco research paper
4
Financial markets circumvent these liquidity issues. Listed private equity funds offer the possibility to invest in private equity stocks with high liquidity. Securitisation of private equity portfolios creates securities with private equity exposure but with more liquidity. Secondary buyouts, a portfolio company is sold to another private equity fund, are increasingly popular with private equity funds. Obviously this liquidity solution affects private equity performance due to the applied discount (bid-ask spread). Secondary buyouts are expected to become one of the most important exit routes for private equity in the future.
3.7.2 Business risk
Private equity funds invest in companies with specific characteristics like for example large, stable cash flows (for debt repayments), mature industries and with the potential to improve efficiency. Although the portfolio companies are stable companies, they still are exposed to the business cycle or economic conditions.
Funds starting in the same vintage year will face comparable economic exposures during their life time. For example if private equity funds of a certain vintage year experience low or even negative economic growth the underlying companies will not perform as good as in other periods. Diversification across several vintage years is a way to mitigate this risk and other business risks.
3.7.3 Interest rate risk
Private equity performance depends largely on the leverage used in the acquisition of companies. The debt as well as the interest has to be repaid by the company. The large and stable cash flows of the company should be sufficient to repay both within a certain period, usually 5-6 years, until the exit of the company is planned.
Depending on the type of debt used, changing interest rates could threaten the available free cash flow of a company. If interest rates increase substantially a portfolio company may fail to meet its financial obligations. This research will not discuss all possible (exotic) kinds of debt financing used in the private equity industry.
3.7.4 Manager risk
For institutional investors it is important that their private equity portfolio generates good results. Selecting the right private equity fund managers is of high importance. Managers differ in experience, network, strategy, sector-focus, regional focus, deal-size, reputation, integrity, historical track record, consistency of returns etc. A thorough due diligence phase prior to investing in private equity funds based on the before mentioned aspects is necessary. Manager risk can be mitigated by investing in several managers based on thorough due diligence.
3.7.5 Risk measurement
Due to high leverage and liquidity risk in private equity, it is said that private equity
Chapter 4: Risk / return properties of private equity
Since private equity funds differ substantially from other asset classes a structural analysis of the risk and return properties is desired. The risk and return properties of private equity are not easy to deduce from available performance information in the industry. Several authors use different measurement methods to analyse risk and return properties of private equity. The results of this academic research are not unanimous. Different measurement methods seem to generate different results. An ongoing academic debate is the potential premium or alpha generated by private equity funds. Related to this debate is the extent of the correlation between private equity and stock markets. It seems that a proper risk adjustment for performance is important to determine reliable results.
After a short introduction in the conventional analysis framework, the capital asset pricing model, the second section discusses the systematic risk and return properties of private equity. Thirdly, the complementary unsystematic risk and return properties are analysed.
4.1 Capital asset pricing model
In financial literature risk and return properties are often analysed with the Capital Asset Pricing Model (CAPM). This model determines how risk and return characteristics of a security are related. This model will also be used in the analysis of the risk and return characteristics of private equity.
The return of a security can be seen as a combination of systematic return and unsystematic
return. The systematic return is proportionally related to the market return RM. The factor β
indicates the sensitivity of the security with the market. The idiosyncratic return is
independent of market movements and is expressed by α. The formula is completed by the
error term with a zero mean.
ε β
α+ +
= RM
R
The capital asset pricing model only uses the beta of the security to determine the expected return. Alpha returns, both positive and negative, can be added to the expected return calculated according to CAPM. Alpha is a measure for excess return and related to
unsystematic risks. Factors like liquidity and information asymmetry are not incorporated as
in the CAPM model. RF is the risk free rate. This model describes the return of an individual
security in relation to the market.
] ) ( [ )
(Ri RF i E RM RF
E = +β −
Systematic risk can be expressed as: β*stdev(RM)
Unsystematic risk can be expressed as: stdev(ε)
4.2 Systematic risk & return
Private equity investments and thus private equity funds have a complex risk profile. The risk profile is changing over time (due to strategic, operational and capital structure changes of underlying investments) and cannot be compared easily with other asset classes. The risk profile of a single private equity investment changes during its lifetime. A company is purchased with a certain equity beta. The initial leverage amplifies this market exposure. During the lifetime of the investment the leverage decreases due to the debt repayment and thus the market exposure decreases consequently. The declining leverage in private equity investments creates a dynamic risk profile. An average private equity fund holds
approximately 10-15 investments. These investments all have this dynamic risk profile. The investments, probably differing in industry sectors or geographical areas, all have different initial market exposures and different market exposures at exit. It is very complex to analyse the risk exposure of the complete private equity fund portfolio during the different phases. For fund of funds it is even more complex to analyse the market exposure of the portfolio.
Systematic risk or undiversifiable risk is related to beta or market exposure. This risk depends on market developments and cannot be diversified. Like other companies (privately held and listed) private equity companies are exposed to the market and thus exhibit undiversifiable risk as well. Private equity funds initially focus on low volatility companies with a low correlation to market movements (Groh & Gottschalg (2006)). This allows the funds to reorganise a company without having too much market exposure with potential negative consequences. However a company is acquired with a considerable amount of leverage that increases the business risk of the equity. This leverage decreases over time and the business cycle sensitivity of the equity (or NAV) decreases as well. One could draw a beta exposure curve that represents the theoretical market exposure of a private equity fund. This curve depends on the investment and divestment timing of the individual investments of a private equity fund and is thus related to the J-curve. Other driving aspects are the leverage profile, equity weights of each investment, portfolio investment maturities and investment industry sectors.
Groh & Gottschalg (2006) analysed operating and leverage risk to adjust private equity performance for systematic risk in the US. In their article comparable companies (size and sector) are “re-leveraged” to get the same risk profile as the already leveraged buyout companies. Both groups then exhibit the same equity beta. During the holding period the leverage in the buyout group decreased and so the leverage of the control group was adjusted consequently. After the holding period of the leveraged buyouts, the company values of both groups were compared. In their analysis the authors find that when adjusted for systematic risk leveraged buyouts outperform comparable companies. The method the authors used required confidential company specific information which was available for the first time. The calculations the authors used are an indirect way to measure market risks related to private equity investments. Re-leveraging comparable companies can reveal market risk exposure.
Other authors also analysed private equity performance and adjusted risks differently. The different risk adjustment methods result in different research results (Ljungqvist &