National Conference on Engineering Innovations and Solutions (NCEIS – 2018)
International Journal of Scientific Research in Computer Science, Engineering and Information Technology
© 2018 IJSRCSEIT | Volume 4 | Issue 6 | ISSN : 2456-3307
Upgrading Normal TV into a Smart TV using Raspberry Pi
Dr. H D Phaneendra1, Chaitanya S Lakkundi2, B Rajasimha Reddy2, Mohd Sanad Zaki Rizvi2 1Head of the Department, CSE, The National Institute of Engineering, Mysuru, Karnataka, India
2Computer Science and Engineering, The National Institute of Engineering, Mysuru, Karnataka, India
ABSTRACT
Context- A television is perhaps the most common gadget in any household. Recent technological advancements have given rise to the idea of Smart TV. The general cognition of “smartness” encompasses features including but not limited to internet access, social media, live media streaming etc. Researchers have shown that people tend to like puzzles and memory games on a Smart TV more than the usual social media content.
Objective- To provide additional features to a traditional TV such as video streaming, games, puzzles, health tips. TV usage analytics can prove useful to extract usage patterns and predict health effects.
Methods- We use Raspberry Pi as the base hardware. The video extracted using TV tuner is analysed using machine learning algorithms. Health tips are provided based on TV usage patterns. An open source software i.e Kodi was used to provide live media streaming. Kibana was used to display analytics interactively. A web interface was developed to interact with the system.
Results- We were able to implement the design in a cost effective way compared to available solutions. Additionally, health tips, puzzles, memory games were provisioned.
Significance- Smart TV can provide facilities in rural areas to improve the education quality. Additional facilities such as remote health monitoring can be provided. A Smart TV can serve as a tool in providing wholesome IoT solutions.
Keywords: Smart TV, Raspberry Pi, Health Monitoring, Machine Learning, Image processing.
I.
INTRODUCTION
The purpose of this research is to devise a method to upgrade a normal TV into a Smart TV. The term “Smart” may conjure up many fascinating ideas in the mind. For the purpose of this paper, we are considering a subset of the meanings induced by this term. They include, accessing social media content, live media streaming, memory games, puzzles etc.
Costa et al. [1] has shown that the most appreciated services on Smart TV include puzzles, sequence sorting games, rehabilitation videos, news and so on.
The most obvious and usual perception of Smart TV is about internet connectivity, video streaming and social media. For the purpose of completion of this definition, we have added features supporting social media also.
We investigated the available solutions in the market relating to this subject. We found that products such as Google Chromecast and Amazon Firestick employ very minimum features. Google Chromecast, being the most limited in the features it provides. The Andorid phone’s screen is mirrored onto the television assisting the user to view content on a larger screen. Amazon Firestick adds a couple other features including videos on demand, custom remote and Amazon exclusive movies. We observed that the products were slightly overpriced compared to the features they provide.
We used Raspberry Pi as the underlying hardware to support data collection and processing. Raspberry Pi, being a powerful embedded system with an affordable price just fits in the niche. A cloud-based solution is chosen to visualise the collected data. Kibana provides an interactive and intuitive dashboard to display analytics. We used Kodi, an open source media entertainment software to connect to the social world. Finally, a wide-ranging product is made available to the user. The product being a mixture of entertainment, social media, puzzles, news articles, memory games, health tips etc.
In the further sections, the overall system design is discussed, followed by image extraction and logo detection using machine-learning algorithms. At the end, a novel user interface to interact with the system is discussed in detail.
II.
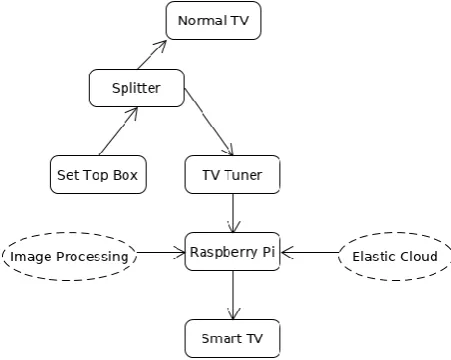
SYSTEM DESIGNThe system is designed in the form of a pipeline. The following flowchart shows the components used and the flow of control.
Figure 1. System Design showing all the components
The central hardware used in this project is a Raspberry Pi. The video input from set top box is sourced into Raspberry Pi via a TV tuner. The splitter assists in providing inputs to both the normal TV and TV tuner. We use Elastic Cloud to analyse the data. News articles, games are provided by a custom interface.
III.
IMPLEMENTATIONA. Channel Logo Extraction from real-time video
It is imperative for our project to extract image of channel logo that the user is currently watching. Since we have a continuous stream of video, we need to extract logo of the currently active channel at fixed intervals along with its timestamp. The interval cannot be too long, because it might miss channel change events and it cannot be too small because it will be computationally intensive for our systems. The entire process of channel logo extraction can be divided into two major steps: 1) Extracting frames at fixed intervals and, 2) Cropping out the channel logo from the frame.
ffmpeg -i "$INPUT_VIDEO" -s 640x480 -ss 00:00:$TIME -vframes 1 $FRAME; where -i refers to the video stream from the TV, -s defines the resolution of frame shot to be taken, -ss tells the fixed interval to take frame shot at, -vframes defines the number of frames to be taken at the end of time interval and $FRAME is the name of the output variable. At the end of the process, the frame shot is stored in the file named $FRAME and is passed onto the next stage.
2) Cropping out the logo from the extracted frame: Once the frames are extracted and stored along with their timestamps, the next step is to crop out the unnecessary part of the frame image so that only the channel logo remains. This makes it easier to process for image processing and machine learning in the next stages. We have used image magick a free and open source software for image conversion and processing for this task. We used the following custom command. convert $FRAME -crop $channel_dimen $LOGO; where $FRAME is the same frame shot that be extracted in the previous stage, -crop gives the dimensions and (x,y) coordinates of the logo in the frame to be cropped and $LOGO is the variable that stores the output logo. Once the logo is extracted in this step, it is passed onto the next stage where robust image processing and machine learning techniques are used to classify the logo images to channel names.
B. Channel detection using ML on Logos
As the logos were extracted in the previous steps, the next step would be to recognize a channel by its logo. We used machine learning for this task.
Figure 2. The complete process of logo recognition using machine learning
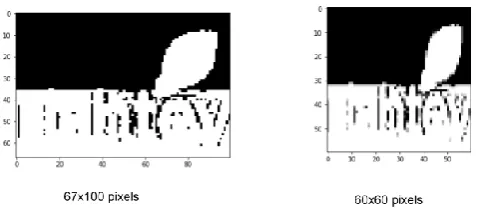
features from the image that can better represent the information present in it. In this case, since we are using SVM that works well with sparse data, we represented each image by a vector of its pixel values (each such vector was 60x60 = 3600 data points).
Figure 3. Shows how choosing different thresholding techniques can impact the performance of the classifier by better or worse representing an image.
Figure 4. Shows how resizing helps to standardize the entire dataset into a size of 60x60.
C. Data logging to Elasticsearch using curl
After the channel logo is recognised, it is logged into Elasticsearch along with a timestamp. Elasticsearch is hosted on the AWS cloud. RESTful API is used to send data into Elasticsearch. The data can then be analysed and presented in a visually appealing way using the front-end software Kibana. These tools form a part of the ELK stack. A sample POST request using curl is given. curl -XPOST "hostname/index/type" -d '{ "name" : "test" }'. All the softwares were implemented in a Linux environment. The output from Kibana is taken as a web iframe and
integrated with the custom web interface provided along with this product.
D. Suggesting Health tips
To consider the implementation of health tips, we closely studied the traditional Indian model of human mind as given in Shrimad Bhagavad Gita. It consists of modelling the mind as a mixture of three distinct qualities. They are Sattva, Rajas and Tamas. They can be loosely understood as, equanimity of the mind i.e. Sattva, vibrancy in actions i.e. Rajas and inertia in the activities i.e. Tamas. Every human being is a mixture of various proportions of these qualities. They keep dynamically changing in every person per situations.
In this project, we have tagged TV channels based on this model relating to the content displayed. For example, a news channel can be classified as predominantly Rajasik, a spiritual channel as Sattvik and a movie channel as a combination of Rajasik and Tamasik.
∑ ∑ ∑
( )
Equation 1. Calculation of Health Index value
E. Web Interface to integrate Kodi, Kibana and Games
We provide a custom built web interface to integrate various softwares and present analytics using Kibana. User Interface is the key part of experiencing a software. Here we provide the user with a web interface where it has features of homepage that shows the user, news & trending topics, analytics page where user gets TV usage patterns shown in graphs. Kodi is the open source software, which adds social media features to the TV and has controls that enable users to turn on and off the application from the UI. Games are also part of smart TV and hence are integrated in such a way that controls are shown on mobile and game is projected onto the TV which makes user interaction flow.
React framework is used at the frontend to register user actions and act accordingly. Python server is used at the backend to run the game server and keyboard control server.
To interact with the Smart TV, keyboard events are dynamically generated using xdotool.
IV.
RESULTS AND DISCUSSIONThe results are discussed separately for different activities in the product pipeline. The various components are tied into a single product, which perform independent tasks in collaboration with each other.
Raspberry Pi processor clocked up to 0.5 load average and a peak temperature of up to 65oC.
The image processing and recognition involved a heavy-duty training process for machine learning algorithm. Finally, we generated a Python pickle file containing trained data, which could be used for image recognition on the fly. Accuracy in logo recognition is tabulated below along with the waiting time to recognise the logo.
An interesting observation was made while completing logo recognition. To recognise any logo independently for the first time, the time taken was 5.5 seconds on an average. But subsequent rounds took negligible time. Eg. The total time taken to recognise a set of 45 logos was 6.7 seconds.
Table 1. Logo Recognition Metrics takes about a second for every log operation.
The custom dashboard is provided with the help of React framework on a web browser. Chromium is used for this purpose which performs under 0.5 load average.
We were able to provide a Smart TV experience in a normal TV. The final product is able to recognise the channel watched by the user in real-time. The product is able to calculate the health index by mixing proportions of Sattva, Rajas and Tamas. Games are provided as an additional entertainment source.
The significance of this paper emerges from the fact that our proposed Smart TV system can be used in rural household to provide quality education to children. The elderly population can get health tips in the course of using our product. In addition, the middle-aged population is benefited by the virtue of an indicative health index as proposed in our system.
VI.
FUTURE SCOPEIn this paper, we provide a method to design the pipeline of Smart TV. Many enhancements can be provisioned. In the future, we plan to integrate methods to support remote doctor consultation. These must be preceded by addition of hardware components such as pinhole camera to Raspberry Pi. We also plan to make the analytics process independent of external dependencies such as the cloud. We also plan to add educational content in the Smart TV so that it can prove helpful in rural areas.
VII.
REFERENCES[1] C. R. Costa, L. E. Anido-Rifón and M. J. Fernandez-Iglesias, "An Open Architecture to Support Social and Health Services in a Smart TV Environment," in IEEE Journal of Biomedical and Health Informatics, vol. 21, no. 2, pp.
549-560, March 2017.
doi: 10.1109/JBHI.2016.2525725
[2] Billis, Antonis S.; Batziakas, Asterios; Bratsas, Charalampos; Tsatali, Marianna S.; Karagianni, Maria; Bamidis, Panagiotis D.: 'Enabling active and healthy ageing decision support systems with the smart collection of TV usage patterns', Healthcare Technology Letters, 2016, 3, (1), p. 46-50, DOI: 10.1049/htl.2015.0056
IET Digital Library, http://digital-library.theiet.org/content/journals/10.1049/htl.20 15.0056
[3] He Jingmeng, Xie Yuxiang, Luan Xidao, Niu Xiao and Zhang Xin, "A TV logo detection and recognition method based on SURF feature and
bag-of-words model," 2016 2nd IEEE International Conference on Computer and Communications (ICCC), Chengdu, 2016, pp. 370-374.
doi: 10.1109/CompComm.2016.7924725
[4] Xinwei Wang, Dongmei Li, Shaobin Li and Shanzhen Lan, "Video corner-logo detection algorithm based on gradient map of HSV," 2016 2nd IEEE International Conference on Computer and Communications (ICCC), Chengdu, 2016,
pp. 506-510.
doi: 10.1109/CompComm.2016.7924752
[5] R. Hinami and S. Satoh, "Audience Behavior Mining: Integrating TV Ratings with Multimedia Content," in IEEE MultiMedia, vol. 24, no. 2, pp. 44-54, Apr.-June 2017. doi: 10.1109/MMUL.2017.25