International Journal of Scientific Research in Computer Science, Engineering and Information Technology © 2017 IJSRCSEIT | Volume 2 | Issue 6 | ISSN : 2456-3307
Data Science : From Simple Terms to Building A Team
Pranav Murali
SRM University, Chennai, Tamil Nadu, India
ABSTRACT
Data science is nothing but answering specific questions with data. It involves dealing with data to make decisions involving real life actions. Data science has various forms. This paper talks about the various topics associated with data science and also gives a brief approach on how to build a data science team. Starting from prediction analysis to software packages, a great deal of topics are covered. The necessary steps in building a successful team to encounter dealing with complex data has been discussed. We talk about various levels of organisations and also their respective priorities when it comes to recruitment of a typical data science team. We also see how that team can be moulded to work in a real life data science company.
Keywords : Prediction Analysis , Machine Learning , Software Package , Statistical Inference , Decision
I.
INTRODUCTION
PREDICTION ANALYSIS :
An important feature of data science is Prediction of results from the given set of data. Predictions are typically evaluated by a measure of prediction performance. Predictions are of types such as
Descriptive analysis that includes :
Basic summary tables, exploratory data analysis and ‘Statistical inference’ which is defined as the process of drawing conclusions about populations from a sample.
MACHINE LEARNING :
Another important part of data science is ‘Machine Learning’ where algorithms are applied to a set of data and computations take place to produce results.
There are 2 broad categories of machine learning
Unsupervised learning
Supervised learning
Supervised machine learning algorithms focus on prediction through prediction performance. Unsupervised machine learning involves trying to uncover unobserved factors in data without any gold
standard to judge against. Some example algorithms include k-means , factor analysis.
A way to obtain generalizability of a machine learning algorithm is to test it on novel datasets.
Traditional statistical approaches often differ from machine learning approaches by focussing on super-population models, by often placing a higher priority on parameter interpretability and simplicity over prediction performance.
SOFTWARE PACKAGES :
Software packages are another significant part of a data science process. These are the underlying ports that connect the dots to a successful data science experiment .Benefit of building software packages for data analysis is that software provides a well defined interface that can abstract low-level technical details of data analysis routines.
Software packages are needed when members of another team/group wish to apply your same analysis to their own data sets, when an analysis or part of an analysis must be done more than once or twice.
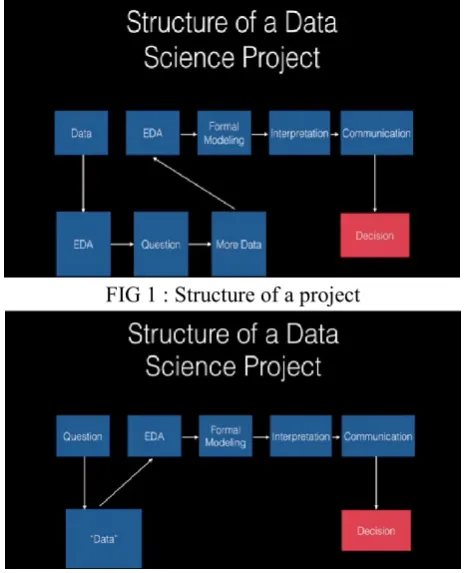
EXPLORATORY DATA ANALYSIS:
Consider a situation where an analyst on your team engages in exploratory data analysis of a dataset. The exploratory data analysis inspires him to ask a new question about the data so he begins the data analysis process on this same dataset and goes through the 5
phases so that they can be applied in different situations.
What went wrong ?
The development of the question and the answer to that question where done using the same set of data. 2 goals of Exploratory Data Analysis (EDA) are determine if data are suitable for the question, sketch an answer to your question. The 2 stages in which a data science project might start are EDA , defining/stating the question.
Decision making is not part of the data analysis process.
FIG 1 : Structure of a project
FIG 2 : Alternate structure of a project
The 2 figures above show us the 2 different ways a data analysis process can be done to a set of data.
OUTPUTS AND TOOLS:
Outputs of a data science experiment are reports, Presentations, Web pages and apps.
Reproducibility tools for reports like Knitr help with documenting the analysis, getting the data scientist to think about the report during analysis, reproducibility. For maintaining the data science app good code documentation , version control must be done.
Knitr , ipython notebooks are tools for reproducible report writing ! A good report is being clear with concise conclusions ! Some ways we can declare success in data science include ‘new knowledge about the phenomena under study is created, decisions are made based on the data analysis’. Learning that the data in question can’t answer the question being posed is a useful result of a data science experiment.
TOOLS , PRODUCTS , APPS:
Data apps and products are useful for creating impact of a data science experiment. A negative outcome from a data science experiment would include ignoring data despite having clear evidence.
Chat tools like Slack , Help websites like
Stackoverflow , Data programming languages like R ,
Databases like MongoDB are some of the tools in data
science.
Data science tools are constantly updating, so keeping in touch with your data science colleagues is essential for success.
BUILDING A DATA SCIENCE TEAM :
To build a data science team we would require data managers , data engineers , data scientists all together to build the infrastructure for a typical data science project along with people outside to communicate their results.
DATA ENGINEER :
DATA SCIENTIST:
The second step in a data science team formation involves the role of a data scientist. The data scientist pulls this data available , analyses it , performs machine learning algorithms and also mathematical and logistical computations to yield a favourable result that is desired by the company.
DATA MANAGERS:
These people are responsible for the communication and healthy interaction with an organization within the company or outside the company and keep the data science team intact.
Levels of organisations and their requirements :
There are various organisations and the data science
If it is a start-up, the primary goal of the data science team must be to pull data out of the data base and have a secure server to store them. The projects that start-ups have might be on a low scale level , so secure storing of data is the most significant process for such companies. Then comes data visualisation. There isn’t a need to analyse the data so much because their projects would be simple and they wouldn’t be needed highly skilled data scientists to look for complex patterns and develop algorithms.
So the order of preference while recruiting a team in a start-up goes like this
Data Engineer
Data Manager
Data Scientist ( if needed only )
MID-LEVEL ORGANISATION:
As the organisation reaches a good state in the market , they start getting projects involving manipulation , computation and generation of machine learning
algorithms for data . They would have to pull data from many data bases , analyse them , look for patterns and trends , generate algorithms for recommendation systems , visualisation etc. This data would further have to be put in a concise and precise form that may be understandable to a person who’s not actually involved in the project. Various visualisations and marketing are done. This final data set is then further sent to the respective organisations looking for such information and the role of managers and their interaction with the outside becomes vital. So, the order of preference for recruitment goes this way
1) Data Scientist 2) Data Manager 3) Data Engineer
Advanced Organisation:
These kind of companies receive not just complex data from many servers but also require a top notch infrastructure along with great managers. While managers help managing various teams working on different projects and correlating them to work at a pace , data scientists and data engineers also are vital .
Data engineers pull data and send it out for the data scientists to analyse. These data scientists develop trends and patterns. But that’s not their only job. They would have to implement this data on a large scale. So, data is once again sent to the data engineers. Scaling of data on a large scale is done by the engineers.
Further, data scientists use visualisation tools like TABLEAU and enhance their results before sending them to the data managers for communication.
SETTING UP OF TEAM:
acknowledged by the fresher just beginning his life at that company.
PRESENTATIONS/DEMONSTRATIONS:
This is the first step in the initialisation process . It involves depicting the infrastructure , overall outlook of the company ,design and working of the surroundings. Only these would give an idea to the new comers on what they could expect from the company and what the company would expect from them in return. A clear mindset thus emerges inside every new employee’s perspective and he/she knows about their roles and would get trained accordingly.
FIG 3: Presentation Outline
The above figure shows the parts of a typical presentation outline of a data science project.
TRAINING:
This is the next step after demonstrations. Training is the most important part of a successful company. Only adequate training helps workers to channel their strengths and weaknesses accordingly. They can be mould and put in different arenas of the company and can be used to get the best results. Each employee would have different set of skills. Some may be good at data analysis ,looking for patterns , trends, while some maybe good at reading through data from databases , pulling them up from various web services across the world and running algorithms and predicting machine learning outcomes from them. would feel the need to work at his best and produce the required results. Data science is a very complex field and we don’t usually get the desired outcomes. It involves a lot of strenuous thinking. Even with such great efforts , we might not get the desired results from the data and become desperate and frustrated. So kick starting the lives of employees with a simple project and giving them confidence is very important.
SIMPLE PROJECTS TO KICK START CAREER:
As said earlier, simple projects could be used to kick start their career. Like Kaggle, an online data science website where various tasks are being presented and competitions are held. Teams of members could be directed at such tasks and they could be asked to engage in such activities and participate in them. This kind of invokes a sense of excitement and winning such competitions could make them feel good. Also many start-ups give out simple projects to companies for their uses. Such simple projects could be taken up by employees and they could give out their ideas about such projects. The idea of giving out simple projects in the beginning is to give an idea of relief, excitement and mainly confidence of their skills which would often be tested in the future projects.
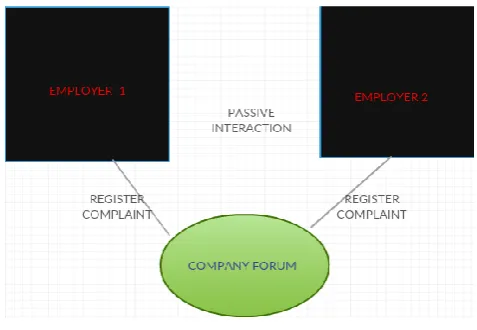
INTERACTION:
kinds of interactions: active, passive. Active interactions are those interactions that indulge in peer group discussing and thus getting the answers to the problems an employer may have , whereas passive interactions are also useful where an employer with a problem registers the issue with the company and this leads to an experienced person stepping into the project and helping him/her out with a solution. Anyway, active or passive doesn’t matter as long as the person is not stuck in one particular stage of a problem.
FIG 4: ACTIVE INTERACTION
FIG 5: PASSIVE INTERACTION
The above 2 figures show us the difference between active and passive interaction.
BEING THICK SKINNED:
One thing that is something that people coming to data science field must realise is that it is always evolving and projects of so many different kinds always keep coming your way. Tasks for each and every project differ and many times we get undesired outcomes even after so many months of struggle. So reporting such outcomes to the managers and being cool, thick-skinned and not letting anyone get under your skin is very important. This has to be taught by the managers
of the company to their employees because temperament and being patient is very vital for a data scientist. Even complex machine learning algorithms might not do the job and give you the data needed for evidence. So being thick-skinned, calm and patient are characters that must be followed while working in a data science company.
UPGRADING TO NEW TECHNOLOGIES:
Every now and then new technologies arise in this field. So, having a sense of all the tools and technologies are very important as data manipulation from data bases and analysis, mining all are done in various forms and different tools are used in different ways. One tool might be useful for a certain project but it can’t be generalised and used in all the projects. So, upgrading oneself to emerging technologies and tools around data science is a good quality and the company must have people looking into such news and often advise their employees to work towards such innovations and keep themselves updated.
COMMUNICATION WITH EXTERNAL PEOPLE:
We know that communication helps but this is not just within the organisation but also with the outside world. Slack, is one such feature where data science related people interact with each other about various issues they face ,emerging tools and how they could use them , accomplishments etc.
FIG 6: SLACK , Communication Tool
The above figure is the picture of a popular website Slack
ACCOMPLISHMENT CELEBRATION:
employees across various sectors of the company. So, celebrating such success often helps lighten up the mood of the office which plays an important role in the functioning of companies. Learning to celebrate success in data science is important as it doesn’t happen easily.
II.
CONCLUSIONS
We saw in detail about various aspects involved in data science and covered many topics. We saw what a typical data science team would need and how various levels of organisations would have their priorities when it comes to recruitment of a data science team. We also saw how an organisation should function, once recruitment is done with various discussions about building that team in an organisation and helping them work in the real world of data science.
III. REFERENCES
[1]. E. AbuKhousa and Y. Atif (2014), "Big learning data analytics support for engineering career readiness," Interactive Collaborative Learning (ICL), 2014 International Conference on, Dubai, 2014, pp. 663-668.
[2]. Ferguson, R. and Buckingham Shum, S. (2012). Social Learning Analytics: Five Approaches. LAK 2012 , 23-33.
[3]. Elearningindustry,https://elearningindustry.com/big-data-in- elearning-future-of-elearning-industry [4]. Edbrix, http://www.edbrix.com/single-
post/2016/05/05/Role- of-Big-Data-and-analytics-in-E-learning.
[5]. Data science comparison with big data , https://www.simplilearn.com/data-science-vs-big-data-vs-data-analytics-article
[6]. https://ori.hhs.gov/education/products/n_illinois_u/dat amanagement/datopic.html