CSEIT1831286| Received:11Feb2018 | Accepted:22Feb2018 | January-February-2018[(3) 1 : 1515-1520]
International Journal of Scientific Research in Computer Science, Engineering and Information Technology © 2018 IJSRCSEIT | Volume 3 | Issue1 | ISSN : 2456-3307
1515
Detection of Glaucoma using Cup-to-Disc Ratio and Blood
Vessels Orientation
Deepthi K Prasad*1, Vibha L2, Venugopal K R3
*1Full Time Research Scholar, Department of CSE, B N M Institute of Technology, Bangalore, Karnataka, India 2Professor, Department of CSE, B N M Institute of Technology, Bangalore, Karnataka, India
3Principal, UVCE, Bangalore University, Bangalore, Karnataka, India
ABSTRACT
Glaucoma is a disorder that causes injury to the optic nerve of the eye due to increased in the Intra Ocular Pressure (IOP). It can damage the optic nerve asymptotically, lead to vision impairment and progress into permanent blindness if it is not treated early. In the proposed work, the presence of glaucoma is detected by analysing the fundus images. The work includes method for segmentation of the retinal optic cup (OC) and the disc. The size and shape of the optic cup are measured. The Cup-to-Disc Ratio (CDR) is computed. The blood vessels present inside the optic disc (OD) are also segmented and their orientation is analysed which strengthens the accuracy of the detection. The input images are classified as glaucomatous or normal based on the combined results of CDR and blood vessel orientation. DRIONS database images are used to carry out the experimentation, the outcomes are optimistic. The accuracy obtained is 96%.
Keywords: Glaucoma, Optic Cup, Optic Disc, Cup-To-Disc Ratio, Fundus Images, Blood Vessels
I.
INTRODUCTION
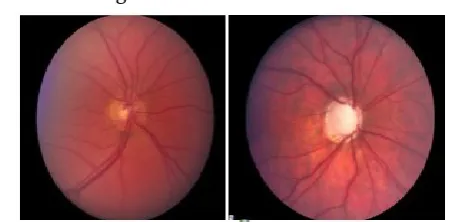
Glaucoma is an array of diseases associated with the human eye. It is characterized by elevated intra ocular pressure (IOP). The onset of this disease causes damage to the optic nerve without any manifestation. The chances of getting affected by glaucoma is high for people aged above 60 years but may also affect people who have eye injury or increased eye pressure. Figure 1 depicts the fundus image of a healthy eye and glaucoma affected eye. This disorder can be of one of two types namely, Open-angle glaucoma and Close-angle glaucoma. Both of these types are due to increased IOP but the latter one develops at a faster pace compared to the former type of glaucoma. Regardless of the types, glaucoma is asymptotic at the onset.
People who are affected by glaucoma do not show any symptoms. So early screening is essential to avoid loss of sight.
Figure 1. Healthy Fundus Image and Glaucoma Affected Fundus Image with Damaged Optic Nerve
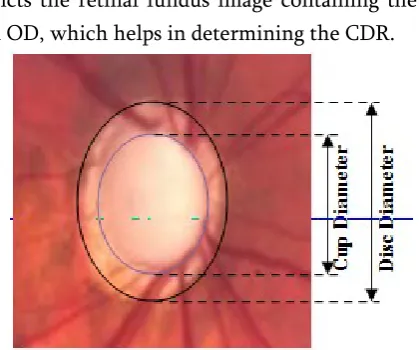
(ONH) and the optic disc (OD) are the vital signs to detect glaucoma. ONH structures are OD Diameter, CDR, and OC diameter to name a few. Figure 2 depicts the retinal fundus image containing the OC and OD, which helps in determining the CDR.
Figure 2. Optic Cup-to-Disc Ratio
The organization of this document is described below. In Section 2 consists of literature review of glaucoma detection. The proposed glaucoma identification system is described in Section 3. The algorithms used in the work are described in Section 4. The next section discusses the results obtained and the last section presents the conclusion and future scope of this research work.
II.
LITERATURE REVIEW
Work carried out in the field of glaucoma detection is described in this section.
Glaucoma detection uses the digital retinal fundus images commonly for easy and quick diagnosis. Various algorithms are proposed by researchers to detect and classify glaucoma.
Jun Cheng et al., [1] proposed the self-assessment disc segmentation method. CDR is computed using the method of “Sparse Dissimilarity-Constrained Coding (SDC)”.It is used to segment and locate the OD from the image.
Jiang liu and yanwu [2] presented a method to segment the OC from retinal fundus image by
method to group the image based on category and to separate a particular image portion.
Prashanth et al., [3] presented an approach for separating the OD from retinal image using boundary extraction and thresholding methods. The image is enhanced by histogram equalization. Morphological operators extract the OD and adaptive threshold is used for the segmentation.
Ashish et al., [4] presents a computerized glaucoma detection technique from the digital retinal fundus images. The input images are obtained by learning algorithm for glaucoma diagnosis. CDR, Neuro Retinal Rim (NRR) area and blood vessels regions are extracted and given to the learning algorithm for determining the presence of glaucoma.
Li and chutatape [5] developed algorithms to obtain features manually and effectively from colour images. An enhanced version of Active State Model (ASM) was developed for detecting the OD shape based on the localization of fovea. Edge detection is accomplished by a method to identify exudates using combined region growing. The accuracy percentages are rates are 99%, 94% and 100% respectively for OD localization, OD boundary detection and fovea localization.
A. K. Nandi et al., [6] proposed a technique to localise OD and fovea. OD localisation is achieved using Hough transform and various morphological operations. The fovea is separated using the spatial distribution of the macula using its spatial relationship with the OD.
distance between the feature vectors using the Euclidean distance formula.
J Arulmozhivarman et al., [8] developed a system for glaucoma detection by assessing the Retinal Nerve Fiber Layer (RNFL).It uses the “active contours based deformable snake algorithm” for separation of the boundaries of the RNFL. The dataset consisted of 89 images. The accuracy obtained for OD detection was 97.75%.
K. Kavitha and M. Malathi [9] proposed, “Glaucoma is asymptomatic in the early forms and the associated vision loss cannot be restored. Its early detection and subsequent treatment is essential to prevent visual damage”. Three methods for detecting glaucoma were proposed namely, amount of increased IOP, degree of abnormal visual field and percentage of damage to the optic nerve head. The higher CDR value indicates severe risk of glaucoma.
S. Letishia Mary [10] proposed a method to segment OD from OC using adaptive threshold, connected component and gradient method. The isolation of OD is performed by analysing the vessel network in the retina. The system used red channel image for image analysis. The steps of the approach were background normalization, detection of saturation value in red, removal of vessels and isolation of bright region. The region is segmented by thresholding. The system calculated disc area, bright area and blood vessel area from the images.
III.
PROPOSED SYSTEM
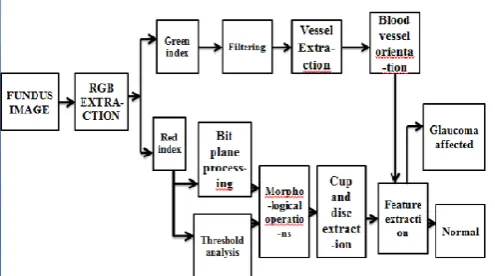
The proposed system detects whether the given input image is glaucoma affected or normal based on the CDR and blood vessel orientations. DRIONS –DB [11] image is used as input image for detection. The overall architecture of the glaucoma identification system is shown in Figure 3.
Figure 3. Architecture of the Glaucoma Identification System
It comprises of the following modules Cup extraction
Disc extraction
Blood vessel extraction
Feature Extraction and classification
Cup extraction: The three channels of the RGB image are red, green and blue. The cup is hidden in the red channel image but OD is seen. For computing CDR, both disc and cup are needed. In this work, red channel image is selected for OC and OD extraction and green channel image is used for blood vessel separation.
The red indexed image is converted to grey scale to view the features clearly. Median filter is used to separate the noise from the image as it preserves the data. Global thresholding and morphological operation are used to segment and extract the cup region.
Blood vessel extraction: Green channel image is selected for blood vessel segmentation. The green index image is converted to grey image. Top hat filtering technique is used which would filter out and retain only the blood vessels. An average grey value is used as a threshold to segment the blood vessels.
Feature extraction and classification: A mask is drawn over the cup and disc. The orientation of the blood vessels around the circle is identified. Blood vessel orientation is analysed by the distribution of blood vessel into four quadrants of the image. If majority of the blood vessels belong to one or two quadrants then it is classified as advanced stage glaucoma image and if they spread in all the three or four quadrants then it is identified as early glaucoma or normal image. To strengthen the accuracy, the CDR is computed. If the ratio is greater than 0.3, it is identified as glaucoma affected image, otherwise a normal eye image.
IV.
ALGORITHMS
The various algorithms used in the detection of glaucoma are presented in this section.
Table 1. Algorithm for Analysing the Grey Level Threshold Value
Input : Fundus image from DRIONS database Output: Binary image
Step 1: extract red, blue and green components from the RGB image
Step 2: Transform RGB image to grey level image Step 3: Convert the grey scale image into a binary image where pixel value 1 represents white and 0 represents black
Table 2. Morphological Operation for Cup Extraction Input: Grey scale red channel image
Output: extracted cup image
Step 1: (Morphological open operation) Establish the
Step 2:Compute the area of every region of the image Step 3: Eliminate the area that is less than the average value (240)
Step 4: output the segmented cup image
Table 3. Bit Plane Processing Input: grey scale red channel image Output: segmented disc image
Step 1: perform bit plane slicing of the grey scale red channel image
Step 2: select the 7th bit plane of the image
Step 3: remove the pixels which are less than 700 using morphological erode operation
Step 4: dilate the image to fill the broken edges Step 5:output the segmented disc image
Table 4. Glaucoma Classification Algorithm Input: grey scale green index image
Output: glaucoma or normal image
Step 1: read the grey scale green channel image Step 2: apply top hat filtering to enhance the intensity of blood vessels
Step 3: create mask around the disc
Step 4: check for the orientation of blood vessels in all the four quadrants of the masked disc image Step 5: if the blood vessels belong to only one or two quadrants, the image is a glaucoma image, else normal
Step 5:compute the CDR of the image
blood vessel orientation detection strengthens the accuracy of detection.
Figure 4 shows the channel extraction output of the image into red, green and blue channels respectively
Figure 4. Extraction of Red, Green and Blue Channels
The image is converted to grey scale for the better clarity of the features. The grey scale converted images of the red, blue and green channels are shown in Figure 5
Figure 5.Grey Scale Images of the Red, Green and Blue Index Images
The extracted cup and disc images are shown in Figure 6a and 6b respectively.
Figure 6.a Extracted Cup Image 6b. Extracted Disc Image
The best fitting circles for the cup and disc are drawn for computing CDR. It is depicted in Figure 7a and 7 b respectively. To check the orientation of blood vessels, first blood vessels are separated using top hat
transformation. The extracted blood vessels is shown in Figure 8
Figure 7.Best fitting circles a. cup b. disc
Figure 8. Extraction of blood vessels
The orientation of blood vessels is checked by the distribution of blood vessels in the four quadrants of the OD. If most of the blood vessels belong to one or two quadrants of the circle, it is a glaucoma-affected image otherwise normal. This process is depicted in Figure 9.
Figure 9 a. Glaucoma affected image b. normal image
Performance metrics:
In the proposed method both the CDR and blood vessel orientation are used to classify the images as glaucoma or normal stages. CDR computation is the main technique used to classify the input whereas orientation of blood vessels strengthens the accuracy of classification.
True positive (TP): The input is glaucoma affected image and detected as glaucoma affected.
False Positive (FP): The input is a normal eye image and the output is glaucoma affected
False negative (FN): The input is glaucoma affected but detected as normal.
The accuracy refers to the percentage of images correctly classified as glaucoma affected or normal. This can be measured by the overall performance of the proposed process that includes classification and segmentation. This can be computed by,
Accuracy (%) =
The accuracy of classification obtained is 96%
VI.
CONCLUSION AND FUTURE SCOPE
Glaucoma is a disorder associated with the optic nerve, which can eventually lead to permanent vision loss if not treated at early stage. Early detection of this disease is very vital in medical diagnosis. The proposed system can detect the presence of glaucoma by computing CDR and further strengthen the accuracy by analysing the orientation of blood vessels. Such a system would help in basic classification of the fundus images, thereby eliminating the need for expensive diagnostic equipments especially at rural areas where there is shortage of experts. The overall accuracy obtained is 96%.
As a future work, the orientation of blood vessels can be further analysed to classify the glaucoma images as mild, moderate or severe stages by extracting textural features of the image.
VII.
REFERENCES
[1]. PrJun Cheng, Fengshou yin, Damon wong, "
Sparse Dissimilarity Constrained Coding for Glaucoma Screening", IEEE transactions on biomedical engineering, vol 62,No. 5,May 2015.
[2]. Jiang liu, yan wu, "Super pixel classification based
segmentation of OD and optic cup" , IEEE transaction on medical imaging, June 2013.
[3]. Prashanth, arun kumar patil, Ravi Shankar
mishra, "Segmenting the Optic Disc in Retinal
images using Adaptive Thresholding",
International Journal of Computer Applications (0975 – 8887), May 2014.
[4]. Singh A., Dutta M. K., ParthaSarathi M., Uher V.,
Burget R, "Image processing based automatic diagnosis of glaucoma using wavelet features of segmented optic disc from fundus image",
Computer Methods and Programs in
Biomedicine. 2016; 124:108–120. doi:
10.1016/j.cmpb.2015.10.010. (0975 – 8887), Aug 2015.
[5]. Li and Chutatape, "An adaptive threshold based
image processing technique", International Journal of Computer Applications (0975 – 8887), April 2014.
[6]. A. K. Nandi, W. Al. Nuaimy and S. Sekhar,
"Automated Localisation of an Optical Disk and Fovea in Retinal Images", 16th European Signal
Processing Conference (EUSIPCO 2008),
Lausanne, Switzerland, August 25-29, 2008
[7]. Sakthivel K, Narayanan R. "An automated
detection of glaucoma using histogram features", International Journal of Ophthalmology,
pp.194-200, 2015,
doi:10.3980/j.issn.2222-3959.2015.01.33.
[8]. Pachiyappan, A., Das, U., Murthy, T., Tatavarti,
R. "Automated diagnosis of diabetic retinopathy and glaucoma using fundus and OCT images", Lipids Health Dis. 11(1), 73, 2012
[9]. K. Kavitha, M. Malathi, "Optic Disc and Optic
Cup Segmentation for Glaucoma Classification", International Journal of Advanced Research in Computer Science& Technology (IJARCST 2014), vol. 2, Jan-March 2014.
[10]. S. Letishia Mary, "Segmenting Optic Disk Cup in Retinal Fundus Images", International Journal of
Computer Applications (0975–8887)
International Seminar on Computer Vision 2013.