CSEIT183381 | Received : 05 March 2018 | Accepted : 14 March 2018 | March-April-2018 [ (3) 3 : 314-321 ] 314
An Improved Leaf Disease Detection Method using Clustering
Optimization and Multi-Class Classifier Technique
Dr. Bhuvana S1, Kaviya Bharati B2 , Kousiga P2, Rakshana Selvi S21Associate Professor, Department of Computer Science and Engineering, Sri Krishna College of Technology,
Coimbatore, Tamil Nadu, India
2Research Scholar, Department of Computer Science and Engineering, Sri Krishna College of Technology,
Coimbatore, Tamil Nadu, India
ABSTRACT
Agriculture is the only passion to cultivate foods, raising a human‟s life and animals by producing desired plant products. India ranked in the world's five largest producers of over 80% of agricultural produce items, including many cash crops such as rice, guava, tobacco, etc. Identification of the plant diseases is the key to preventing the losses in the yield and quantity of the agricultural product. Health monitoring and disease detection on plant is very critical for sustainable agriculture. It is very complicated to monitor the plant diseases manually because it requires marvelous amount of work, skilled person in the plant diseases and also need the excessive processing time. The identification of objects in an image is probably start with image processing techniques such as noise removal, followed by (low-level) feature extraction to locate lines, regions and possibly areas with certain textures. Consequently, image processing is used for the detection of plant diseases. The proposed system consist of following phases like: image preprocessing, image segmentation using OTSU segmentation, clustering of an image using K-means, feature extraction using GLCM feature extraction, classification of the image by Multi class SVM classifier. In compared to existing system, the proposed system significantly identifies the plant leaf disease at an early disease and with an accuracy 96.7%.
Keywords : Image Pre-processing, OTSU segmentation, K-means, GLCM, Multi Class SVM
I.
INTRODUCTIONIndia is a cultivated country and about 70% of the population depends on agriculture. Farmers have large range of diversity for selecting various suitable crops and finding the suitable pesticides for plant. Disease on plant leads to the significant reduction in both the quality and quantity of agricultural products. Monitoring of health and disease on plant plays an important role in successful cultivation of crops in the farm. In early days, the monitoring and analysis of plant diseases were done manually by the expertise person in that field. This needs tremendous amount of work and conjointly requires excessive processing time. In most of the cases, disease
symptoms are seen on the leaves, stem and fruit. The plant leaf is considered which shows the major disease symptoms.
In existing system, various image processing techniques such as Probabilistic Neural Network, Genetic Algorithm, Support Vector Machine are used. But the quality of result can vary for different input data, requires tremendous amount of work, expertise in the plant diseases, and also need the excessive processing time.
convert to black and white image, OTSU method Literature survey for detection of plant leaf disease is describes in chapter 2. Chapter 3 gives the detailed description of the proposed system. Chapter 4 is to show the experimental result of the proposed system. Comparison and accuracy of the proposed system is given in chapter 5. Finally, chapter 6 presents the conclusion and future work.
II.
LITERATURE SURVEYIn this section, the different classification techniques used for plant leaf disease classification is proposed by Savita N. Ghaiwat [6]. A classification technique deals with classifying each pattern in one of the distinct classes and it is used to classify the leaf, based on its different morphological features using Genetic Algorithm, Probabilistic Neural Network, K-Nearest Neighbour Classifier, Support Vector Machine, Principal Component Analysis, Artificial neural network and Fuzzy logic. Selection of classification technique is tricky task because the quality of result can vary for different input data.
The detection of plant diseases using the leaves images are explained by Sachin D. Khirade [16]. It involves various techniques to segment the disease part of the plant, feature extraction and classification techniques to extract the features of infected leaf and the classification of plant diseases. The ANN method is to classify the plant diseases such as self organizing feature map, back propagation algorithm, SVMs etc. can be efficiently used. From these methods, this system can accurately identify and classify various plant diseases using image
processing techniques like image acquisition, image pre-processing, image segmentation, feature extraction and classification. But, the accuracy of the result is 86% only.
The technique to classify and identify the different disease affected plant put forth by Mrunalini R. Badnakhe [14]. By using the automated agricultural inspection, Farmer can given potentially better and accurate productivity. Digital Analysis of crop colour is significant and now it‟s becoming popular day by day. It is the cost effective method. Because changed in the colour are a valuable indicator of crop health and efficiency and survaibility. Then it can be measured with visual scales and inexpensive crop colour.
Software solution for automatic detection and classification of plant leaf diseases is proposed by S. Arivazhagan[2]. The developed processing scheme consists of four main steps, first a colour transformation structure for the input RGB image is created, then the green pixels are masked and removed by specific threshold value using segmentation techniques, the texture information are computed for the useful segments, finally the extracted features are passed through the classifier. The proposed algorithm‟s efficiency can successfully detect and classify the examined diseases with an accuracy of 94%. Preparatory outcomes on an informational collection of around 500 plant leaves insist the fitness of the proposed approach. In order to improve disease identification rate at various stages, the training samples can be increased and shape feature and colour feature along with the optimal features can be given as input condition of disease identification.
Anand. H. Kulkarni [1] proposed a strategy for recognizing plant sicknesses at beginning period and with precision, by utilizing various picture handling procedures and artificial neural network (ANN).
Volume 3, Issue 3 | March-April-2018 | http:// ijsrcseit.com
316
and colour features are extracted from the result ofsegmentation and Artificial Neural Network (ANN) is trained by choosing the feature values that could distinguish the healthy and diseased samples appropriately. Experimental result showed the accuracy rate of 91% by using ANN method.
III.
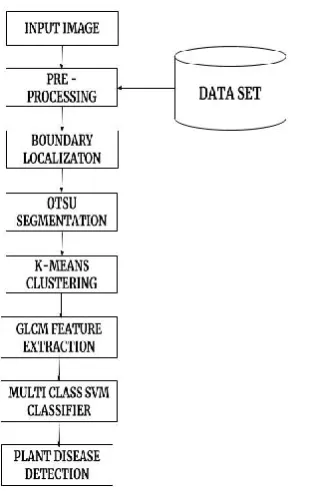
PROPOSED SYSTEMThe objective of the proposed system is to detect the plant leaf disease at early stage with better accuracy rate. Figure I shows the overall procedure of the proposed system.
Figure 1. Overall process of the proposed system
A. Pre-Processing
The aim of the pre-processing is to improve the quality of the image. It involves the following steps:
The input image is resized to 256 X 256.
A coloured image is enhanced to the contrast colour.
The input image is marked with red colour in the boundary, veins and affected part of the leaf.
B. OTSU Segmentation
Segmentation problems are the bottleneck to achieve fast object rendering from multi-dimensional image data, object extraction, and object specific measurements. Simple segmentation techniques are based on local pixel-neighbourhood classification. Such methods fail however to “see” global objects rather than local appearances and require often intensive operator assistance. The reason is that the “logic” of a object does not necessarily follow that of its local image representation. So that OTSU'S thresholding segmentation method holding a iteration through all the achievable threshold values and measure the pixel levels on each side of the threshold, i.e. the pixels that either fall in foreground or background[18].
INPUT: Pre-Processed Image
OUTPUT: Black and White image with threshold value.
The aim is to find the threshold value where the sum of foreground and [20]background spreads at its minimum.
STEPS:
The pre-processed colour image is converted to binary (black and white) image using im2bw(). The graythresh() uses the Otsu's segmentation
method, which selects the threshold value to minimize the intra class variance of the black and white pixels.
C. K - Means Clustering
Clustering is the process of organizing objects into groups whose members are similar in nature. K-means clustering is one of the simplest unsubstantiated learning algorithms that can solve the well known clustering problem. The aim of this algorithm is to minimize the square error.
STEPS:
The segmented image X, X= {x1,x2,x3,……..,xn} be the
set of data points in segmented image and V = {v1,v2,…….,vc} be the set of centers in segmented
image. The following step is to cluster the segmented image:
1. The „c‟ cluster centers was randomly selected. 2. The distance between each data point and cluster centers are calculated.
3. The data points are assigned to the cluster center whose distance from the cluster center is minimum of all the cluster centres.
4. The new cluster centre are recalculated using:
( ⁄ ) ∑
ci signifies the no. of data points in ith cluster.
5. The separation between all the data points and recently fetched cluster centres was recalculated. 6. The process are stopped if there is no data points are reassigned, otherwise repeat from step 3.
D. GLCM Feature Extraction
Gray-Level Co-Occurrence Matrix (GLCM) is the most classical second-order statistical method for texture analysis. An image is composed of pixels each with an intensity (a specific gray level), [12] the GLCM is a tabulation of how often different combinations of gray levels co-occur in an image or image section. Texture feature make use of the GLCM to provide a measure of the variation in intensity at the pixel of interest [7].
Initially the matrix was builted, based on the orientation and distance between image pixels. Then meaningful statistics are extracted from the matrix as the texture representation. The texture features are explained below:
Energy Contrast Correlation Homogenity Entropy
Energy: It is used to evaluate the homogeneity changing, reflecting the distribution of gray level image with equivalent weight and texture.
∑ ∑
p(x,y) is the GLCM
Contrast: Contrast is that diagonal close to the rotational inertia, that can measure the value of the matrix is scattered and local changes in number, reflect the image clarity and texture of shadow depth.
∑ ∑
Entropy: It is used to evaluate the image texture arbitrariness, when the space co-occurrence matrixes for all values are equal, it achieved the minimum value.
∑ ∑
Correlation Coefficient: Measures the dual probability occurrence of the particular pixel pairs.
C = sum (sum ((x-μx)(y-y)p(xy)/σxσy)) (5)
Homogeneity: Measures the closeness of the distribution of elements in the GLCM to the GLCM diagonal.
H = sum (sum(p(x,y)/(1+[x-y]))) (6)
Volume 3, Issue 3 | March-April-2018 | http:// ijsrcseit.com
318
∑
Where x is the largest pixel and y is the smallest pixel, μ is the mean value of x and y, σxσy is the standard
deviation of x and y, C(i, j) is the normalized histogram that is applied to coefficients resulting from wavelet decomposing. As a result, a vector of each image sample on the database was produced. The resultant vectors then will be saved in the memory in indexing feature vector which contains the indexes to both the names and the images of training database.
E. Multi Class SVM Classifier
Analyzed data are used for classification and regression analysis. It only covers the determination of the parameters for a given value of the regularisation and kernel parameters and choice of kernel. In a way the SVM moves the problem of over-fitting from optimising the parameters to model selection. Multi-class SVM provide a dense set of constraints, the number of variables in its dual problem is two dimensions. This value may explode even for small datasets. Here, we follow Crammer and Singer‟s work and further introduce a simplified method named Sim M-SVM for relaxing its constraints.
INPUT: Selected clustered image OUTPUT: Disease detection STEPS:
The following steps are used to classify the extracted image:
The extracted image T as tested set and training set S, the texture feature are taken as input for multi class SVM classifier.
The inputs are classified and grouped into a class. Both the sets are iterated for 500 times and
compare both the features and detect which disease affect the input leaf.
IV.
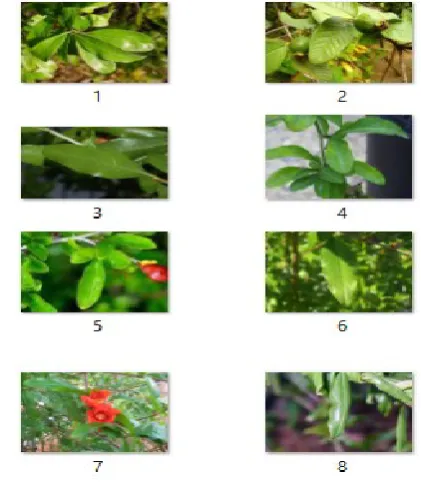
EXPERIMENTAL RESULTThe proposed system is implemented using MATLAB 8.3.0.532 (R2014a). Figure II shows the sample dataset images.
Figure 2. Sample Dataset images
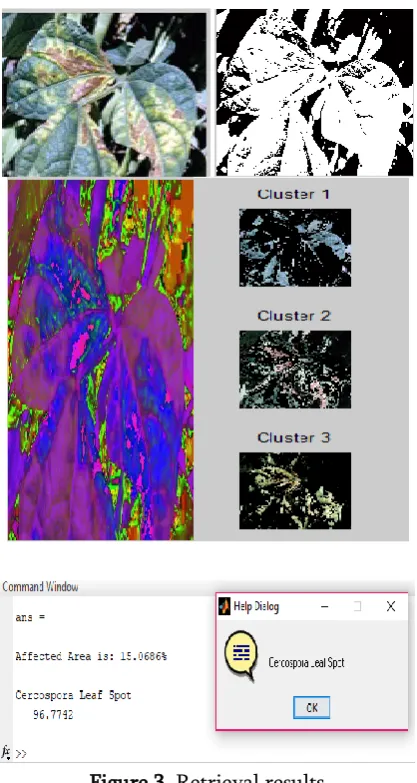
Figure 3. Retrieval results
V.
PERFORMANE EVALUATIONThe disease name was detected from the dataset with retrieval affected and accuracy percentage. Table I shows the accuracy of the proposed system. The accuracy percentage is calculated using the formula Equ (8).
Accuracy % = Group of element in the Leaf * Correct rate (8)
Table I. Accuracy of plant leaf disease
The accuracy of the plant leaf diseases from the table listed above are shown in Figure IV
Figure 4. Accuracy of plant leaf disease
The comparison of the proposed system and existing system are tabulated in Table II.
S.NO
Name of the Leaf
Existing System (%)
Proposed System (%)
1 Aspen 90 98
2 Dry Beans 90 96
3 Guava 96 98
4 Sussex 85 96
5 Tobacco 80 95
6 Over all
accuracy 89 96.6
Table 2. Comparison with proposed system and existing system
The comparison of the proposed system and existing system for the plant leaves on the dataset was shown in the figure V.
98 98.37 96 97 98
0 20 40 60 80 100 120
Ac
cu
rac
y
p
er
ce
n
tage
Plant Disease Name
accuracy
S.NO Leaf Disease Name
Accuracy (%) 1 Alternaria
Alternata
98
2 Anthracnose 98.37
Volume 3, Issue 3 | March-April-2018 | http:// ijsrcseit.com
320
Figure 5. Comparison with proposed system andexisting system
VI.
CONCLUSION & FUTUTRE WORKThe accurate detection and classification of the plant disease is very important for the flourishing cultivation of crop and this can be done using image processing. There are some feature extraction and classification techniques used to extract the features of infected leaf and the classification of plant diseases. The use of SVM methods for classification of disease in plants such as self-organizing feature map, back propagation algorithm, SVM etc., can be efficiently used. From these methods, the proposed systems is accurately identify and classify various plant diseases using image processing techniques. The accuracy of the proposed system is 96.7%. The future work principally worries with the extensive database and propel advance feature of colour extraction that contains a better result of detection. ISODATA clustering gives the better clustered data. Mutual Nearest Neighbour Algorithm is efficient for classification and its gives better result.
VII.
REFERENCES[1]. Anand.H.Kulkarni, Ashwin Patil R.K. Applying image processing technique to detect plant diseases International Journal of Modern Engineering Research (IJMER) www.ijmer.com Vol.2, Issue.5, Sep-Oct. 2012 pp-3661-3664 ISSN: 2249-6645.
[2]. Arivazhagan S,Newlin Shebiah R,Ananthi S. Detection of unhealthy region of plant leaves and classification of plant leaf disease using Texture features Agric Eng Int CICR 2013;15(1):211-7.
[3]. Bashir Sabah Sharma Navdeep. Remote area plant disease detection using Image processing. IOSR J Electron Communication Eng 2012;2(6):31-4.ISSN:2278-2834.
[4]. Bhagya Patil, AnupamabPatlanshetty, Suvarna Nandyal. Plant classification using SVM classifier, Computational Intelligence and Info Technol,2013.
[5]. Bhanu B,Peng J.Adaptive Integrated image segmentation and object recognition. IEEE Trans Syst Man Cybern Part C 2000; 30:427-41. [6]. Ghaiwat Savita N,Arora Parul.Detection and classification of plant leaf disease using Image processing techniques: a review Int J Recent Adv Eng Technol 2014;2(3):2347-812.ISSN. [7]. L.Gurukumar,P.Sathyanarayanan, I.age
Texture Feature Extraction using GLCM Approach ,International Journal of Scientific and Res,5 Jan 2013.
[8]. Jianpeng Qi,Yanwei Yu,Lithong Wang.k means :An Effective and efficient k means clustering .2016 IEEE International Conferences on Big Data and Cloud Computing (BDCloud), Social Computing and Networking (SocialCom),
Sustainable Computingand
Communication(SustainCom) (BDCloud-SocialCom-SustainCom).
processing techniques Convergence of Technology,(12CT)2014.
[10]. Kumbhar Nithin P.Agricultural plant disease detection using Image processing .Int J.Adv Res Electr Electron Instrument Eng 2013.
[11]. Liu Xumin,Than Yong.Research on k means clustering Algorithm :An improved k-means clustering Algorithm; a review Int J Recent Adv Eng Technol 2010.
[12]. Maroune Ben Haj Ayech,Hamid Amiri.Texture Description using Stasitical Feature Extraction,Int Computer Science Telecommun 2016;3(6).
[13]. Ma Z Tavares,Image processing and analysis: application and trends AES-ATEMA'2010,Fifth International conference Canada,ISBN:978-0-9780479-7-9.
[14]. Mrunalini R Badnakhe,Deshmukh Prashant R.An application. Of K- means clustering and artificial in pattern recognition for crop disease .Int Find Adv INF Technology 2011;20.2011 IPCSIT.
[15]. Patil Sanjay B et AL.Leaf disease severity measurement using Image processing. Int J Eng Technol 2011;3(5):297-301.
[16]. Sachin D khirade.Plant Disease detection using Image processing:a review .Int J Recent Adv Eng Technol2015,ICCUBEA,27 Feb 2015. [17]. Sofine Mouine,Other Yahioui,Anne
Verroust-Blondet.Plant species recognition using spatial correlation between the leaf Margin and leaf salient points.,Int Agri. ICIP ,18 Sept 2013. [18]. Rathod Arti N,Tanawal Bhavesh,Shah
Vatsal.Image processing techniques for detection of leaf disease.Int J Adv Res Comput Sci Soft Eng 2013;3(11).
[19]. Woods Keri.Genetic algorithms: colour image segmentation literature review, 2007.