Developmental bioinformatics:
linking genetic data to virtual embryos
FONS J. VERBEEK
1*, KIRSTIE A. LAWSON
1and JONATHAN B.L. BARD
21Hubrecht Laboratory, Netherlands Institute for Developmental Biology, Utrecht, The Netherlands and 2Department of Biomedical Sciences, University of Edinburgh, Edinburgh, United Kingdom
ABSTRACT This paper discusses current efforts to produce databases of gene expression for the major model embryos used in developmental biology. The efforts to build these resources were motivated by the need for immediate internet access to all types of research data, and the production of these databases is a major and new challenge for bioinformatics. Thus far bioinformatics has mainly been concerned with textually oriented resources and data, much of it concerned with gene and protein sequences. Because the genetic basis of developmental biology is integrated with developmental anatomy, these databases require the use of images to link molecular data with spatial information. In order to standardise database formats, digital atlases of some model systems are being produced that include integrated anatomical descriptions and these are being linked to appropriate genetic data. Integrating such image-based, searchable data into databases makes new demands on the field of bioinformatics and we consider here the imaging modalities that are used to obtain information and we discuss in particular the production of 3D images from serial sections. Next, we consider how to integrate textual and spatial descriptions of gene expression and the key tool needed to make this possible, i.e. anatomical nomenclature. A short review of internet resources on developmental biology is also given and future prospects for the development of these databases are discussed.
KEY WORDS:
bioinformatics, image analysis, visualisation, gene-expression databases
0214-6282/99/$15.00 © UBC Press
Printed in Spain
www.ehu.es/ijdb
*Address for reprints: Hubrecht Laboratory, Netherlands Institute for Developmental Biology, Uppsalalaan 8, 3584 CT Utrecht, The Netherlands. FAX: +31 30 2516464. e-mail: [email protected]
Abbreviations used in this paper: CCD, charged coupled device; sfp, simulated
fluorescence process; sql, structured query language; clsm, confocal laser scanning microscopy; mrn, magnetic resonance microscopy.
Introduction
Bioinformatics is now established as the area of research and technology covering the development and applications of com-puter-based methods for the storage, access, analysis and inter-pretation of biomolecular data (DNA, RNA and protein) in the general context of understanding the molecular basis of living systems. In a sense, it is thus complimentary to the experimental side of molecular biology which focuses on elucidating the se-quence, structure and function of biomolecules, and on gene mapping (Robbins et al., 1995). On the other hand, bioinformatic techniques are also utilised for prediction and in that manner it is being integrated in experimental set up.
Developmental biology poses additional problems for bioinformatics, as the processes of embryogenesis involve both molecular and morphological data, usually at tissue level. Bioinformatics must therefore incorporate both if it is to be helpful in unravelling the genetic networks that underpin the mechanisms of the embryo, e.g. tissue differentiation and organogenesis.
These networks are typically studied through patterns of gene-expression in normal embryos and in the changes of normal morphology that result from spontaneous or targeted mutations. Developmental bioinformatics is thus concerned with providing a format for the computational integration of gene expression with developmental morphology in the widest sense; it thus goes beyond standard bioinformatics with its focus on databases and algorithms for storing and processing data structures (e.g. strings, trees and sequences).
such mixed data sets requires new tools based on image-analysis techniques, and the first part of this paper considers the main current modalities for importing and handling images containing morphological and gene-expression data. A key point to note here is that development is a spatio-temporal process. In order to describe this process, two dimensional (2D) images are inad-equate. For developmental purposes, three dimensional (3D) images (or volume images) which map embryo morphology, anatomical nomenclature and gene expression could, if correctly sampled, represent the spatial component. In order to be able to follow developmental processes over time, these volume images need to be integrated into four dimensions (4D). As the images are the basis for further processing, they of course need to be available in time-related digital representations. In order to be able to manage all these data, databases are required. Unfortu-nately, the complexity of developmental processes is reflected in the complexity and size of the databases needed, and this itself poses a challenge to bioinformatics.
The second part of this paper describes more standard bioinformatics as it considers the databases required for storing such morphological and gene-expression data and the tools for analysing them. The simplest of these databases are those that use textual descriptors as the basis for storing data, and the key language here is developmental anatomy as gene expression can often be tied to tissue names. In such cases, standard relational databases and extant tools can be used, and where this is possible, the bioinformatics is relatively straightforward. Far more complex, however, are databases where both tissue and gene-expression data are spatially mapped to 3D (volume) images of the embryo. Volume images consist of volume elements, also referred to as voxels, and a digital 3D map of the embryo thus consists of labelled voxel domains. Developmental bioinformatics deals with databases that store and handle such models. Here, the tools for inputting and accessing data are particularly com-plex; an advanced spatial query language is required and the commonly used query language (SQL, Rob and Coronel, 1993) needs to be extended for this purpose.
Such databases are particularly important as they can not only contain far more data than is possible in the standard literature, but also map gene expression data accurately to tissue domains
in a way that can be accessed and searched over the internet, i.e. using the appropriate digital representation. They will therefore represent a new generation of data resources and a new class of scientific literature; their proper management and indexing will be crucial for handling the complex combinatorial problems that need to be solved if we are to understand the cascades of genes that underpin embryogenesis. At this point, it is worth pointing out that databases linking gene expression to developmental anatomy are being initiated in a wide variety of model organisms with the text databases for the mouse, C. elegans, Drosophila and zebrafish already being accessible in part (see Table 1).
Spatial data in developmental biology
In developmental biology, images may be obtained in several ways, but are usually of:
- normal development
- gene expression and/or cell-lineage data
- abnormal development as a result of mutation or experimen-tal manipulation.
Although images can, in principle, be either 2D or 3D, the spatio-temporal organisation that characterises development really re-quires 3D data to do justice to the richness of the phenomena and the complexity of the data. Nevertheless, 2D images, the most commonly used images, are of course far easier to obtain than 3D ones. Nowadays, a variety of CCD cameras is used to obtain digital (colour) images of histological sections or whole-mount prepara-tions of for example, a 2D pattern of gene expression. Digitising images is helpful in archiving and selecting of experimental data but in terms of resolution can not yet compete with photographic techniques.
A sense of 3D organisation may of course be obtained through 2D imaging, and an example is a whole-mount in situ hybridisation pattern where a (digital) snapshot of the complete, stained em-bryo is taken. Here, of course, the translucency of the emem-bryo allows internal detail of the expression pattern to be visualised, but, as this translucency tends to be only partial, spatial informa-tion about the interior is normally at quite low quality, or, in the
TABLE 1
INTERNET ADDRESSES FOR DEVELOPMENTAL DATABASES DEALING WITH GENE EXPRESSION AND ANATOMY
URL
www.sanger.ac.uk/Software/Acedb/ watson.genes.nig.ac.jp:8080/db/readme pbio07.uni-muenster.de
zfishstix.cs.uoregon.edu www.informatics.jax.org/gxd genex.hgu.mrc.ac.uk
www.ana.ed.ac.uk/anatomy/database honeybee.helsinki.fi/toothexp/toothexp www.ana.ed.ac.uk/anatomy/database/humat rprcsgi.rprc.washington.edu/neuronames tbase.jax.org
vize222.zo.utexas.edu
www.proteome.com/YPDhome
Name
A C. elegans DataBase (ACEDB) (Martinelli et al., 1997) The Nematode Expression Pattern DataBase
Flyview (Janning, 1997)
The zebrafish database (ZFIN) (Westerfield et al., 1997) Mouse text gene-expression database (GXD/MGI)
Mouse graphical gene-expression database (GGED + DMDA) Kidney and ducted-gland gene-expression databases The tooth database
Human anatomy database Atlas of primate brain
worst case, even partially occluded thereby hiding essential information. In order to ob-tain high quality spatial information, we there-fore need direct access to the interior of the embryo by either invasive or non-invasive sectioning.
At this point it is clear that, if we are to obtain true 3D spatial data from embryos, we need to sample the embryos into (prefer-ably) equidistant units, i.e. sections. The device used to sample the specimen estab-lishes a direction of sectioning and, for the third dimension to be optimally probed, the best possible resolution is needed in this direction. There are three main 3D imaging modalities that can be applied to embryos:
- serial sectioning (Gaunt and Gaunt, 1978)
- confocal laser scanning microscopy (CLSM), and
- magnetic resonance microscopy (MRM)
It should be noted that the latter two intrinsically generate digital data in volumet-ric (voxel) format. To obtain a 3D image from
the way in which the data can later be used: a well sampled and aligned 3D image block enables the data to be inspected in an orientation that is independent of the direction of sectioning. Figure 2 illustrates how new “virtual” sections can be generated from such data. The density images may be the basis for produc-ing 3D models from such data and one does not necessarily have to adhere to the original sampling in the image. In practice this means, as most often the anisotropy is in the direction of section-ing, the resolution of the image (the xy-plane) is downscaled so as to make it correspond to section thickness and all voxels are thus cubic. It is normally adequate for the viewer if histological data are shown at a voxel dimension of 7µm3 (referring to typical section
thickness); however, if cell boundaries need be visible, a voxel dimension of about 2 µm3 is required. Another way to solve this
problem would be to place between two consecutive sections additional computed section images that are obtained by interpo-lation. This does not however improve the resolution.
3D images from serial sections
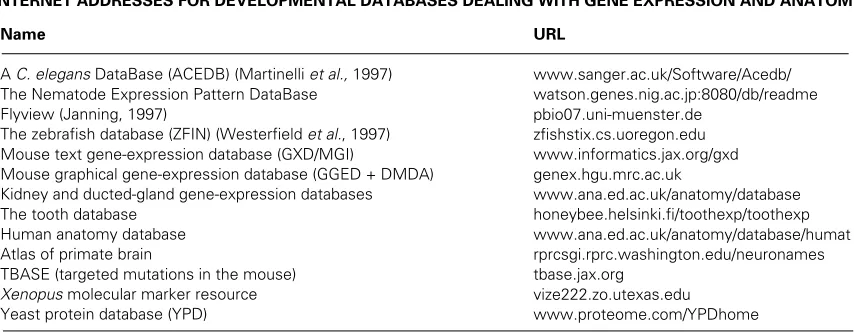
This is the best known way of obtaining 3D data about embryonic structure and 3D reconstructions have been made from serial sections for the best part of a century, with such reconstructions being used to display the internal anatomy of a wide range of embryos. The use of computer and image-processing techniques has greatly increased the ways of gen-erating 3D reconstructions from serial sections. In the past, numerous techniques were used to obtain 3D information of microscopical objects (Gaunt and Gaunt, 1978) and to make static 3D models. A good example was found in the historic collection of the Hubrecht Laboratory (Fig. 1). This 3D model renders bright field microscopy as well as general shape infor-mation of the embryo: it allows section images to be browsed Fig. 1. Historic use of 3D reconstruction to a (static) volume model. (A) 3D reconstruction of a pig embryo (10 mm stage) using cardboard to simulate section thickness. Photographs were glued on the cardboard and then the outer shape was “segmented out” by fretwork. In this manner, next to a 3D view of the sections, the outer shape of the embryo could be rendered. (B)
Same as (A) but now the browsing is illustrated.
sectioned material, several techniques can be applied:
- photograph the material onto film, then digitise these images using a scanner (Nievelstein et al., 1998),
- directly digitise sections to give pixel data by using a CCD camera (Verwey, 1993; Verbeek, 1995, 1996, 1999; Kaufman, et al., 1996; Baldock et al., 1997), or
- obtain contour data of material using a camera lucida set-up (Thomson et al., 1994; Wagenaar et al., 1994; Roshani et al., 1996; Griffini et al., 1997).
As all bioinformatics techniques used [(i.e. data-management and (image) processing)] assume digital format, it is important that the images are well sampled; indeed, it is really only possible to mesh genetic and morphological data computationally if both are stored in databases.
It should be noted that there are pitfalls associated with digital imaging that do not arise with normal images and the key one is that the image is discretely sampled at relatively low resolution as compared to photograph images and this results in a loss of information. If one adheres to rules for sampling (Young, 1996), it is relatively easy to obtain high-resolution images in the plane of sectioning (XY-plane), but harder to achieve the same resolu-tion along the z-axis, even though such sampling should in principle be isotropic. For the case of serial sectioning, in particu-lar, section images obtained from a CCD camera mounted on a microscope are always sampled at a finer resolution than the section thickness.
The imaging modalities described here have in common that they require that the plane of sampling for each section be plan parallel to the preceding samples (slices or sections). This sam-pling constraint, i.e. a priori knowledge, is actually important for
and it displays the general characteristic of computer-assisted 3D reconstruction of section simulations, in this particular case by cardboard. Nowadays, digital images are used to simulate sections [referred to as section images (Verbeek, 1995, 1999)] and, of course, simulation possibilities are greatly expanded through the use of digital image processing techniques, com-puter graphics and systems for image archiving.
Nevertheless, 3D reconstruction from serial sections is still of key importance as developmental anatomy is best viewed using standard histological staining and bright field micros-copy. If we are interested in gene expression in relation to the anatomy, invasive sectioning still offers major advantages and is, in principle at least, relatively simple: serial sections are made, stained, (photographed) and digitised; a 3D image is then obtained from the section images using the following sequence of events:
- acquire images with a CCD camera attached to the mi-croscope in the exact sequence of the serial sections - apply a registration procedure on the subsequent images:
alignment
- compile the registered section images in a 3D image: the volume image
- use the volume image in subsequent processing steps, e.g. feature extraction and/or delineation of anatomical struc-tures.
This sequence of procedures can be summarised as 3D-reconstruction technology and various strategies can be applied (Baldock, et al., 1997; Verbeek, 1999) to generate accurate 3D images (reconstruction). In Figure 2 a volume image consisting of section images is depicted.
This is not, however, an easy process and good registration of section images is required if distortions are to be eliminated, or at least minimised. Appropriate use of the microscope and imaging hardware is of key importance here if later processing is to be kept to the minimum. Two techniques (Verbeek, 1992, 1995, 1996, 1999) are worth mentioning here:
- In making the images, a two-step approach can be used: first, coarsely register successive section images at acqui-sition by real time subtraction and interactively looking for minimal differences. Then, apply a fine-tuning based on cross correlation. This two step technique minimises posi-tional and orientation differences between section images. An example of the application of this technique is shown in Figure 3 (Hibbard and Hawkins, 1988; Verbeek, 1996, 1999; Baldock, et al., 1997).
- To minimise the effect of sectioning artefacts, there are considerable advantages in imaging the face of the block before each section is cut, as this provides an undistorted reference image as a standard for deformation correction (Verbeek, 1992, 1995, 1999).
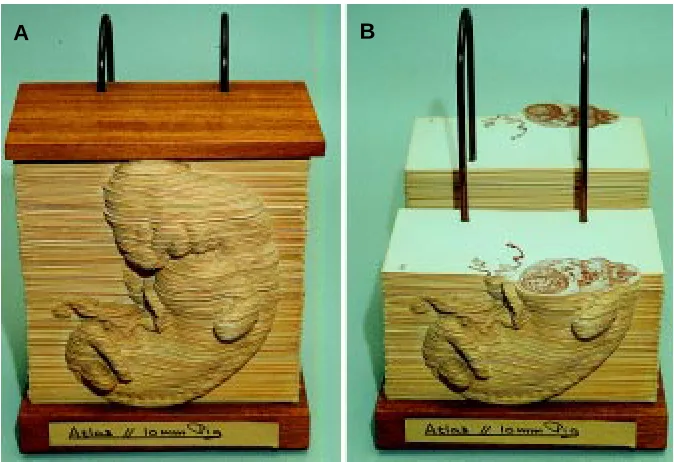
Fig. 2. Illustration of virtual sections out of a volume image. (A) 3D reconstructed volume image of the head region of a Long-pec stage zebrafish embryo (48 h pf.). It is clear that a segmentation procedure is required to get more information out of this volume (c.f. Fig. 4A,B,D). The upper slice is the original plane of section-ing. On the bottom of the block the jelly is seen. The volume block is reconstructed from 125 section (4 µm thickness) using section images of 512x512 (8bit) pixels recorded with a Sony XC-77 video camera. This sums up to a volume of 32Mb. (B) Lateral cut-away view of the vol-ume image. The eye region with the lens and forebrain structures are readily distinguished. A separated lateral view would be referred to as a virtual section. (C) The quality and possibilities of the volume images could be further explored cutting out voxels in the direction of sectioning as well as from the lateral direction. (D) This picture depicts the application of an oblique cutting plane. Rendering information that was lost by the sectioning process but (partly) re-stored by the reconstruction process enabling some understanding of the connectivity of the anatomical domains (cf. Fig. 4). This view de-picts fore and midbrain as well as the eye.
A
B
In both cases, the process is laborious and good data-management needs be part of the acquisition and registration procedures to keep track of all image processing.
Deformation of serial sections remains a serious problem for 3D reconstruction, espe-cially when wax sections are used. Application of technique #2 (see above) does however enable the deformation problem to be minimised and a true 3D reconstruction produced. An aligned stack could also be submitted to a deformation correction procedure but, as the general form of the embryo is determined on aesthetic grounds, the reconstruction is less accurate than had such correction not been necessary. Nevertheless, such an approach has been successfully applied to mouse em-bryos (Guest and Baldock, 1995).
Digital removal of distortions is also referred to as digital warping. It includes registration, which is a rigid transformation, and deformation correction. The technique #2 is elegant in that it combines registration and deformation correc-tion by using an absolute reference image (Verbeek, 1995, 1999; Baldock, et al., 1997). Other reconstruction methods use landmark points to compute a registration and/or defor-mation correction (McLean and Prothero, 1987; Brändle, 1989; Deverell and Whimster, 1989; Bron and Gremillet, 1992; Moss, 1992; Olivo et al., 1993) or use images in a way comparable to technique #1 (Rydmark et al., 1992; Skoglund et al., 1993).
Confocal laser scanning microscopy
For all the advantages of serial sectioning, the procedures are slow and complicated, re-quiring complex image processing to remove the inevitable distortions. Non-invasive sec-tioning not only has the key advantage that the sampling does not add geometric distortion to
For standard applications, the net result is that high-resolution confocal images are unlikely to be more than 100 µm in thickness, although they can readily include three or even more molecular markers, at least one of which can be used to highlight anatomical features such as nuclei or basal laminae. CLSM is thus particu-larly suitable for the study of smaller embryos, or parts of larger ones. Figure 4 shows an example of an “in toto” visualisation of an expression pattern (at the level of the gene product) in a zebrafish embryo.
A further advantage of confocal microscopy is that, where the fluorescent probe is or can be made part of the cellular repertoire, living tissue can be studied in vivo and 4D image sets can be generated in which cell and tissue morphogenesis can be studied; the classic example here is green fluorescent protein (GFP). The sheer size of these datasets does pose intriguing and unsolved computational problems as to how to analyse them and incorpo-rate their key features in databases.
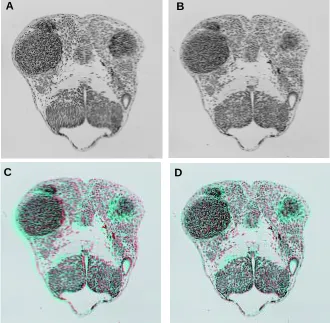
Fig. 3. Example of the registration of section images. These section images are the precursor images of the volume block depicted in Figure 2. (A) This section image is used as a reference for the section images in depicted in (B). (B) A slight positional and orientation difference exists between subsequent section images (A) and (B). (C) Here the real time subtraction is illustrated using a red and cyan Look-Up-Table (LUT) for section images in (A) and (B) respectively. Coincidence would render as grey. The images are not fully coinciding and thus misregistration shows as a cyan colour. (D) Here the images of (A) and (B) are registered; first coarsely and then by application of cross-correlation (Verbeek, 1999). Subsequent images can, of course, not be fully coincident, but it is seen by the amount of grey that good registration is realised.
the images of the specimen, but is fast, yielding direct digital data. As with all types of 3D images the data can easily amount to gigabytes from one single specimen.
The most common such technique is CLSM that combines the advantages of fluorescence microscopy (molecular marking on a dark background) with the optical sectioning that results from the pinhole optics of the laser microscope. The net result is that accurate optical sections can be produced by changing focal plane through the specimen. Such sections can be captured with a regular spacing of the order of tenths of micron and, in this way, a volumetric image is made. Although theory predicts that the images should be in sharp focus, out-of-focus material can contribute to the optical section and cause blurring, although this can be minimised using deconvolution techniques. It should however be pointed out that, the denser the tissue and the more concentrated the fluorescent markers, the more scattering and quenching phenomena make it hard to obtain good quality images from within the tissue.
A
B
Magnetic resonance microscopy
Recent developments in magnetic resonance imaging, i.e. magnetic resonance microscopy (MRM), have resulted in an increase in z-resolution of MR-scanners so that small vertebrate embryo’s could be visualised (Kriete and Pepping, 1992; Jacobs and Fraser, 1994; Smith, 1999). MRM uses radio frequencies to excite and detect (the spin of) hydrogen atoms in water. The z-resolution of MRM depends on the strength of the magnet. Currently, a magnitude of the z-resolution is in the order of tens of micrometers, although this may be improved soon; nevertheless, physical and practical limitations on dealing with powerful mag-nets restrict routine application of MRM with high z-resolution.
MRM is suitable for rendering the texture of different tissues in a specimen where the water content of the tissues differs. For location of gene expression, a molecular marker is required which makes the application of MRM less obvious. The technique has been used in in vivo cell lineage tracing experiments (Jacobs and Fraser, 1994). As MRM is particularly suitable for visualising bone structures, successful application has been achieved with older and larger embryos (Kriete and Pepping, 1992; Smith, 1999). Using MRM and CLSM for in vivo experiments with a time-axis rendered as a fourth dimension resulting in 4D images is also referred to as 4D imaging or time-resolved microscopy.
From 3D density data to 3D models: segmentation
All three imaging modalities result in a stack of images in which each voxel represents a density. It is however important to emphasise that density has a different meaning for each of the modalities, and additional processing is needed as in most cases the “computer” cannot distinguish one tissue from another, as there are no segment boundaries between them. For example, in bright field (H&E stained) section images, the heart can be seen easily but there is no single criterion by which the heart tissues can
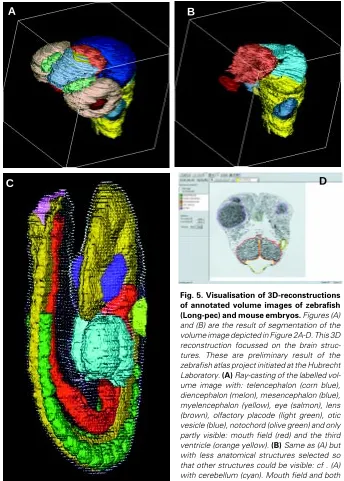
be automatically identified. Each imaging modality requires a different segmentation procedure that is depending on the nature of the contrast that is added in the preparation of the specimen. CLSM and MRM use specific contrast to visualise anatomical parts while, in bright field microscopy, a generic tissue staining is used and, to that end, histological data need to be delineated by experts using dedicated software (Fig. 5D). To go from density data to a 3D model containing all embryo anatomy, each tissue domain needs to be recognised either automatically or by using an interactive method, and these segmentation procedures need to be applied in 3D, i.e. throughout the entire image stack. For the reconstruction of anatomical data, serial sections are usually used and these are the basis for digital atlases in which the boundaries of each tissue domain is segmented, a slow process requiring meticulous attention to detail. In Figure 5A-C, 3D ren-derings (Keller and Keller, 1993) of the zebrafish and the mouse embryo are depicted. The delineation procedure can, of course, be partially automated by utilising standard segmentation tech-niques like thresholding, region growing and dynamic program-ming (Gonzalez and Woods, 1992; Russ, 1995), although these procedures give boundaries, each of them still needs to be attributed to an anatomical structure. Building an atlas does assume that we have a complete volume description of the anatomy of the tissue, and this aspect is discussed in the next section.
Storing images and image-based data in databases
Efficient use of images in a database containing resources for developmental biology is best dealt with by linking data items in the database that may need to be retrieved and/or searched. An image is of itself not a sensible item to store in a database other than as a simple data item. This is because it cannot be properly stored unless it can be archived under some search term, for only then can it be directly searched. The potential of images in developmental databases will only be achieved if they can be used for storing data items and are themselves searchable and, as far as anatomy is concerned, these items are known in advance. Although complex, it is a challenge to achieve this and a start is only now being made along these lines.
A “cheap” alternative, however, is to use image items as the searchable terms and, for development, the obvious choice here is anatomical nomenclature. It is quite possible, though not particularly easy, to list all the tissues present in embryos at any stage and so provide a simplified mapping of the complete embryo from a voxel model to a word list. Two things are lost in this simplification: the sense of geography which shows the spatial links between tissues, and the ability to subdivide tissues to a resolution finer than that provided by anatomical nomenclature. This latter point is particularly important as the expression do-mains of what are probably key genes in laying down in early embryos will, by definition, only be part of existing tissues.
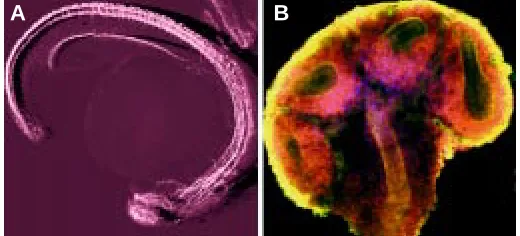
Several graphical representations for digital models of embryos can be used (Verbeek et al., 1993; Verbeek and Huijsmans, 1998). Here, we only use the volume enumeration model (voxel model) as this is closest to our input model. If we want to extract information from our voxel model, there are two ways to do so, sectioning and by the anatomical components. The first refers to the physical sampling, whereas the second refers to an arbitrary biological Fig. 4. Examples of visualisation and (complex) patterns of gene
expression using confocal image data. (A) 3D visualisation of a low magnification 3D image of a prim 5 zebrafish embryo (24 h pf). stained with an antibody raised against acetylated tubulin, a structural protein of the nerve system. The layout of the developing nerve system is nicely illustrated with this technique. For visualisation the sfp algorithm was utilised. The data were kindly donated for visualisation by A. van der Sar.
(B) A high magnification (100x), single slice, confocal image of an E12.5 mouse kidney stained for NCAM (red), laminin (green) and nuclei (blue). This early kidney has only two named anatomical components: the ureteric duct which has bifurcated twice to form the early collecting ducts, and the metanephric mesenchyme (MM) surrounding it. That part of the MM that stains for NCAM can form nephrons, the unstained part will become the stromal cellls of the kidney.
sampling, that of the expert anatomist. The ana-tomical components are referred to as domains or structures and we now consider them.
The use of anatomical nomenclature
Because of the difficulty of incorporating voxel images as the storage format for a multi-media database, anatomy does hold consider-able advantages as a database terminology, with the tissue names providing the nomencla-ture for inputting, storing and searching for any data item that is naturally linked to tissue name. The production of such an anatomical listing is thus a requirement for a developmen-tal database.
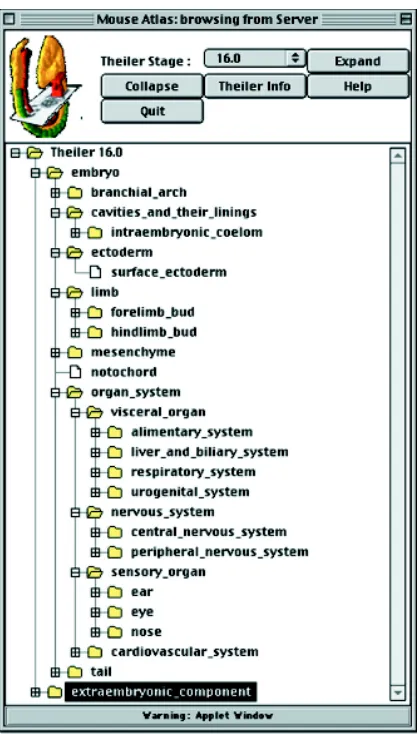
It is worth noting that the mouse embryo, once it starts to generate recognisable anatomy, has many hundreds of named tis-sues (Kaufman and Bard, 1999), far too many to handle as a simple list. The preparation of a nomenclature that would be useful within a database structure thus involves the linking of the anatomical terms in a hierarchy that meshes intuitively with the needs of the user who will want to store the data or search for it. It turns out that a sensible way to proceed here is to use a mixture of functional systems (e.g. re-productive system) and anatomical terms (e.g. peripheral nervous system) as the main pegs off which to hang the smaller items (Fig. 6). It is of course necessary to produce such a hierarchy for each developmental stage, and these hierarchies increase dramatically in size as the embryo ages.
The total number of names in the full mouse anatomy list is about 8000, although many of these differ only by developmental stage (Bard et al., 1998): the humerus bone, for example, is present from about TS20 onwards and the nomenclature thus has separate names for TS21, -22, -23 etc. This point is important as a particular pattern of gene expression in the humerus may start or end at any stage and the database has to be able to cope with this. The complete nomenclature thus provides a lan-guage for inputting, storing and querying data at any developmental stage, and is thus a key part of any textual database for storing any data items that can be linked to tissue names. Mouse and human developmental anatomy hierarchies are now available (Fig. 6; Table 1), while those for the zebrafish and C. elegans are currently being produced; in addition, a
Graphical mapping of data
Nevertheless, in spite of the simplicity of using anatomical nomenclature for modelling voxel models of embryos, it is a poor substitute for a graphical representation: the lack of spatial mapping restricts the use to which the database can be put and, for example, renders it incapable of answering queries about the spatial relationship between signals and receptors in any helpful Fig. 5. Visualisation of 3D-reconstructions of annotated volume images of zebrafish (Long-pec) and mouse embryos. Figures (A) and (B) are the result of segmentation of the volume image depicted in Figure 2A-D. This 3D reconstruction focussed on the brain struc-tures. These are preliminary result of the zebrafish atlas project initiated at the Hubrecht Laboratory. (A) Ray-casting of the labelled vol-ume image with: telencephalon (corn blue), diencephalon (melon), mesencephalon (blue), myelencephalon (yellow), eye (salmon), lens (brown), olfactory placode (light green), otic vesicle (blue), notochord (olive green) and only partly visible: mouth field (red) and the third ventricle (orange yellow). (B) Same as (A) but with less anatomical structures selected so that other structures could be visible: cf . (A) with cerebellum (cyan). Mouth field and both otic vesicles are now visible. (C) Surface-ren-dered view of the reconstruction of the TS14 (E9) mouse embryo with the ectoderm made translucent to show some key tissues that have been delineated. The neural tube (yellow), gut (red), heart (light blue), somites (green), optic vesicles (dark blue), otic pit (lime green) and primitive streak (mauve). The key feature of this model is that data of any spatial nature can be assigned to individual voxels. The image was donated with courtesy of R. Brune, D. Davidson and R. Baldock. (D) Interface of an MS-Windows program for delineation of anatomical domains/ structures (Verbeek et al., 1995). Here the same section image as Figure 3A is depicted, with the contours used for the rendering in (A) and (B) indicated.
complete terminology exists for Drosophila, albeit that a hierarchy is not yet in place (see websites detailed in Table 1). It is also worth pointing out that, if the major terms in the hierarchy are the same for each species, and this will certainly be acceptable for func-tional systems, it becomes possible to use common terms for database searching, and thus move, in principle at least, from one species to another in a seamless way.
A
B
way. It is thus clear that the full potential of spatial data can only be realised in a database that maps the data directly to embryonic space. It is thus important to see what this additional step means in practice.
It is quite possible, using the techniques described above, to produce a voxel model of an embryo from serial sections and this can be embedded within a database. Once there, and with appropriate software, each voxel can be used as a storage-”bin” for data. Unfortunately, individual voxels have, of themselves, little meaning to an embryologist, and have to be tied to tissue geometry; hence the importance of the tissue segmentation process described above. Once each voxel in the embryo is associated with a tissue domain, however, then the full benefits of the graphical representation of data within an appropriate data-base become available. A user could, for example, locate any domain within a tissue and use it for data input or as the basis of a query to the database that could be along the following lines: “detail any signal receptors expressed within 200 µm of this voxel that can accept the signal from genes expressed within the highlighted domain”.
This sophistication is not, however, easy to achieve and it is as well to be aware of just how hard it is to integrate such a graphical framework within a database and the types of problem that arise in doing so. The most obvious of these problems are concerned with the informatics and database side of the work. The database chosen has to be able to handle a graphical representation, much of the input and searching routines as well as the graphical interfaces have to be programmed de novo. In addition, tech-niques have to be devised to make it relatively easy for experi-mentalists to transfer graphical data to the database over the internet. There are also problems with the “bio” side of the bioinformatics:
- the image segmentation process requires the 3D image be of high quality (perfect alignment) and it is very hard to produce perfect serial sections
- it is hard to determine all the tissue boundaries precisely - for practical reasons, there can only be a single reference
embryo in the database for each developmental stage and it has to be assumed that it is representative of that stage.
This last point poses problems: although care can be taken to check that the embryo is normal in that its structure meshes with that expected, it can, by definition, only describe a single time point within that stage and, for example, tissues that form late or are lost early in the stage will not be included in a mid-stage standard. Variation, of course, differs across the model systems and is larger in mouse than in zebrafish. Embryos of the zebrafish are also easier to obtain so that more 3D images can be produced allowing introducing variation as a feature of the atlas.
None of these problems, except the last, is insuperable, and even this timing problem turns out to affect only a very small proportion of the tissues at any stage. Indeed, such databases are currently being constructed for the mouse and zebrafish embryo. The mouse embryo atlas database is in progress and to data the zebrafish atlas is initiated and both are considered further below.
Developmental databases of gene expression
Although databases can store very large amounts of informa-tion, the key to their successful use is the existence of appropriate semantic frameworks for inputting, storing and querying their data (e.g. for genome databases, the key data are the name, genomic location and sequence). Similarly, the scientific literature data-bases contains entries stored under a series of attributes (e.g. author, journal, title, etc.) that can be searched separately or together to retrieve those papers that match the search terms. Image data can also be stored and retrieved if it is archived within an appropriate semantic framework, but there are as yet no standard mechanisms for comparing images or indeed for match-ing the information within them.
Gene expression data do not exactly match any of these examples as it requires both text and graphical data, and have four obvious properties, gene name (and associated details), tissue(s) in which the gene is expressed and spatial location (with tissue names being derived from the spatial location), while expression is of course limited to a temporal window. A gene-expression database should ideally provide comparisons of spa-tial regions and patterns, and this implies that data must be mapped into a common spatial and temporal framework. Fig. 6. Interface of the mouse developmental anatomy browser. The
The simple way to do this, as has already been discussed, is to use text terms to link anatomical and genetic data (e.g. via anatomical names and developmental stages), but such a data-base has limitations. A more general solution is to map gene-expression data onto 3D voxel models of embryos spatially. In such a graphical database, spatial comparisons and relationships become straightforward and clear.
An ideal gene-expression database should have several prop-erties. First, it should be searchable both spatially and textually (e.g. tissue, gene name, and 3D location as well as developmen-tal time), second, it should be comprehensive; third it must be accessible over the Internet and, fourth, it should be easy to use. An additional, subtler criterion is that it be interoperable with other bioinformatics resources. Indeed, if information on a gene is available in one data resource we want to learn about the other models system completing the picture.
Although spatial mapping is far more difficult than text map-ping, it is needed when gene-expression domains do not map to tissue boundaries. An example of this sort of problem in demon-strated by the early pattern of NCAM expression in the developing mouse kidney (Fig. 4B). In this confocal image, the second bifurcations of the ureteric bud can be seen extending into the metanephric mesenchyme (for review, see Davies and Bard, 1998). NCAM (red immunostaining in Fig. 4B) is restricted to domains about 5 cells deep that surrounds the duct tips, and these domains do not, of course,map to any named anatomical tissues. If they are to be included in a database, it can only be through spatial mapping.
Text databases
It should be emphasised that nothing yet meets all these criteria, and the only comprehensive gene-expression databases currently available seem to be those for kidneys, ducted glands, and teeth in the developing mouse (Davies et al., 1997; Table 1). While these are readily accessible and have some elegant search tools, their use is likely to be limited to a rather specialist commu-nity, who are, of course, fortunate to have such resources.
The major gene expression resource currently being produced is GXD, the mouse gene expression database (Table 1). A group at the Jackson Laboratory (Maine, USA) is compiling this rela-tional database (Rob and Coronel, 1993) that links all published gene expression data, both mRNA and protein, for mouse em-bryogenesis with the mouse developmental anatomy hierarchy discussed above (Ringwald et al., 1994). It also includes image data as associated pictures (these are not searchable), some EST data and notes on the probes used. It will, in due course be linked to the microarray data resources now being planned.
GXD is searchable under a wide range of categories that include the complete gene expression literature, gene name, cDNA and protein expression within tissues and some other categories. In addition, the Jackson Laboratory hosts Tbase (Table 1), the database of targeted mutations. A user can thus look for genes expressed in a tissue and then inspect whether mutations in that gene generate phenotypes that give some insight into gene function. In short, GXD is going to be an invaluable bioinformatics resource for developmental biologists interested in investigating the genetic networks responsible for mouse development, and also medical researchers who work on mouse models of human diseases.
For zebrafish, the zebrafish information network (ZFIN, Westerfield et al., 1997) has recently become available to the community. This resource contains a wealth of information on mutations and the mapping thereof on the genome. Similar to the merge of the mouse atlas and GXD, 3D atlas data will be merged with the ZFIN resource in the future.
Further textual databases are now being considered (often as extensions of existing databases, see Table 1) for all the main developmental organisms and should become available over the next few years; a human database is also being planned, while information on many housekeeping genes is documented in the yeast protein database.
Graphical databases
The Mouse Graphical Gene Expression Database (GGED, Davidson et al., 1997; Table 1) system is currently being imple-mented by a group at the MRC Human Genetics Unit in Edinburgh. Its construction is a major task and thus far the infrastructure for the object-oriented database (Rob and Coronel, 1993), the ana-tomical nomenclature and some of the 3D-reconstructions are in place. The GGED is currently the most elaborate graphical database of a model developmental system.
Production of an atlas for zebrafish development has been started at the Hubrecht Laboratory. To date, the development of this resource focuses on the head region of the embryonic stages of the zebrafish. Extensions to larval stages (Kimmel et al., 1995) and the whole embryo body are planned for the near future.
Because volume images (and annotated 3D-reconstruc-tions) are too large to be handled easily over Internet, the intention is to split the database into two parts, one held locally by users and the other remotely. All of the 3D-reconstructions, together with the anatomical details, the necessary software for producing sections of arbitrary orientation (to match those of the user) and the internet protocols for sending data and handling queries will be distributed by CD-ROM or as a one-off download from the database site. The mouse data and the database itself will be kept at the host site, and will be linked via the common anatomical hierarchy to GXD at the Jackson Laboratory. Once the 3D atlas data for zebrafish becomes available, a link will be provided via the ZFIN resource at the institute of Neuroscience in Oregon, Eugene.
Discussion
The essential point made by this paper is that developmental bioinformatics, the meshing of standard bioinformatics techniques with image data or its textual representations has an important contribution to make to elucidating the molecular basis of embryo-genesis. It can immediately be seen that, if gene-expression and other such data is stored in a format that is immediately searchable by developmental time and tissue name, then it becomes possible to group genes that are likely members of networks, look for signal-receptor relationships and highlight candidate genes for congenital abnormalities. It is currently hard, if not impossible, to do any of these tasks on the basis of the current gene and literature data-bases, simply because the data is inadequately archived.
The great advantages that such developmental databases will bring do of course come at a price: considerable effort and financial commitment are required to program the databases, fill them with data and construct the user interfaces. In some sense, the second of these is the hardest as it is an ongoing task, while the other two only need to be done once. Given the large amount of expression data and the unwillingness of journals to accept full expression details, it is unrealistic to expect that editors will be able to do this task properly, and it will inevitably fall on the user to do this work. A carrot and a stick may be helpful here: the stick may come from journal editors if they insist that expression data, like sequence data, must be submitted to the database if the work is to be published. More encouraging is the carrot that will come from the database itself: the GXD team is currently developing an electronic notebook in which users can store their own data within an anatomical hierarchy, and analyse it in private. Once the material is ready for publication, the notebook can be emailed to GXD for entry into the public database. In the longer term, a similar facility should be available for graphical databases. A similar electronic notebook is implemented in the ZFIN database allowing research-ers to share and discuss data before they are made public. In this manner, information exchange and collaborations are supported with database tools.
Here, it is also important to mention some of the additional advantages that will come from developmental bioinformatics once gene expression databases are in place for several organisms. Because genetic networks are conserved to a considerable extent across the phyla, information from one model embryo is likely to be helpful in understanding another. It will therefore be important to develop the computational tools that will allow users of one database to mine the data in another (Bard, 1997, 1999).
In the first instance, this is likely to be done manually, using specialised search tools. In the longer term, however, we can hope that standard database interfaces (e.g. CORBA, Vinovski, 1997) will enable a user to mine data from across all developmental databases in a transparent way. In the shorter term, such interoperability will be available in textual databases, but, in the longer term, there is no reason in principle why graphical data-bases should not also be interoperable in this way.
There are two key difficulties in producing digital atlases. The first lies in making the 3D reconstructions from serially sectioned embryos, reducing the distortions that arise in tissue preparation and segmenting them to make the tissue domains recognisable. The solution here would be to have a standardised system based on standard histology and light microscopy that would facilitate the
production of reconstructions (Verbeek, 1995, 1999; Verbeek et al., 1995; Baldock, et al., 1997). At the Hubrecht Laboratory, generic software for 3D reconstruction is currently being devel-oped (cf. Fig. 5D). The second problem is that of mapping expres-sion data to these reconstructions, and this can be done by delineating expression domains in digital section images gener-ated from the reconstructions, by tissue naming, or automatically via mapping of microscope image domains onto digital ones.
But these are problems for the longer term. Such is the current progress that developmental biologists can soon expect the core databases of their model systems to contain not only the gene, mutation, developmental anatomy, phenotype and literature data, but also large amounts of gene expression data. This advance combined with the easy internet access to these databases and the availability of data mining tools will allow the integration of all this hard-won experimental data to provide an understanding of how genetic networks create embryo structure.
Acknowledgements
Much of the work discussed here is based on discussions with col-leagues from across Europe and the USA that have emerged from meetings held as a result of networks funded by the European Science Foundation (ESF), the Wellcome Trust and Nato Collaborative Research Grant Programme. At this point, we would like to express our gratitude both to the scientists who participated in these networks as well as the grant organisations; in particular, Drs. Duncan Davidson and Richard Baldock of the Mouse Atlas project at the MRC Human Genetics Unit in Edinburgh and to Drs. Monte Westerfield and Eck Doerry of the ZFIN project at the Neuroscience Institute in Eugene, Oregon.
References
BALDOCK, R.A., VERBEEK, F.J. and VONESH, J-L. (1997). 3D reconstructions for graphical databases of gene-expression. Semin. Cell Dev. Biol. 8: 499-507.
BARD, J.B.L. (1997). Making and filling gene-expression developmental databases. Semin. Cell Dev. Biol. 8: 455-458.
BARD, J.B.L. (1999). A bioinformatics approach to investigating developmental pathways in kidney and other tissues. Int. J. Dev. Biol. 43: 397-403.
BARD, J.B.L., KAUFMAN, M.A., DUBREUIL, C., BRUNE, R.M., BURGER, A,. BALDOCK, R.A. and DAVIDSON, D.A. (1998). An internet-accessible database of mouse developmental anatomy based on a systematic nomenclature. Mech. Dev. 74: 111-120.
BRÄNDLE, K. (1989). A new method for aligning histological serial sections for three-dimensional reconstruction. Comput. Biomed. Res. 22: 52-62.
BRON, C. and GREMILLET, P. (1992). 3D reconstruction by image-processing of serial section in electron microscopy. In Visualisation in biomedical microscopies, 3D imaging and computer applications (Ed. A. Kriete) VCH Verlagsgesellschaft, Weinheim. pp. 75-104.
DAVIDSON, D., BARD, J., BRUNE, R., BURGER, A., DUBREUIL, C., HILL, W., KAUFMAN, M., QUINN, J., STARK, M. and BALDOCK, R.A. (1997). The Mouse Atlas Graphical Gene-Expression Database. Semin. Cell Dev. Biol. 8: 509-517
DAVIES, J.A. and BARD, J.B.L. (1998). The development of the kidney. Curr. Top. Dev. Biol. 39: 245-301.
DAVIES, J.A., BRANDLI, A.W., HUNTER, D. and NIEMINEN, P. (1997). Design considerations for small, special-system developmental databases. Semin. Cell Dev. Biol. 8: 519-525.
DEVERELL, M.H. and WHIMSTER, W.F. (1989). A method of image registration for three-dimensional reconstruction of microscopic structures using an IBAS 2000 image analysis system. Pathol. Res. Pract. 185: 602-605.
GAUNT, W.A. and GAUNT, P.N. (1978). Three dimensional reconstruction in biology. Pitman Medical Publishing Co. Ltd, Tunbridge Wells.
GRIFFINI, P., SMORENBURG, S.M., VERBEEK, F.J. and VAN NOORDEN, C.J.F. (1997). Three-Dimensional reconstruction of colon carcinoma metastasis in Liver. J. Microsc. 169: 375-382.
GUEST, E. and BALDOCK, R.A. (1995). Automatic reconstruction of serial sections using the finite element method. BioImaging 3: 154-167.
HIBBARD, L.S. and HAWKINS, R.A. (1988). Objective image alignment for three dimensional reconstruction of digital autoradiograms. J. Neurosci. Methods 26: 55-74.
JACOBS, R.E. and FRASER, S.E. (1994). Magnetic resonance microscopy of embry-onic cell-lineages. Science 263: 681-684.
JANNING, W. (1997). FlyView, a Drosophila image database, and other Drosophila databases. Semin. Cell Dev. Biol. 8: 469-475.
KAUFMAN, M.H. and BARD, J.B.L. (1999). The anatomical basis of mouse develop-ment. Academic Press, San Diego, USA.
KAUFMAN, M.H., BRUNE, R.M., BALDOCK, R.A., BARD, J.B.L. and DAVIDSON, D. (1997). Computer-aided 3-D reconstruction of serially-sectioned mouse embryos: its use in integrating anatomical organisation. Int. J. Dev. Biol. 41: 223-233.
KELLER, P.R. and KELLER, M.M. (1993). Visual Cues, practical data visualisation. IEEE Computer Press, Los Alamitos, CA.
KIMMEL, C.B., BALLARD, W.W., KIMMEL, S.R., ULLMAN, B. and SCHILLING, T.F. (1995). Stages of embryonic development of the zebrafish. Dev. Dyn. 203: 253-310.
KRIETE, A. and PEPPING, T. (1992). Volumetric Data Representations in Microscopy: Applications to Confocal and NMR-Microimaging. Visualisation in Biomedical Microscopies (ed. A.Kriete), VCH Weinheim. pp. 329-359.
MARTINELLI, S.D., BROWN, C.G. and DURBIN, R. (1997). Gene expression and development databases for C. Elelgans. Semin. Cell Dev. Biol. 8: 459-467.
MCLEAN, M.R. and PROTHERO, J. (1987). Coordinated three-dimensional recon-struction form serial section at macroscopic and microscopic levels of resolution: the human heart. Anat. Rec. 219: 434-439.
MOSS, V.A. (1992). Acquisition and visualisation of serial section images. In Visualisation in biomedical microscopies, 3D imaging and computer applications (Ed. A. Kriete) VCH Verlagsgesellschaft, Weinheim. pp. 19-44.
NIEVELSTEIN, R.A.J., WERF, VAN DER., J.F.A., VERMEIJ-KIERS, C., VERBEEK, F.J. and VALK, J. (1998). Normal and abnormal embryonic development of the anorectum in human embryos. Teratology 57: 70-78.
OLIVO, J-C., IZPISÚA-BELMONTE, J-C., TICKLE, C., BOULIN, C. and DUBOULE, D. (1993). Reconstruction from serial sections: a tool for developmental biology. Application to Hox genes expression in chicken wing buds. BioImaging 1: 151-158.
RINGWALD, M., BALDOCK, R., BARD, J., KAUFMAN, M., EPPICH, J., RICHARDSON, J., NADEAU, J.H. and DAVIDSON, D. (1994). A database for mouse development. Science 265: 2033-2034.
ROB, P. and CORONEL, C. (1993). Database systems, design implementation and management. Wadsworth Publishing Company. Belmont California.
ROBBINS, R.J., BENTON, Z.D. and SNODDY, J. (1995). Informatics and the Human Genome Project. IEEE Eng. Med. Biol. 14: 694-701.
ROSHANI, H, DABHOIWALA, N.F., VERBEEK, F.J. and LAMERS, W.H. (1996). Functional Anatomy of the Human Uterovesical Junction. Anat. Rec. 245: 645-651.
RUSS, J.C. (1995). The Image Processing Handbook. CRC Press, Boca Raton.
RYDMARK, M., JANSSON, T., BERTHOLD, C.H. and GUSTAVSSON, T. (1992). Computer assisted realignment of light migrograph images from consecutive section series of cat cerebral cortex. J. Microsc. 165: 29-47.
SKOGLUND, T., PASCHER, R., BERTHOLD, C.H., RYDMARK, M., JANSSON, T. and GUSTAVSSON, T. (1993). 3D reconstruction of biological objects from sequential image planes - applied on cerebral cortex from cat. Comput. Med. Imaging Graph. 17: 165-174.
SMITH, B.R., (1999). Visualizing Human Embryos. Sci. Am. 280: 58-63.
THOMSON, A.S., DABHOIWALA, N.F., VERBEEK F.J. and LAMERS W.H. (1994). The functional anatomy of the ureterovesical junction. Br. J. Urol. 73: 284-291.
VERBEEK, F.J. (1992). Deformation correction using Euclidean contour distance maps Proceedings 11th Int. Conf. on Pattern Recognition. IEEE Comp. Soc. Press Vol. III: 347-351.
VERBEEK, F.J. (1995). Three dimensional reconstruction from serial sections including deformation correction. Ph.D. thesis Delft University of Technology. pp. 1-217.
VERBEEK, F.J. (1996). 3D reconstruction from serial sections, applications and limitations. Microscopy and Analysis (UK version) 56: 33-35.
VERBEEK, F.J. (1999). Theory and Practice of 3D-reconstructions from serial sections. In Image Processing, A Practical Approach. (Eds. R.A. Baldock and J. Graham). Oxford University Press, Oxford. pp. 153-195.
VERBEEK, F.J. and HUIJSMANS, D.P. (1998). A Graphical database for 3D recon-struction supporting 4 different Geometrical Representations. In Databases in Biomedical research. (Ed. T.C. Stephen Wong). Kluwer Academic Publishers, Boston. pp. 117-144.
VERBEEK, F.J., DE GROOT, M.M., HUIJSMANS, D.P., LAMERS, W.H. and YOUNG, I.T. (1993). 3D BASE: A geometrical database system for the analysis and visualisation of 3D shapes obtained from parallel serial sections including three different geometrical representations. Comput. Med. Imaging Graph. 17: 151-163.
VERBEEK, F.J., HUIJSMANS, D.P., BAETEN, R.W.A.M., SCHOUTSEN, N.C.J. and LAMERS, W.H. (1995). Design and Implementation of a database and an program for 3D-reconstruction from serial sections: A data driven approach. Microsc. Res. Tech. 30: 1-17.
VERWEY, A. (1993). Three-Dimensional analysis of light microscope images; A method for studying cell fate in the mouse embryo. PhD Thesis Delft, TU Delft, The Netherlands.
VINOSKI, S. (1997). CORBA: Integrating Diverse Applications Within Distributed Heterogeneous Environments. IEEE Communications Magazine 14: 1-12.
WAGENAAR, G.T.M., MOORMAN, A.F.M., CHAMULEAU R.A.F.M., DEUTZ, N.E.P., DE GIER, C., DE BOER, P.A.J., VERBEEK., F.J. and LAMERS, W.H. (1994). Vascular branching pattern and zonation of gene-experession in the mammalian liver; a comparative study in rat, mouse, cynomolgus monkey, and pig. Anat. Rec. 239: 441-452.
WESTERFIELD, M., DOERRY, E., KIRKPATRIK, A.E., DRIEVER, W., DOUGLAS, S.A. (1997). On line database for zebrafish development and genetics research. Semin. Cell Dev. Biol. 8: 477-487.