DOI : https://doi.org/10.32628/CSEIT183843
IOT Based Smart Energy Meter for Tariff Calculation,
Disconnection and Reconnection of Loads
Dr. N. Muruganantham*1, M. L. Arundale2, K. Vijayakanth2, G.Vijayarani2 1Associate Professor, Department of Electrical and Electronics Engineering,
Periyar Maniammai Institute of Science & Technology, Tanjore, Tamil Nadu, India
2B.Tech, Department of Electrical and Electronics Engineering,
Periyar Maniammai Institute of Science & Technology, Tanjore, Tamil Nadu, India
ABSTRACT
Now a days, every month a person from electricity board visits each and every consumers energy meter for tariff calculation and billing. The main drawback of this system is that person has to go area by area and he has to read the meter of every house and handover the bills. Many times errors like extra bill amount or notification from electric board even though the bills are paid are common errors. To overcome this drawback our proposed project will eliminate the third party between the consumer and service provider, even the errors will be overcome. In this paper, energy meters which are already installed at our houses are not replaced, but a small modification on the already installed meters can change the existing meters into smart meters. The use of Global System for Mobile communication (GSM) module provides a feature of notification through Short Message Service (SMS). One can easily access the meter working through web page that we designed. Current reading with cost can be seen on web page. Automatic ON & OFF of meter is possible. Threshold value setting and sending of notification is the additional task that we are performing. Monitoring and keeping tracking of your electricity consumption for verification is a tedious task today since you need to go to meter reading room and take down readings. Well it is important to know if you are charged accordingly so the need is quite certain. Well we automate the system by allowing users to monitor energy meter readings over the internet. Our proposed system uses energy meter with microcontroller system to monitor energy usage using a meter. The meter is used to monitor units consumed and transmit the units as well as cost charged over the internet using wifi connection. This allows user to easily check the energy usage along with the cost charged online using a simple web application. Thus the energy meter monitoring system allows user to effectively monitor electricity meter readings and check the billing online with ease. It has been further extended by adding an additional feature of tripping the supply to a particular customer in case bill is not paid. The tariff changes can also be easily updated by the EB when needed.
Keywords : GSM, IOT Based Smart Energy Meter, Tariff Calculation, SMS, ARDUINO microcontroller, IOT
I. INTRODUCTION
Embedded systems and Real Time Operating systems (RTOS) are two among the several technologies that
make an impact on our everyday lives in a more significant manner. Embedded systems are pre-designed without connections and operate as per the required task. But in operating systems instruction is design-oriented. These systems are basically platform-less systems. Embedded systems are the unsung heroes of much of the technology we use today the video game we play, or the CD player or the washing machines we use employ them. Without an embedded system we would not even be able to go online using modem [3]. Almost every car that rolls off the production line these days makes use of embedded technology in one form or the other; most of the embedded systems in automobiles are rugged in nature, as most of these systems are made up of a single chip. No driver clashes or 'systems busy' conditions happen in these systems. Their compact profiles enable them to fit easily under the cramped hood of a car. These systems can be used to implement features ranging from adjustment of the suspension to suit road conditions and the octane content in the fuel to antilock braking systems (ABS) and security systems. Embedded systems are designed to do some specific task, rather than be a general-purpose computer for multiple tasks. Some also have real time performance constraints that must be met, for reasons such as safety and usability; others may have low or no performance requirements, allowing the system hardware to be simplified to reduce costs. Embedded systems are not always standalone devices. Many embedded systems consist of small, computerized parts within a larger device that serves a more general purpose. For example, the Gibson Robot Guitor features an embedded system for tuning the strings, but the overall purpose of the Robot performance constraints that must be met, for reasons
such as safety and usability; others may have low or no performance requirements, allowing the system hardware to be simplified to reduce costs. The Existing domestic Energy meter reading systems universally exist many problems, such as difficulty in construction, too narrow bandwidth, too low rate, poor real time, not two way communication quickly etc. To solve above problems, this paper uses the wireless technology for Automatic Meter Reading system.
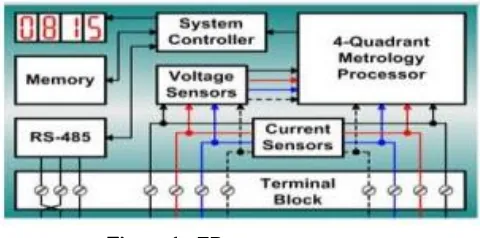
Figure 1 : EB meter structure
A proposed method provides the communication between the Electricity Board section and the consumer section using Internet of things (IOT) for transmitting the customer‟s electricity consumption and bill information that is calculated using ARDUINO microcontroller
II. PROPOSED METHOD
of energy meters can be identified easily. If an error occurs in the system, the value in the central server will not be updated. Once the value updated crosses the threshold time, the server can determine that something is wrong in the system and can report the engineers in EB. Thus, identification of error becomes easier. Since the values are stored in the central database, the reports are made accessible from anywhere in the world. Also, the server is online 24x 7 [4]. A. Advantages of the Proposed System The users can be aware of their electricity consumption. The human work of collecting readings by visiting every home at the end of every month can be avoided by generating Electricity bills automatically. Theft of electricity can be avoided by tamper proof energy meters. The errors in the system can be identified quickly
1. BLOCK DIAGRAM:
Figure 2 : Block diagram
In microcontroller we have already programmed that cost per unit. so it receives the pulse from signal conditioning unit and increment the count value. corresponding unit and cost are displayed on the lcd display. Every two months after microcontroller sends the consumed unit and price to mobile phone through rs232 converter. Mobile phone sends sms of this information to eb office as well as owners mobile these numbers already stored in the microcontroller.
The iot modem is interfaced to the microcontroller with the help of rs232 logical converter. this is
interfaced with the microcontroller in home. Esp8266 is transforming the world with its low cost and high features which makes it an ideal module for internet of things (iot). it can be used to monitor parameters such as voltage ,current, unit ,amount etc. and also control the disconnection & reconnection
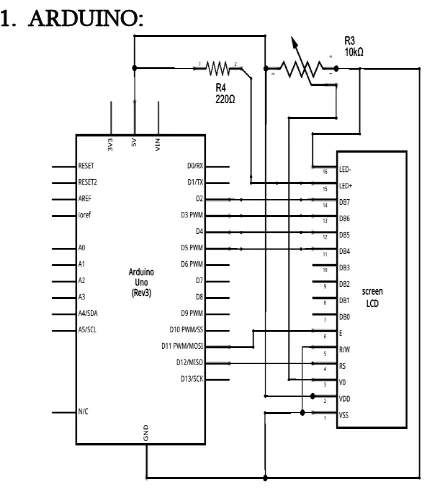
1. ARDUINO:
Figure 3 : Arduino Pin diagram
Arduino board is the heart of our system. Entire functioning of system depends on this board. Arduino reacts to the 5v supply given by opto-coupler and keeps on counting the supply and then calculates the power consumed and also the cost. This data, it continuously stores on webpage, so that users can visit any time and check their consumption. It even reacts accordingly as per programed, to the situations like message sending during threshold value etc.
2. Wi-Fi MODULE (ESP8266):
Figure 4. Nodemcu IOT Modem
The readings of units and cost are displayed on webpage. Consumer can accesses the Arduino board and meter with help of Wi-Fi.
3. VOLTAGE MEASUREMENT:
Figure 5. Voltage measurement circuit
This Voltage measurement circuit is designed to monitor the supply voltage. The supply voltage that has to monitor is step down by the potential transformer. Usually we are using the 0-6v potential transformer. The step down voltage is rectified by the precision rectifier. The precision rectifier is a configuration obtained with an operational amplifier in order to have a circuit behaving like an ideal diode or rectifier.
The full wave rectifier is the combination of half wave precision rectifier and summing amplifier. When the input voltage is negative, there is a negative voltage on the diode, too, so it works like an open circuit, there is no current in the load and the output voltage is zero. When the input is positive, it is amplified by the operational amplifier and it turns the diode on. There is current in the load and, because of the feedback, the output voltage is equal to the input.
4. CURRENT MEASUREMENT
Figure 6 : Current measurement circuit
This Current measurement circuit is designed to monitor the supply current. The supply current that has to monitor is step down by the current transformer. The step down current is converted by the voltage with the help of shunt resistor. Then the converted voltage is rectified by the precision rectifier. The precision rectifier is a configuration obtained with an operational amplifier in order to have a circuit behaving like an ideal diode or rectifier.
the diode on. There is current in the load and, because of the feedback, the output voltage is equal to the input.
5 FREQUENCY MEASUREMENT:
Figure 7 : Frequency measurement circuit
This Frequency measurement circuit is designed to find the frequency in the power line. The power line voltage is monitored through the potential and transformer. The potential transformer is used to step down the mains supply voltage to low voltage level. The voltage level is from 440V AC to 6V AC. Then the output of the transformer is given to Zero Crossing Detector.
The zero crossing detectors are constructed by the operational amplifier LM 741. The inverting and noninverting input terminals are connected to the potential transformer and current transformer terminals respectively. So the input sine wave signal is converted in to square wave signals. The square signal is in the range of +12v to -12v level. Then the square wave signal is given to base of the BC 547 switching transistor in order to convert the TTL voltage 0 to 5v level. This square wave signal is given to the pc or micro controller and measure the frequency with help of software.
6. POWER FACTOR MEASUREMENT:
Figure 8 : Power factor measurement circuit
This circuit is designed to find the power factor in the power line. The power line voltage and current is monitored through the potential and current transformer respectively.
The potential transformer is used to step down the mains supply voltage to low voltage level. The voltage level is from 440V AC to 6V AC. Then the output of the transformer is given to Zero Crossing Detector. The current consumed by the load is measured with the help of a current transformer. The current transformer will convert the load current in to lower values that current output will be converted in to voltage with the help of the shunt resistor. Then the corresponding the AC voltage is given to zero crossing detector. The Zero Crossing Detector is used to convert the sine wave to square wave signal.
III. HARDWARE IMPLEMENTATION:
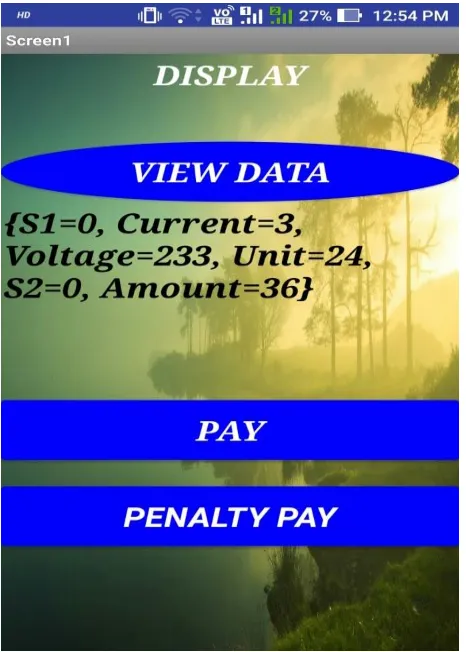
IV. SOFTWARE IMPLEMENTATION
Figure 10. Software android application
V. CONCLUSION:
An attempt has been made to make a practical model of „IoT Based Smart Energy Meter. The proposed model is used to calculate the energy consumption of the household, and even make the energy unit reading to be handy. Hence it reduces the wastage of energy and brings awareness among all. Even it will deduct the manual intervention.
It reduces the work of the office person to a great extent.
It reduces the difficulty faced by the people when readings are taken manually.
It has been further extended by adding an additional feature of tripping the supply to a particular customer in case bill is not paid.
The tariff changes can also be easily updated by the EB when needed.
The user can see the units and cost in LCD and can control the usage of Electricity.
VI.
REFERENCES
1. Sahana M N, Anjana S, Ankith S,K Natarajan, K R Shobha, “Home energy management leveraging open IoT protocol stack “, PP- 978-1-4673-6670-0, „Recent Advances in Intelligent Computational Systems (RAICS)‟, IEEE 2015. 2. YujunBao and Xiaoyan Jiang, “Design of
electric Energy Meter for long-distance data information transfers which based upon RTOS”, ISA2009. International Workshop on Intelligent Systems and Applications, 2009. 3. Ashna.K and Sudhish N George, "GSM based
automatic energy meter reading system" IEEE Wireless commuincations, 2013.
4. Philip Garner, Ian Mullins, Reuben Edwards and Paul Coulton. "Mobile Terminated MS Billing - Exploits and Security Analysis" New Generation. Proceedings of the Thirdlnternational Conference on lnformation Technology: New Generations (ITNG'06) -Vol. 00 200, 10-12 April 2006, Las Vegas, Nevada, USA, pp. 294 - 299.
5. N. Papadoglou and E. Stipidis (1999) "Short message service link for automatic vehicle location reporting" Electronics Letters 27th May 1999 Vol. 35 No. 11, pp. 121-126.
7. J. Widmer, Landis,” Billing metering using sampled values according lEe 61850-9-2 for substations”,IEEE 2014.
8. Cheng Pang,Valierry Vyatkin,Yinbai Deng, Majidi Sorouri, “Virtual smart metering in automation and simulation of energy efficient lighting system” IEEE 2013.
9. Amit Bhimte, Rohit K.Mathew, Kumaravel S, “Development of smart energy meter in labview for power distribution systems”, “IEEE INDICON 2015 1570186881”, 2015.
10. H. Arasteh, V. Hosseinnezhad, V.Loia, A.Tommasetti, O.Troisi, M.Shafie Khan, P.Siano, “IoT Based Smart Cities: A survey”IEEE 978-1-5090-2320-2/1631.00,2016. 11. Clement N. NYIRENDRE, Irvine