Volume 2010, Article ID 848713,24pages doi:10.1155/2010/848713
Research Article
Stereoscopic Visual Attention-Based Regional Bit
Allocation Optimization for Multiview Video Coding
Yun Zhang,
1, 2Gangyi Jiang,
1Mei Yu,
1Ken Chen,
1and Qionghai Dai
31Faculty of Information Science and Engineering, Ningbo University, Ningbo 315211, China 2Shenzhen Institute of Advanced Technology, Chinese Academy of Sciences, Shenzhen 518055, China 3Broadband Networks & Digital Media Lab, Tsinghua University, Beijing 100084, China
Correspondence should be addressed to Gangyi Jiang,[email protected]
Received 26 December 2009; Revised 2 May 2010; Accepted 18 June 2010
Academic Editor: Dimitrios Tzovaras
Copyright © 2010 Yun Zhang et al. This is an open access article distributed under the Creative Commons Attribution License, which permits unrestricted use, distribution, and reproduction in any medium, provided the original work is properly cited.
We propose a Stereoscopic Visual Attention- (SVA-) based regional bit allocation optimization for Multiview Video Coding (MVC) by the exploiting visual redundancies from human perceptions. We propose a novel SVA model, where multiple perceptual stimuli including depth, motion, intensity, color, and orientation contrast are utilized, to simulate the visual attention mechanisms of human visual system with stereoscopic perception. Then, a semantic region-of-interest (ROI) is extracted based on the saliency maps of SVA. Both objective and subjective evaluations of extracted ROIs indicated that the proposed SVA model based on ROI extraction scheme outperforms the schemes only using spatial or/and temporal visual attention clues. Finally, by using the extracted SVA-based ROIs, a regional bit allocation optimization scheme is presented to allocate more bits on SVA-based ROIs for high image quality and fewer bits on background regions for efficient compression purpose. Experimental results on MVC show that the proposed regional bit allocation algorithm can achieve over 20∼30% bit-rate saving while maintaining the subjective image quality. Meanwhile, the image quality of ROIs is improved by 0.46∼ 0.61 dB at the cost of insensitive image quality degradation of the background image.
1. Introduction
Three-Dimensional Video (3DV) provides Three-Dimen-sional (3D) depth impression and allows users to freely choose a view of a visual scene [1]. With these features, it would allow many multimedia applications, such as pho-torealistic rendering of 3D scenes, free viewpoint television [2], 3D television broadcasting, and 3D games, to introduce new and exciting features for users. Multiview video plus depth [3] supports high image quality and low complexity of rendering a continuum of output views. It has been the main representation of 3D scene and applied to many multiview multimedia applications. However, multiview video requires huge amount of storage and transmission bandwidth which are multiples of traditional monoview video. Thus, it is necessary to develop efficient Multiview Video Coding (MVC) algorithms for practical uses.
MVC had been studied on the basis of several video coding standards, including MPEG-2, MPEG-4, H.263, and
H.264. Since the Moving Picture Experts Group (MPEG) had recognized the importance of MVC technologies, an Ad Hoc Group (AHG) on 3D Audio and Visual (3DAV) was established. The MPEG surveyed some MVC schemes, such as “Group-of-GOP prediction (GoGOP)”, “sequential view prediction”, and “checkerboard decomposition”, [4]. Yea and Vetro proposed a view synthesis prediction-based MVC scheme for improving interview compression efficiency [5]. Yun et al. developed an efficient MVC algorithm which adaptively selects optimal prediction structure according to the spatiotemporal correlation of 3DV sequence [6]. Merkle et al. also proposed another MVC scheme using Hierarchical B Pictures (MVC-HBPs) and achieved superior compression efficiency and temporal scalability [7]. It has been adopted into MVC standardization draft by Joint Video Team (JVT) and used in the Joint Multiview Video Model (JMVM).
redundancies. Additionally, YUV color space transform, integer transform, and quantization technologies are also utilized to explore visual redundancies including chroma redundancies and high frequency redundancies. According to the studies on visual psychology, the Human Visual System (HVS) in fact does not treat visual information equally from regions to regions of the video content [8]. It is mentioned that HVS is more sensitive to the distortion in the Region-Of-Interests (ROIs) or attention areas than those in background regions [9]. Those are visual redundancies coming from regional interests existing in 3DV. However, previous MVC schemes have not taken the regional selective property and 3D depth perception of HVS into consideration. Applying the concept of ROI to video coding is regarded as a promising way to improve coding efficiency by exploiting regional visual redundancies. However, there are two major problems to be tackled, they are ROI detection and the ROI-based bits allocation.
For unsupervised ROI extraction, visual attention has been introduced as one of the key technologies in video/image system [10,11]. Accordingly, many efforts have been devoted to researches on visual attention model [11– 16] so as to simulate the visual attention mechanism of HVS accurately. Itti and Koch developed a bottom-up visual attention model [12] for still images based on Treisman’s stimulus integration theory [13]. It generates saliency map with the integration of perceptual stimuli from intensity contrast, colour contrast, and orientation contrast. Zhai et al. used the low-level features as well as cognitive features, such as skin colour and captions, in their visual attention model [14]. Motion is another important cue for visual attention detection in video, thus, a bottom-up spatiotemporal visual attention model is proposed for video sequences in [15]. Wang et al. proposed segment-based video attention detec-tion method [16]. Ma et al. also proposed a bottom-up and top-down combined visual attention model by integrating multiple features, including contrast in image, motion, face detection, audition, and text [11]. However, all these visual attention models were proposed either for static image or single view video and did not take stereoscopic or depth perception into account. On the other hand, stereoscopic parallax is not available in the single-view video.
From the video coding point of view, many bit allocation algorithms [17–24] are proposed for improving compression efficiency. Kaminsky et al. proposed a complexity-rate-distortion model to dynamically allocate bits with both com-plexity and distortion constraints [17]. Lu et al. proposed a Group-Of-Picture (GOP-)level bit allocation [18] scheme and Shen et al. proposed another frame-level bit allocation method which decreases the average standard deviation of video quality [19]. ¨Ozbek and Tekalp proposed a bit allocation among views for scalable multiview video coding [20]. All these bit allocation schemes improve the average Peak Signal-to-Noise Ratio (PSNR) but did not take the regional selective properties of HVS into account. Chen and Wang et al. proposed a bit allocation scheme that allocated more bits on ROI for MPEG-4 standard [21,22]. These two schemes require very high ROI extraction accuracy. Chi et al. proposed an ROI video coding based on H.263+ for low
bit-rate multimedia communications [23]. In the scheme, the ROI was extracted according to skin-color clue and a fuzzy logic controller was designed adaptively to adjust the quantization parameters for each macroblock (MB). Tang et al. proposed a bit allocation scheme for 2D video coding which is guided by visual sensitivity considering motion and texture structures [24]. However, these bit allocation schemes were proposed for single-view video coding and can not be directly applied to MVC because interview prediction is adopted in MVC.
In this paper, we propose a Stereoscopic Visual Attention-(SVA-) based regional bit allocation for improving MVC coding efficiency. We firstly present a framework of MVC in
Section 2. InSection 3, we propose an SVA model to simulate
visual attention mechanism of HVS. And then, SVA-based bit allocation optimization algorithm is proposed for MVC
inSection 4.Section 5presents the regional selective image
quality metrics which are adopted in the coding performance evaluation. In Section 6, SVA-based ROI extraction and multiview video coding experiments are performed and evaluated with various multiview video test sequences. Finally,Section 7gives conclusions.
2. Framework of Multiview Video System
Using Regional Bit Allocation Optimization
Figure 1 shows a framework of MVC with regional bit
allocation optimization. Firstly, N channels synchronized color videos are captured by parallel or arc arranged video capture system. Then, N synchronized depth videos, the same resolution as color image, are captured by depth camera array or generated by depth creation algorithms. By using depth video and multiview texture video, the SVA-based ROI extraction module efficiently extracts the semantic ROI mask for MVC codec. With the automatically extracted ROIs, MVC encoder is optimized for bit-rate saving in background region and better quality in ROI using regional bit allocation optimization. Finally, the compressed color and depth video bitstream are multiplexed and transmitted/stored. In the framework, the MB-wise ROI mask may not necessary to be transmitted to the client. Moreover, the framework is compatible with current block-based video coding standard and rate control, and low-level, such as macroblock level, syntax modification is not needed.
At the client side, the color and depth bitstream is de-multiplexed and decoded by the MVC decoder. With the decoded multiview color videos, depth videos as well as the transferred video cameras’ parameters, view generation module renders a continuum of output views, N(N > N),through depth image-based rendering [25]. According to different types of display device, for example, HDTV, stereoscopic display, or multiview display, different number of views is displayed.
3. Stereoscopic Visual Attention-Based
ROI Extraction
HDTV
Multi-view display
Stereoscopic projection system MB level ROI mask
···
SVA based ROI extraction
Regional bit allocation optimization
Multi-view video encoder
Depth image based rendering Network/
storage
Depth video generation Multi-view video
& depth video
Multi-view camera array
Multi-view video decoder
Figure1: Framework of multiview video system using regional bit allocation optimization.
by viewing a scene from slightly different viewing positions. The depth perception makes the scene more vivid, and it is another important factor that affects human visual attention just like what motion and texture contrasts do in traditional two-dimensional (2D) video. For example, people are often interested in the regions popping out from video screen and the interesting ratio of attention regions decreases as they are getting far away. In our previous work, we presented an SVA model [26] in which depth map was directly adopted as depth visual saliency. In this work, the SVA model is further improved in the following two aspects. Firstly, depth saliency is detected via a depth attention algorithm instead of using the depth map directly and a new fusion algorithm is presented. Secondly, inSection 6.2, a subjective evaluation is performed to testify the effectiveness of the improved SVA model. Each SVA object is modeled by combining the four attributes with low-level features, including depth, depth saliency, image saliency, and motion saliency. The SVA model is defined as
SSVA= {D,SD,SM, SI}, (1) whereSSVA is SVA saliency map,Dis the intensity of depth
maps which indicates the distance between video content and imaging camera/viewer, SI,SM, andSD are image saliency, motion saliency and depth saliency, respectively.
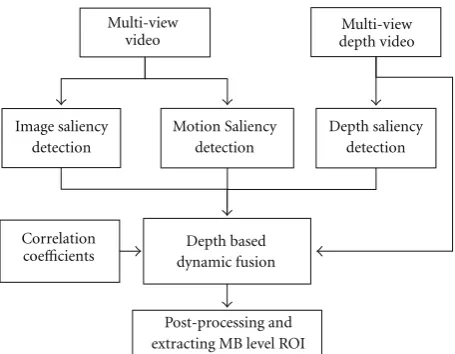
Figure 2 presented the architecture of our proposed
SVA-based ROI extraction. Image and motion saliency are detected from the multiview color video. Depth saliency is also detected from the multiview depth video. Afterward, a novel dynamic model fusion method is used to integrate the obtained pixelwise image saliency map, motion saliency, and depth saliency. The proposed SVA model does not incorporate any top-down, volitional component because it relies on the cognitive knowledge and differs from person to person. Finally, the MB level ROIs are extracted by threshold and block operation.
Motion Saliency detection Image saliency
detection
Depth based dynamic fusion
Post-processing and extracting MB level ROI
Depth saliency detection Multi-view
video
Multi-view depth video
Correlation coefficients
Figure2: Flowchart of the proposed SVA-based ROI extraction.
3.2. Spatial Attention Detection for Static Image. We adopted Itti’s bottom-up attention model [12, 27] for our spa-tial visual attention model. The seven neuronal features implemented are sensitive to color contrast (red/green and blue/yellow), intensity contrast, and four orientations (0◦, 45◦, 90◦, and 135◦) for static images. Centre and surround scales are obtained using dyadic Gaussian pyramids with nine levels. Then, Centre-Surround Differences (CSD) [27] are computed as the pointwise differences across pyramid levels; and then, six feature maps for CSD network are computed for each of the seven features, yielding a total of 42 feature maps. Finally, all feature maps are integrated into the unique scalar image saliencySI.
matching method in [28] to estimate the motion of image objects between consecutive frames. Frame groupF(v,t) = {fv,t|t=t+k,−w≤k≤w,k∈Z}, which consists of 2w+1 temporal consecutive frames in viewv, is employed to extract robust motion magnitude, wherewis temporal window size. The horizontal and vertical motion channels of framefv,tare determined by frame groupF(v,t), then they are combined together as
Mvk,t=Θm,nPmh,n
fv,t,fv,t+k+Pmv,n
fv,t,fv,t+k
, (2)
where operators Ph
m,n and Pmv,n denote the horizontal and the vertical optical flow operator with m×n block size, respectively. “| · |” is the magnitude of motion velocity. OperatorΘm,nperforms upsampling operation of Gaussian pyramid decomposition withm×ntimes. Therefore, Mkv,t is with the same resolution as fv,t. In this paper, a 4×4 (m = n = 4) block size is adopted to compute the optical flow because we found that it has a robust performance experimentally. Forward and backward motion is intersected so as to eliminate the background exposure phenomena, which refer to the background regions in current frame but attributed as motion regions byMk
v,torMv−,tk, that is,
Mv,t(k)=
⎧ ⎪ ⎪ ⎪ ⎨ ⎪ ⎪ ⎪ ⎩ Mk v,t+M−v,tk
2 , if min
Mk
v,t,Mv−,kt
> T1,
0, else,
(3)
where T1 is a trade-off between the sensitivity and error
resilience of the motion detection, and it is set as 0 for sensitivity in this paper. Then, to reduce the error effects caused by noises, such as camera shaking and jitter of video sequences, severalMv,t(k) are weighted combined to form a final motion map,Mas follow:
M=
w
k=1
σk·Mv,t(k), (4)
whereσkare weighted coefficients satisfying
w
k=1σk =1. In this paper,wis set to 3 since it has a good trade-offbetween complexity and error resilience, σk is 1/w. Usually, motion attention level increases with relative motion. So motion saliency map is generated by using CSD network [27] and represented as
Sm=N
4 c=2
c+4
s=c+3N|M(c)OM(s)|
, (5)
where O denotes the across-level difference between two maps at the center (c) and the surround (s) levels of the respective feature pyramids, s,c ∈ [0, 8], s = c +
δ, δ = {−3,−2,−1, 1, 2, 3}; ⊕ is across-level addition; N(·) is a normalization operator. There are also several normalization strategies available in [29], such as learning, iterative localized iteration. However, these normalization strategies are supervised or very time consuming. Therefore, we adopted the “Naive” strategy in [29] for its low complexity and unsupervised purpose, the normalization operator is
N(ix,y) = 255(ix,y − min(x,y)∈I(ix,y))/(max(x,y)∈I(ix,y) − min(x,y)∈I(ix,y)), which adjusts the saliency value to fixed rang 0∼255 (value 255 indicates being most salient) for imageI.
3.4. Depth Impacts on SVA and Depth Attention Detection. The stereoscopic perception can also be represented by the 2D video and the depth map which indicates the relative distance between video object and the camera system. Hence, we use a depth map to analyze the differences between 3D video and traditional 2D video. Compared with traditional 2D video, the depth’s effect on human SVA is listed as the following four aspects.
(1) When watching 3D video, people are usually more interested in the regions visually moving out of the screen, that is, pop-out regions, which are with small depth values or large disparities.
(2) As the distance between video object and viewer/ camera increases, interesting ratio of the video object decreases.
(3) The out of Depth-Of-Field (DOF) objects of the camera system is usually not the attention areas, for example, defocusing blurred background object or foreground object.
(4) Depth discontinuous regions or depth contrast regions are usually the attention areas in the 3DV as they provide strong depth sensation, especially when view angles or view positions are switching.
Depth map is an 8-bit gray image that can be captured by depth camera or computed using multiview video. Each pixel in the depth map represents a relative distance between video object and camera. In this paper, we firstly estimate the disparity for each pixel in multiview video by using stereo matching method. Then, the disparity is converted into perceptive depth. Finally, intensity of each pixel in depth map is mapped to an irregular space with nonuniform quantization [30]. HVS perceptive depth,Z, is shown as
Z=B·f
dc
, (6)
wheref is the focal length of the cameras,Bis the baseline between the neighboring cameras,dcis the physical disparity (measured by centimeter) between the corresponding points of the neighboring views. However, disparity estimated using stereo matching is measured by pixel. So we use a centimeter-to-pixel ratio, λ, that is, a ratio of CCD size to image resolution, to convert physical disparity to pixel disparity
dp=dc/λ. (7) Because close object is usually more important than far away object, the depth valueZwhich corresponds to the pixel (x,y) is transformed into the 8-bit intensityd(x,y) with non-uniform quantization [30]
dx,y=
255· zn
Zx,y ·
zf−Zx,y
zf −zn + 0.5
where “· ” is floor operation,zf andznindicate the farthest and nearest depth, respectively, and zf = B f /λmin{d
p},
zn = B f /λmax{d
p},f is the focal length, and B is the baseline between cameras. The space between zf andzn is divided into narrow spaces around theznplane and is divided into wide spaces around thezf plane.
It is observed that the depth contrast and the depth orientation contrast are usually attention-catching regions. Thus, we obtain the depth orientation information,O(σ,θ), from depth intensity mapsDusing oriented Gabor filters, whereσ∈[0· · ·8] represents the scale of different pyramids level and θ ∈ {0,π/4,π/2, 3π/4}. The orientation feature maps of the depth video FO are obtained from absolute CSD network [27] between the depth orientation-selective channels
FO
=1
4
θ∈{0,π/4,π/2,3π/4}
N4c=2cs+4=c+3N(|O(c,θ)OO(s,θ)|)
(9)
Additionally, intensity feature maps of the depth video FD are obtained from absolute CSD network between the depth intensity channels
FD=N
4 c=2
c+4
s=c+3N(|D(c)OD(s)|)
, (10)
where D indicates the depth intensity map. Finally, the orientation feature map and the intensity feature map are normalized and combined to form a depth saliency map as
SD = 1
2(N(FO) +N(FD))⊗G, (11)
where Gis a boundary depress matrix. The symbol ⊗ is scalar multiplication that indicates that each element of (N(FO) +N(FD)) is multiplied by the scaling factor in the same position in matrixG. In the current stereoscopic display, the regions near by image boundary almost can not provide or just provide a little depth perception. Also, people pay more attention to the center location [31]. Thus, the depth saliency of the image boundary is depressed using a boundary depress matrixG. Each element at position (x,y) in G is g(x,y) = 1 −(1/L)Li=1αi(x,y), where L is the number of levels for image boundary depression,
αi
x,y=
⎧ ⎪ ⎨ ⎪ ⎩
1, x∈(iwx,W−iwx),y∈
iwy,H−iwy
,
0, others,
(12)
wxandwyare width and height for each boundary depres-sion level,WandHare width and height of the stereoscopic video, respectively.
3.5. Depth-Based Fusion for SVA Model. Psychological stud-ies reveal that HVS is more sensitive to motion contrast when compared to color, intensity, and orientation contrast
SVA-ROI MB Transitional MB (Lv1)
Background MB Transitional MB (Lv2)
Figure3: Sample of attention mask.
in single-view video. If a strong motion contrast is presented in the sequence, temporal attention is dominant over the spatial attention. However, if the motion contrast is low in the sequence, the spatial attention is more dominant. In the 3DV, the depth sensation is provided and depth is another key factor for visual attention in stereoscopic video. Thus, depth, spatial and temporal information of 3DV are jointly combined to construct SVA saliency as
sSVA
x,y
=N
⎛
⎝Qdx,y ⎛
⎝
a∈{D,M,I}
Kasa
x,y
−
a,b∈{D,M,I},a /=b
CabΘab
x,y
⎞ ⎠ ⎞ ⎠,
(13)
where KD,KM, andKI are weighted coefficients for depth saliency, motion saliency, and image saliency, respectively, and they satisfya∈{D,M,I}Ka=1, 0≤KD,KM,KI≤1. Rel-ative larger weighted coefficient value shall be given to more dominative saliency.Θab(x,y) denotes correlation between saliencyaand saliencyb,Θab(x,y)=min(sa(x,y),sb(x,y)),
Cab is a weighted coefficient for Θab(x,y), 0 ≤ Cab < 1, andQ() is a scaling function for depth intensity video. If the depth video is not provided, then (13) will be considered as a spatiotemporal scheme which fuses motion and still image saliency.
B3 B3 B3 B3 B3 B3 B3 B3 B3 B3 B3
B3 B3 B3 B3 B3 B3 B3 B3 B3 B3 B3 B3 B3 B3 B3 B3 B3 B3 B3 B3
B3 B3 B3 B3 B3 B3 B3 P0 P0 P0 P0 P0 P0 P0 P0 B2 B2 B2 B2 B2 B2 B2 B2 B2 B2 B2 B2 B2 B1 B1 B1 B1 B1 B1 B1 B1 B1 B1 B1 b4 b4 b4 b4 b4 b4 b4 b4
b4 b4 b4 b4 b4 b4 b4 b4
b4 b4 b4 b4 b4 b4 b4 b4
b4 b4 b4 b4 b4 b4 b4 b4 I0 I0 S1 S2 S3 S4 S5 S6 S7 S0
T0 T1 T2 T3 T4 T5 T6 T7 T8 T9 T10 T11 T12
Vi
ew
Time
Figure4: MVC-HBP prediction structure.
0 2 4 6 8 10 12 14 16 0 20 40 60 80 100 Exit Ballroom Breakdancers Alt moabit Race1 Door flower Ballet Average
Expotential decaying fit RBSR ( bQP , Δ QP , Δ QP )(%) ΔQP
Figure 5: The relationship between RBSR(bQP,ΔQP,ΔQP) and
ΔQP.
sSVA(x,y) energy of an image weighted byT2, that is,T2(Hb×
Wb/H×W)
H y=1
W
x=1sSVA(x,y); Otherwise,Bu,vis labeled as background, that is,
Bu,v=
⎧ ⎪ ⎪ ⎪ ⎪ ⎪ ⎪ ⎪ ⎪ ⎨ ⎪ ⎪ ⎪ ⎪ ⎪ ⎪ ⎪ ⎪ ⎩ ROI, Hb
y=1 Wb
x=1
sSVA
x,y
≥T2Hb×Wb
H×W
H
y=1 W
x=1
sSVA
x,y,
Background, else,
(14)
whereHbandWbare height and width ofBu,v,WandHare width and height of the video, respectively. As thresholdT2
increases,Bu,v with lower SVA saliency will be determined as ROIs, and vice versa. In this paper, T2 is set as 1.10.
To transit image quality from ROI to background regions smoothly in MVC, two MB wide transitional regions between ROI and background MB are defined. A sample of ROI mask
is shown in Figure 3. The black rectangles are ROI MBs, white rectangles are background MBs, and gray rectangles are transitional MB with different levels.
4. SVA-Based Regional Bit Allocation
Optimization for MVC
The MVC-HBP prediction structure [7], shown inFigure 4, is interview and temporal prediction hybrid. The even views are coded using motion prediction compensation, while the odd views are coded utilizing both interview prediction and temporal prediction. Since the MVC-HBP prediction structure is superior on both compression efficiency and temporal scalability, it is adopted by JVT and used in reference software JMVM. This superior coding performance is mainly owing to its novel quantization strategy. Given the basis Quantization Parameter (QP) of MVC-HBP prediction structure, bQP, the remaining QPs are determined as
QPl=
⎧ ⎨ ⎩
bQP + 3, ifl=1,
QPl−1+ 1, ifl >1, (15) where l is hierarchical level of hierarchical B frame. In the proposed SVA-based MVC scheme, larger QPs are set for background regions and transitional regions for higher compression ratio. The QP of SVA-based ROI in levellis set as QPlSVA=QPl. QPs of the background and the transitional regions in thelth hierarchical level picture,QPlBG and QPlTi, are defined as
QPlBG=QPlSVA+ΔQP,
QPlTi=QPlSVA+
ΔQP/ηi
,
(16)
where “· ” is floor operation, ηi is a positive division parameter, andΔQP is a QP difference between background region and ROI region and it indicates the relative amount of bits allocated between ROI and the background regions.
To exploit regional selective visual redundancies in 3DV, the SVA-based MVC scheme is used to maximize compres-sion ratio while at the cost of imperceptible image quality loss in background. Therefore, we need to determine the optimalΔQP. The bit allocation optimization scheme in [32] is adopted to determine bit allocation between SVA-based ROIs and background regions. Here, a short review on the bit allocation scheme is presented for better readability. Two indices, the average bit-rate saving ratio,RBSR, and the image
quality degradation,ΔD, are adopted to evaluate the coding performance of MVC scheme with differentΔQP. The bit-rate saving ratio,RBSR(bQP,ΔQPROI,ΔQPBG), is calculated as
RBSR(bQP,ΔQPSVA,ΔQPBG)
= 1
VGOP×TGOP VGOP
j=1 TGOP
i=1
EBi,jQPl
SVA, QPlSVA
−EBi,j(A)
EBi,jQPl
SVA, QPlSVA
,
(17)
where A = QPlSVA+ΔQPSVA, QPlSVA+ΔQPBG and where
(a) Ballet
(b) Breakdancers
(c) Doorflowers
(d) Alt Moabit
(e) Dog
(f) Pantomime
(g) Champagne tower
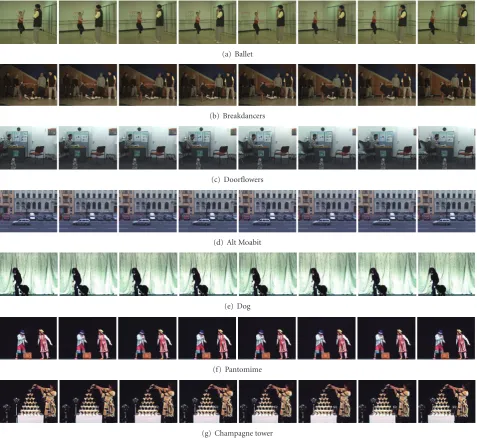
Figure6: Eight views of multiview video test sequences.
in one GOP, i andj are temporal and interview position, respectively.EBi,j(QP
1, QP2) denotes the number of bits of
encoding a frame at position (i,j) while its ROIs are coded with QP1 and background regions are coded with QP2 ·
ΔQPSVA andΔQPBG denote the QP differences between the
ROI and the background regions, respectively.
Figure 5shows the relationship betweenRBSR(bQP,ΔQP,
ΔQP) andΔQP in that one QP is used for both ROI and background regions. RBSR(bQP,ΔQP,ΔQP) is subjected to
the exponential decaying function asΔQP increases. Thus,
RBSR(bQP,ΔQP,ΔQP) can be predicted as
RBSR(bQP,ΔQP,ΔQP)=A0e−ΔQP/T+y0, (18)
where A0 and T are the coefficients of functions bQP
and independent to the content of multiview video. y0
is the maximum bit-rate saving ratio. Because ROI and background regions are mutual exclusive, we can obtain
RBSR(bQP,ΔQP,ΔQP)=RBSR(bQP, 0,ΔQP)
+RBSR(bQP,ΔQP, 0).
(19)
Once, ROI and background regions are segmented for 3DV sequence, the bit-rate saving ratio of ROI is approx-imately in direct proportion to that of background region whileΔQP increases. It is represented by
ρ=RBSR(bQP, 0,ΔQP)
RBSR(bQP,ΔQP, 0)
whereρis independent ofΔQP. Hence, substituting (19) and (20) into (18), we can obtain
RBSR(bQP, 0,ΔQP)=Ae−ΔQP/T+y, (21)
whereA =1/(1 +ρ)A0and y =1/(1 +ρ)y0.|A|indicates
amplitude of bit-rate saving. Parameter T indicates the period thatRBSR reaches the point of no more gain can be
saved asΔQP increases.
On the other hand, image quality degradation caused by allocating fewer bits on background regions ΔD(bQP,ΔQPROI,ΔQPBG) is calculated as
ΔD(bQP,ΔQPSVA,ΔQPBG)
= 1
VGOP×TGOP VGOP
j=1 TGOP
i=1
Qi,j(A)−Qi,jQPl
SVA, QPlSVA
,
(22)
where A = QPlSVA +ΔQPSVA, QPlSVA +ΔQPBG and where
Qi,j(QP
1, QP2) denotes the reconstructed image quality of
a frame at position (i,j), while ROIs are coded with QP1,
and background regions are coded with QP2. ΔQPSVA,
and ΔQPBG denote QP changes in ROI and background
regions, respectively. Because the relationship between dis-tortion, such as PSNR, and quantization factor in H.264 is approximately linear [33], we can define the image quality degradation of bit allocation,ΔD(bQP, 0,ΔQP), as
ΔD(bQP, 0,ΔQP)=b1·ΔQP +a1, (23)
where a1 is coefficient independent to ΔQP, and b1 is a
negative value which indicates the slope of image quality degradation.ΔD(bQP, 0,ΔQP) is a negative value and it will decrease asΔQP increases to improve compression ratio.
To achieve a high compression ratio and also to maintain high image quality with bit allocation optimization, we ought to find the optimalΔQP to maximize bit-rate saving ratio
RBSR subject to a unnoticeable image quality degradation,
TD. It is mathematically expressed as arg max{RBSR(bQP, 0,ΔQP)}
s.t.|ΔD(bQP, 0,ΔQP)|< TD.
(24)
Instead of solving the constrained problem in (24), an unconstrained formulation is employed. The optimalΔQP∗
is determined as ΔQP∗= arg
ΔQP∈Z+
max{RBSR(bQP, 0,ΔQP)
+μ·ΔD(bQP, 0,ΔQP),
(25)
where μ is a scaling constant putting RBSR and ΔD in
a same scale. We set the partial derivative of function
RBSR(bQP, 0,ΔQP) +μΔD(bQP, 0,ΔQP) ofΔQP equal to 0,
that is,
∂RBSR(bQP, 0,ΔQP) +μ·ΔD(bQP, 0,ΔQP)
∂ΔQP =0. (26)
By solving the (26), the optimal integerΔQP∗is obtained as
ΔQP∗=
T ln A
μ·T·b1
+ 0.5
. (27)
where symbol “· ” is floor operation. Meanwhile,ΔQP∗is truncated to 0 ifΔQP∗ is smaller than 0. CoefficientsA,T, andb1are bQP dependent and will be modeled
experimen-tally from MVC experiments presented inSection 6.3.
5. ROI-Based Objective Image Quality
Assessment Metric
Pixelwise image quality assessment metric, such as PSNR, has been widely used for video quality evaluation. However, it does not match well with the human visual perception. Engelke et al. proposed a region-selective objective image quality metric [34] which is able to be combined with normalized hybrid image quality metric, reduced-reference image quality assessment technique, Structural SIMilarity (SSIM) [35], or PSNR measures. Since both SSIM and PSNR have been adopted in advanced video coding standard, H.264/AVC, we apply both the region-selective SSIM and PSNR metrics [34] to evaluate the proposed MVC scheme. The SSIM index [34] between two images is computed as
SSIM=
2μRμD+C1
(2σRD+C2)
μ2
R+μ2D+C1
σ2
R+σD2+C2
, (28)
where R and D are two nonnegative image signals to be compared, μR and μD are the means of images R and D,
σR and σD are standard deviation of images R and D, respectively, and σRD is covariance of images R andD,C1
andC2are constants. The PSNR of illumination component
(PSNR Y) measures the fidelity difference of two image signalsIR(x,y) andID(x,y) on a pixel-by-pixel basis as
PSNR Y=10 log Γ
2
1/(W×H)Wx=1
H y=1
IR
x,y−ID
x,y2,
(29)
whereΓis the maximum pixel value, here it is 255.
The objective image quality metrics have been used to independently assess the image quality of ROI and background region to enable region-selective quality metric design. An ROI quality metric ΦROI is calculated on ROI
of reference and distorted images. Similarly, background regions of reference and distorted images are used to assess quality of the background region by computing ΦBG. In a
pooling stage,ΦROI andΦBG are combined with a
region-selective metric, and the final Predictive Mean Opinion Score (PMOS) is computed as follows [34]:
Φ(ω,κ,ν)=ω·Φκ
ROI+ (1−ω)ΦκBG
1/ν,
PMOSΦ(ω,κ,ν)=a·eb·Φ(ω,κ,ν),
(30)
whereω ∈[0, 1],κ,ν ∈ Z+,Φ ∈ {SSIM, PSNR Y}ω,κ,ν,a,
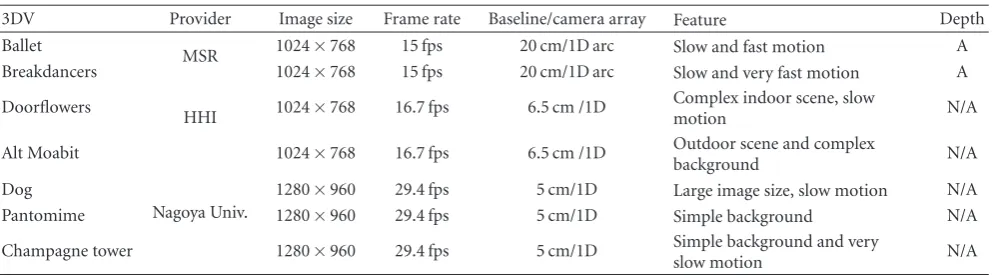
Table1: Parameters and Features of the Test Multiview Videos.
3DV Provider Image size Frame rate Baseline/camera array Feature Depth
Ballet
MSR 1024×768 15 fps 20 cm/1D arc Slow and fast motion A
Breakdancers 1024×768 15 fps 20 cm/1D arc Slow and very fast motion A
Doorflowers
HHI 1024×768 16.7 fps 6.5 cm /1D
Complex indoor scene, slow
motion N/A
Alt Moabit 1024×768 16.7 fps 6.5 cm /1D Outdoor scene and complex
background N/A
Dog
Nagoya Univ.
1280×960 29.4 fps 5 cm/1D Large image size, slow motion N/A
Pantomime 1280×960 29.4 fps 5 cm/1D Simple background N/A
Champagne tower 1280×960 29.4 fps 5 cm/1D Simple background and very
slow motion N/A
experiments in [34]. In the following sections, PMOSs of PSNR Y and SSIM are denoted by PMOS PSNR and PMOS SSIM, respectively.
6. Experimental Results and Analyses
In this section, the performance of SVA-based ROI extraction algorithms and SVA-based MVC are evaluated. Experi-ments include three steps. First, SVA-based ROI extraction experiments are performed and evaluated with subjective experiments. Secondly, regional bit allocation optimization experiments are performed for allocating reasonable mounts of bits among ROI and background regions and optimalΔQP is determined. Finally, MVC experiments are implemented to verify the efficiency of the SVA-based bit allocation optimization. In these experiments, we adopt seven typical multiview video sequences provided by Heinrich Hertz Institute (HHI) [36], Microsoft Research (MSR) [37], and Nagoya University [38]. These 3DV sequences are with different textures, motion properties, resolutions, capturing frame rates, and camera arrangements. Eight views of the test sequences are illustrated inFigure 6.Table 1shows the properties of the test multiview video sequences. Depth maps of Breakdancers and Ballet test sequences, marked as “A” in last column, are available. The depth maps of the rest videos, marked as “N/A”, are generated by Depth Estimation Reference Software (DERS) [39].
6.1. SVA-Based ROI Extraction. In the 3DV, motion saliency object is usually the most salient regions in the visual attentive area; next is the image saliency. Depth saliency is relatively less important and is given smaller weighted coefficient while comparing with motion saliency and image saliency except that the 3DV provides strong depth per-ception. So in the experiments, relative larger weighted coefficient value is given to dominative or more important motion saliency, and KD, KI, and KM are empirically set as 0.2, 0.35, and 0.45 under the constraints KD < KI <
KM and KD + KI + KM = 1. On the other hand, in the Multiview video, image, motion, and depth saliencies are correlated with each other. The correlation between image and motion saliencies is higher than the other two
correlations, that is, correlations between depth and image saliency, depth and motion saliency. It is because detected moving objects are likely textural objects. However, there are no explicit correlations between depth and image/motion saliency. Thus, the weighted coefficientsCIM are larger than
CDM,CDI, and they empirically are set as 0.6, 0.2, and 0.2, respectively. Actually, in order to accurately simulate the mechanism of human visual attention, values of parameters
KD,KI, andKM, andCIM,CDM, and,CDIshould be adjusted according to motion, textual, and depth characteristics of the multiview video sequences.
In the depth video, thezf andznplanes are mapped to 0 and 255, respectively, with the non-uniform quantization process in (8), which treatszf plane as infinite far away and supposes that saliency inzf plane is completely unimportant. However, zf planes of the video sequences are usually not infinite. So, we use the scaling functionQ(x)=x+γ, where
γis a positive constant, to map thezn∼zf plane toγ∼γ+255 and take the saliency in zf plane into account. Usually, γ shows the importance of the saliency inzf plane compared with that of zn plane. It increases as zf plane closes to zn plane and decreases to 0 aszf becomes infinite. In the SVA extraction experiments,γis set to 50 because most of the test video sequences are indoor scene and theirzf planes close to znplane.
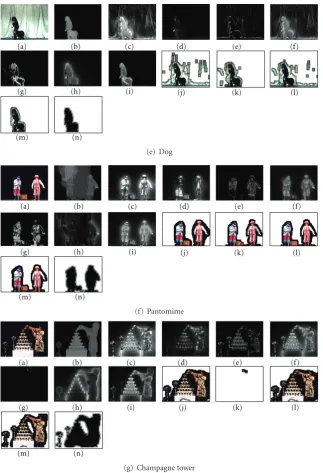
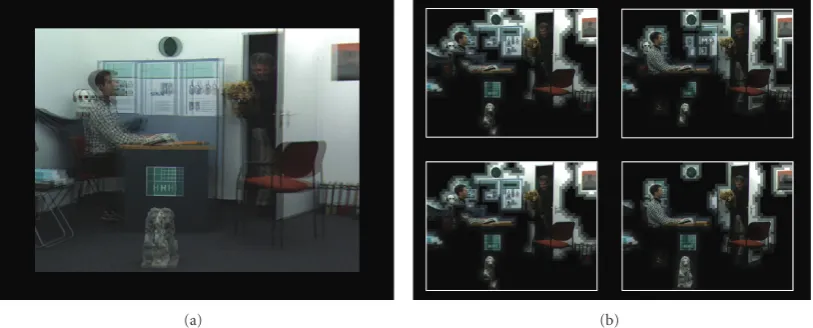
Figure 7shows the SVA-based ROI extraction results for
(a) (b) (c) (d) (e) (f)
(g) (h) (i) (j) (k) (l)
(m) (n)
(a) Ballet
(a) (b) (c) (d) (e) (f)
(g) (h) (i) (j) (k) (l)
(m) (n)
(b) Breakdancers
(a) (b) (c) (d) (e) (f)
(g) (h) (i) (j) (k) (l)
(m) (n)
(c) Doorflowers
(a) (b) (c) (d) (e) (f)
(g) (h) (i) (j) (k) (l)
(m) (n)
(a) (b) (c) (d) (e) (f)
(g) (h) (i) (j) (k) (l)
(m) (n)
(e) Dog
(a) (b) (c) (d) (e) (f)
(g) (h) (i) (j) (k) (l)
(m) (n)
(f) Pantomime
(a) (b) (c) (d) (e) (f)
(g) (h) (i) (j) (k) (l)
(m) (n)
(g) Champagne tower
Figure7: SVA-based ROI extraction results. (a) One view of original multiview video; (b) One view of multiview depth video; (c) Feature maps of intensity; (d) Feature maps of color; (e) Feature maps of orientation; (f) Static image saliency map; (g) Motion saliency map; (h) Depth saliency map; (i) Final SVA saliency map (proposed); (j) Extracted ROI using static image saliency (S-scheme); (k) Extracted ROI using motion saliency (T-scheme); (l) Extracted ROI using spatiotemporal saliency (ST-scheme); (m) Extracted ROI based on SVA model (proposed); (n) MB-level ROI mask (proposed).
be utilized to improve visual attention model for dynamic stereoscopic visual scenes.
Figure 7(g) illustrates motion saliency maps and
Figure 7(k) shows the ROI extracted on the basis of motion
saliency only. Generally, large motion contrast areas are very likely to be potential attention areas. However, it is not always true. For example, for Ballet sequence, the shadow of the dancing girl exhibits high motion contrast, but it is not an attentive area. This kind of noise can be eliminated by combining the depth saliency and static image saliency.
Figure 7(h) shows the depth saliency extracted from depth
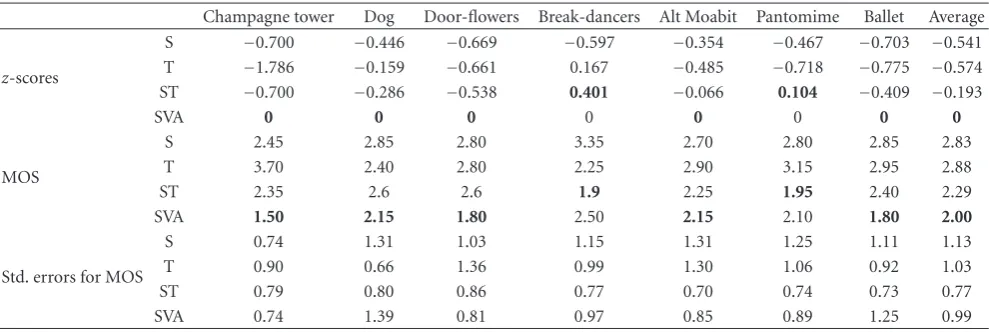
Table2:z-scores, mean opinion score and standard errors for ROI extraction schemes.
Champagne tower Dog Door-flowers Break-dancers Alt Moabit Pantomime Ballet Average
z-scores
S −0.700 −0.446 −0.669 −0.597 −0.354 −0.467 −0.703 −0.541 T −1.786 −0.159 −0.661 0.167 −0.485 −0.718 −0.775 −0.574 ST −0.700 −0.286 −0.538 0.401 −0.066 0.104 −0.409 −0.193
SVA 0 0 0 0 0 0 0 0
MOS
S 2.45 2.85 2.80 3.35 2.70 2.80 2.85 2.83
T 3.70 2.40 2.80 2.25 2.90 3.15 2.95 2.88
ST 2.35 2.6 2.6 1.9 2.25 1.95 2.40 2.29
SVA 1.50 2.15 1.80 2.50 2.15 2.10 1.80 2.00
Std. errors for MOS
S 0.74 1.31 1.03 1.15 1.31 1.25 1.11 1.13
T 0.90 0.66 1.36 0.99 1.30 1.06 0.92 1.03
ST 0.79 0.80 0.86 0.77 0.70 0.74 0.73 0.77
SVA 0.74 1.39 0.81 0.97 0.85 0.89 1.25 0.99
object close to them in a view than that far away from them. According to the extracted depth saliency of various test sequences, the proposed depth saliency detection algorithm is efficient and maintains high accuracy as the depth map is accurate. However, for inaccurate depth and the sequences with weak depth perception, only depth saliency turns out to be not sufficient to simulate visual attention. Such cases can be noted in Pantomime and Breakdancers.
Figure 7(i) shows the final SVA saliency map generated
by the proposed SVA model. We can see thatFigure 7(i) can simulate visual attention mechanism of HVS better for all sequences when compared with Figures 7(f)–7(h). Taking Ballet sequence as an example, the proposed SVA model can depress the noise in spatial saliency map (black region on the wall in color image), noise in motion saliency map (shadow of the dancing girl), and noise in depth (the foreground floor). Favorable saliency map and ROI are created. For Doorflowers sequence, multiple attention cues including motion (two men and the door), static image attention (clock, painting, and chair), and depth (the sculpture) are integrated together very well by the proposed model. Similar results can be found for other multiview video sequences. Therefore, it can be concluded that the proposed model detects the SVA accurately and simulates HVS well by fusing depth information, static image saliency, and motion saliency. Additionally, though there are noises in both the depth map and/or the image saliency, the proposed model still can obtain satisfactory SVA jointly using depth, motion, and texture information and depress noises in each channel. Thus, the proposed model is error resilient and with high robustness.
The ROI extraction results, as illustrated in Figures7(j)– 7(m), are generated by four schemes, that is, S-scheme, T-scheme, ST-T-scheme, and proposed SVA scheme. S-scheme denotes ROI extraction only using static image information. T-scheme denotes that ROI is extracted only using motion information. ST-scheme indicates ROI extraction using both static image information and motion information. SVA denotes ROI is extracted based on our proposed SVA model.
Figure 7(m) shows the extracted MB level ROI based on
SVA andFigure 7(n) is MB level ROI mask in which Black
blocks are ROI MBs, gray blocks are transitional MBs, and white blocks are background MBs. Comparing Figures7(j), 7(k), and 7(l) with Figure 7(m), we can see that extracted ROIs based on SVA model are similar to this ROI extraction based on static image saliency (S-scheme) for simple textural multiview video, such as Pantomime and Champagne tower. However, for complex textural multiview video, such as Dog, Ballet, Alt Moabit, and Doorflowers, the ROIs extracted based on the proposed SVA model are much better and more favorable than S-scheme, T-scheme, and ST-scheme because they lack of information from depth or motion channel.
6.2. Subjective Evaluation for SVA-Based ROI Extraction. Subjective evaluation of SVA-based ROIs extraction results has also been performed. Polarization-multiplexed display method is used for displaying stereo video and image. Stereo-scopic images are played back through a stereoStereo-scopic dual projection system, where two BenQ P8265 DLP projectors are used to project left and right view images on a 150-inche silver screen. Viewers wear polarized glasses to watch the stereo video. Extracted ROI results are randomly ordered and displayed on a traditional monoview 21LCD display at the time when stereoscopic video is being displayed via the stereoscopic video system. The experiment is conducted in a special room with ambient illumination, color temperature, and ambient sound controlled according to the requirements in ITU-R Recommendation 500 [40]. There are 20 partic-ipants recruited in campus, age from 22 to 32, 7 females and 13 males, 2 participants are experts, 15 participants have some stereoscopic image processing knowledge, and the rest 3 participants do not have image processing knowledge. That is the 18 participants are nonexpert and they are not concerned with the visual attention and the ROI extraction in their normal work. All participants passed the color vision test and achieved the minimum criteria: acuity of 20 : 30 vision, stereoscopic visual acuity of 40 sec.arc.
(a) (b)
Figure8: (a) Example of stereoscopic video (b) ROIs on monoview LCD display.
Stereoscopic dual projection system Mono-View LCD display Black
Black
Black
Black Stereoscopic
video Stereoscopic
video
Regions of interests
6s 5s 6s
Stereoscopic image
15s 10s
Ranking 1s
Figure9: Displaying time interval of stereoscopic video and the extracted ROIs.
are generated by the four schemes, S-scheme, T-scheme, ST-scheme, and proposed SVA ST-scheme, respectively. Example of stereoscopic video displaying is shown inFigure 8(a). ROIs by different schemes are randomly displayed on four areas of monoview LCD display and example of the demonstration is shown as Figure 8(b). The displaying time interval for each sequence is shown inFigure 9. Both stereoscopic video and stereoscopic image are displayed on the dual projection system in different time slot. Before the subjective experi-ment, participants had a try of the stereo vision system with several stereopair images from Middlebury Stereo Vision Page (http://vision.middlebury.edu/stereo/). All participants were informed of the stereo video and ROI images displaying procedure for each sequence, shown as Figure 9. And in the ranking stage after showing stereo video/images, they were asked to make a comparison on the four extracted ROIs and rank them from 1 to 4 for the ROIs shown on monoview LCD display based on their viewing experience of stereo video/images, where 1 indicates the best one (the ROI is most identical to their ROI impression) and 4 indicates the worst one (the ROI is least identical to their ROI impression).
With the ranking scores, the preference metrics of SVA scheme over other schemes are obtained. Then, Thurstone model and paired comparisons [41] have been adopted to analyze the performance of the four ROI extraction schemes.
Table 2shows thez-scores, Mean Opinion Score (MOS), and
its standard errors for four ROI extraction schemes with different test 3DVs. The proposed SVA-based ROI extraction scheme is set as 0 for reference and proper identification for thez-scores. Higherz-score indicates better performance and the best performance scheme for each sequence is shown in yellow shadow.
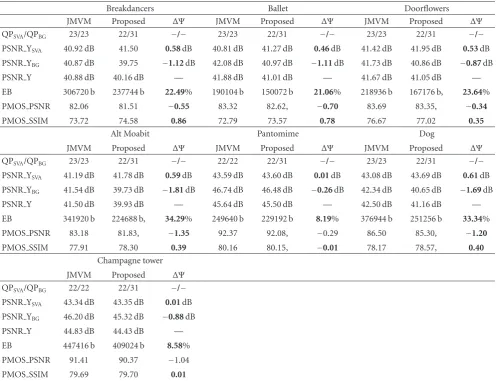
Table3: Objective image quality and coding bits corresponding toFigure 18.
Breakdancers Ballet Doorflowers
JMVM Proposed ΔΨ JMVM Proposed ΔΨ JMVM Proposed ΔΨ
QPSVA/QPBG 23/23 22/31 −/− 23/23 22/31 −/− 23/23 22/31 −/−
PSNR YSVA 40.92 dB 41.50 0.58dB 40.81 dB 41.27 dB 0.46dB 41.42 dB 41.95 dB 0.53dB
PSNR YBG 40.87 dB 39.75 −1.12dB 42.08 dB 40.97 dB −1.11dB 41.73 dB 40.86 dB −0.87dB
PSNR Y 40.88 dB 40.16 dB — 41.88 dB 41.01 dB — 41.67 dB 41.05 dB —
EB 306720 b 237744 b 22.49% 190104 b 150072 b 21.06% 218936 b 167176 b, 23.64%
PMOS PSNR 82.06 81.51 −0.55 83.32 82.62, −0.70 83.69 83.35, −0.34
PMOS SSIM 73.72 74.58 0.86 72.79 73.57 0.78 76.67 77.02 0.35
Alt Moabit Pantomime Dog
JMVM Proposed ΔΨ JMVM Proposed ΔΨ JMVM Proposed ΔΨ
QPSVA/QPBG 23/23 22/31 −/− 22/22 22/31 −/− 23/23 22/31 −/−
PSNR YSVA 41.19 dB 41.78 dB 0.59dB 43.59 dB 43.60 dB 0.01dB 43.08 dB 43.69 dB 0.61dB
PSNR YBG 41.54 dB 39.73 dB −1.81dB 46.74 dB 46.48 dB −0.26dB 42.34 dB 40.65 dB −1.69dB
PSNR Y 41.50 dB 39.93 dB — 45.64 dB 45.50 dB — 42.50 dB 41.16 dB —
EB 341920 b 224688 b, 34.29% 249640 b 229192 b 8.19% 376944 b 251256 b 33.34%
PMOS PSNR 83.18 81.83, −1.35 92.37 92.08, −0.29 86.50 85.30, −1.20
PMOS SSIM 77.91 78.30 0.39 80.16 80.15, −0.01 78.17 78.57, 0.40
Champagne tower
JMVM Proposed ΔΨ
QPSVA/QPBG 22/22 22/31 −/−
PSNR YSVA 43.34 dB 43.35 dB 0.01dB
PSNR YBG 46.20 dB 45.32 dB −0.88dB
PSNR Y 44.83 dB 44.43 dB —
EB 447416 b 409024 b 8.58%
PMOS PSNR 91.41 90.37 −1.04
PMOS SSIM 79.69 79.70 0.01
The middle four rows of the Table 2 show MOS of the ranking ROIs, in which smaller value indicates better performance. As far as MOS is concerned, similar results can be found. The proposed SVA-based ROI extraction scheme has the best performance as it has the lowest MOS for five test sequences and lowest average MOS. In the last four rows, standard errors for MOS are also illustrated. We can see that the deviation for SVA scheme (0.99 on average) is larger than ST-Scheme (0.77 on average). It is because the participants’ depth sensations vary from person to person. While viewing the stereo video and images, some non-expert viewers seem to be more sensitive to depth perception. On the contrary, expert viewers pay more attentions on motion, textural, or semantic areas because they are already familiar with the depth sensation.
6.3. SVA-based Regional Bit Allocation Optimization for MVC. To determine the optimalΔQP used in the MVC scheme, video coding experiments are implemented on JMVM7.0 [42] with MVC-HBP prediction structure, bQP and ΔQP are set as bQP ∈ {12, 17, 22, 27, 32, 37} and ΔQP ∈ {0, 2, 4, 6, 8, 10, 12}. Multiview video sequences, Ballet and
Breakdancers, are adopted because they have both slow and fast motion characteristic. Eight views and 91 frames in each view (6 GOPs while GOP length is 15) are encoded. Parameterη1andη2 are empirically set as 3 and 6 for first
and second level transitional areas.
Figure 10shows the relation maps ofRBSR(bQP, 0,ΔQP)
toΔQP for Ballet and Breakdancers sequences. More bit-rate can be saved asΔQP becomes larger. However, the gradient of
RBSR(bQP, 0,ΔQP) decreases as theΔQP increases, The
bit-rate saving ratio,RBSR(bQP, 0,ΔQP),obeys the exponential
decaying function described in (21). Besides, the gradient and up-boundary of RBSR(bQP, 0,ΔQP) decreases as bQP
0 2 4 6 8 10 12 −5
0 5 10 15 20 25 30 35 40
B
it
rat
e
sa
ving
ratio
(%)
bQP=12 bQP=17 bQP=22
bQP=27 bQP=32 bQP=37 ΔQP
(a) Breakdancers
0 2 4 6 8 10 12
0 10 20 30 40 50
B
it
rat
e
sa
ving
ratio
(%)
bQP=12 bQP=17 bQP=22
bQP=27 bQP=32 bQP=37 ΔQP
(b) Ballet Figure10: The relation maps of bit saving ratioRBSR(bQP,0,ΔQP) toΔQP.
10 15 20 25 30 35 40 0
2 4 6 8
Breakdancers Ballet Linear fit
T
ΔQP
Figure11: Relation map of bQP and coefficientT.
becoming saturated. As bQP increases, the velocity is getting faster. Then, we fit the obtained points in Figures11and12 using a linear and Boltzman function. ParametersT andA are expressed as
T=α1+β1·bQP,
A=α2+
β2
1 +e(bQP−r2)/ω2,
(31)
whereα1 = 6.27,β1 = −0.10,a2 = −2.75,β2 = −52.10,
r2=18.3 andω2=4.17.
10 15 20 25 30 35 40
Breakdancers Ballet −0.5
−0.4 −0.3 −0.2 −0.1 0
A
bQP
Boltzmann fit
Figure12: Relation map of bQP and coefficientA.
We use the PMOS PSNR index to evaluate the recon-structed image quality, that is, Qi,j in (22) is derived from (30), and Φ is PSNR Y. The average PMOS PSNR value to ΔQP is illustrated in Figure 13. Each line in the figure has one bQP but differentΔQP. We can see that the image quality evaluated by PMOS PSNR linearly decreases asΔQP increases. Besides, the slope of image quality degradation is getting flat as bQP increases.Figure 14shows the relation-ship between bQP and the coefficient b1, which indicates
the slope of image quality degradation, ΔD(bQP, 0,ΔQP). Each point in the figure is the coefficient b1 fitted from
0 2 4 6 8 10 12 66
68 70 72 74 76 78 80 82 84 86 88 90
PMOS
PSNR
bQP=12 bQP=17 bQP=22
bQP=27 bQP=32 bQP=37 ΔQP
(a) Breakdancers
0 2 4 6 8 10 12
68 70 72 74 76 78 80 82 84 86 88 90
Av
er
ag
e
P
M
O
S
PSNR
bQP=12 bQP=17 bQP=22
bQP=27 bQP=32 bQP=37 ΔQP
(b) Ballet Figure13: The relation maps of image quality toΔQP.
10 15 20 25 30 35 40 −0.35
−0.3 −0.25 2 −0.
−0.15 −0.1 −0.05 0
Breakdancers Ballet
Expontential decaying fit
b
1
bQP
Figure14: Relation map of bQP andb1.
points are the coefficients, b1, fitted from Ballet sequence
and the black points are fitted from Breakdancers sequence. We fit these points inFigure 14using exponential decaying function and obtain
b1=α3+β3e−bQP/γ3, (32)
whereα3= −0.05,β3= −6.57, andγ3=3.21.
Applying (31) and (32) to (27), optimalΔQP for different
μs is obtained, shown asFigure 15. The maximum point of ΔQP increases as μ decreases. However, the trends of the optimal ΔQP are similar for different scalingμs. We set μ
as 0.08 to scaleRBSRandΔDinto a same scale according to
10 15 20 25 30 35
2 3 4 5 6 7 8 9 10 11 12 13
Δ
QP
bQP
ΔQP(µ=0.06) ΔQP(µ=0.08) ΔQP(µ=0.10)
IntegerΔQP(µ=0.06) IntegerΔQP(µ=0.08) IntegerΔQP(µ=0.10)
Figure15: Optimal and integerΔQP for differentμs.
0 2000 4000 6000 8000 74
76 78 80 82 84 86 88
PMOS
PSNR
Bitrate/Kbps
(a) Breakdancers
0 1000 2000 3000 4000 5000 78
80 82 84 86 88
PMOS
PSNR
Bitrate/Kbps
(b) Ballet
0 1000 2000 3000 4000 5000 72
74 76 78 80 82 84 86 88
PMOS
PSNR
Bitrate/Kbps
(c) Doorflowers
0 1000 2000 3000 4000 5000 74
76 78 80 82 84 86 88 90
PMOS
PSNR
Bitrate/Kbps
(d) Alt Moabit
0 1000 2000 3000 4000 5000 6000 7000 8000 82
84 86 88 90 92 94 96 98
PMOS
PSNR
Bitrate/kbps
JMVM Proposed
(e) Pantomime
0 2000 4000 6000 8000 10000 12000 14000 76
78 80 82 84 86 88 90 92 94 96 98
PMOS
PSNR
Bitrate/Kbps
JMVM Proposed
(f) Dog
0 1000 2000 3000 4000 5000 6000 7000 8000 84
86 88 90 92 94 96 98
PMOS
PSNR
Bitrate/kbps
JMVM Proposed
(g) Champagne tower
Figure 16: Rate-distortion performances comparisons between the proposed MVC and JMVM (distortions are measured with PMOS PSNR).
because the encoding bits ofΔQP will increase along with the increasingΔQP. Therefore, it is reasonable to limitΔQP within the range from 2 to 4 at low bit rate (large bQP).
6.4. MVC Experiments. SVA-based MVC experiments are implemented on the JMVM 7.0 reference software with seven multiview video sequences and their ROI masks, Ballet, Breakdancers, Doorflowers, Alt Moabit, Pantomime, Champagne tower, and Dog, to evaluate the effectiveness of the proposed SVA-based bit allocation. The MVC-HBP pre-diction structure is adopted for MVC simulation. Eight views and GOP Length are 15, fast motion/disparity estimation is enabled, and search range is 64. There are three kinds of picture in the MVC-HBP prediction structure: intracoded picture (I-picture), interpredicted picture (P-picture), and hierarchical bidirectional predicted picture (B-picture). In the coding experiment, all B- and P-pictures are coded with regional bit allocation optimization and I-pictures are coded with original MVC scheme without bit allocation optimization. The bQP is set as 12, 17, 22, 27, or 32, and the QPs of background and ROI are set according to (16) and obtain optimal ΔQP in Figure 15. PMOS SSIM and PMOS PSNR are adopted to evaluate image quality of the reconstructed video frames.
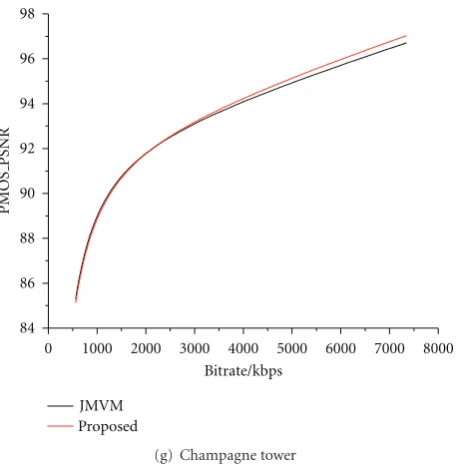
Figure 16 shows the rate-distortion curves of the
pro-posed MVC and JMVM, where the distortions are mea-sured with PMOS PSNR.Figure 17shows the rate-distortion curves of the proposed MVC and JMVM, where the distor-tions are measured with PMOS SSIM. Curves in the figures are fitted with the algorithm provided in [43]. As we can see from Figure 16, more than 10% bit rate is saved while maintaining the same PMOS PSNR for Breakdancers when bit rate is higher than 4 Mbps. For Ballet sequences, the
proposed scheme attains the same coding performance at low bit rate, but improves coding performance significantly at high bit rate, that is, more than 20% bit rate is saved at high bit rate. Similar results can be found for Doorflowers, Alt Moabit, Pantomime, Champagne tower, and Dog sequences. Also, as we can see from Figure 17 in which distortion is measured with PMOS SSIM, the proposed MVC scheme outperforms JMVM more distinctively, with 20%∼40% bit rate saving while maintaining the same PMOS SSIM, from low bit rate to high bit-rate for most of these test multiview video sequences.
Figure 18shows images reconstructed with the proposed
MVC scheme and the JMVM benchmark andTable 3shows the objective image quality value and coding bits correspond-ing to Figure 18. They show the reconstructed images of the 15th frame of the 2nd view (i.e., S1T15 in Figure 4) of the test 3DV sequences. Encoding bits and another five image quality indices including PSNR YSVA, PSNR YBG,
PSNR Y, PMOS SSIM, and PMOS PSNR are compared for each sequence. PSNR YSVA, PSNR YBG, and PSNR Y
denote the PSNR of illumination component for SVA-based ROI regions, background region, and the entire picture, respectively. PMOS PSNR and PMOS SSIM represent the PMOS of PSNR Y and SSIM, respectively. In addition, the differences of the bit-rate saving ratio and image quality indices are also given and they are computed using the following formulas:
ΔΨ=ΨProposed−ΨJMVM,
ΔEBi,j[%]=EB i,j
JMVM−EB i,j Proposed
EBiJMVM,j
×100[%],
0 1000 2000 3000 4000 5000 6000 7000 8000 67
68 69 70 71 72 73 74 75 76
PMOS
SSIM
Bitrate/Kbps
(a) Breakdancers
0 1000 2000 3000 4000 5000 69
70 71 72 73 74 75 76 77 78
PMOS
SSIM
Bitrate/Kbps
(b) Ballet
0 1000 2000 3000 4000 5000 74
75 76 77 78 79
PMOS
SSIM
Bitrate/Kbps
(c) Doorflowers
0 1000 2000 3000 4000 5000 74
75 76 77 78 79
PMOS
SSIM
Bitrate/Kbps
(d) Alt moabit
0 1000 2000 3000 4000 5000 6000 7000 8000 77.5
78 78.5 79 79.5 80 80.5 81 81.5
PMOS
SSIM
Bitrate/Kbps
JMVM Proposed
(e) Pantomime
0 2000 4000 6000 8000 10000 12000 14000 75
76 77 78 79 80 81 82
PMOS
SSIM
Bitrate/Kbps
JMVM Proposed
(f) Dog
0 1000 2000 3000 4000 5000 6000 7000 8000 78.5
79 79.5 80 80.5 81
PMOS
SSIM
Bitrate/Kbps
JMVM Proposed
(g) Champagne tower
Figure 17: Rate-distortion performances comparisons between the proposed MVC and JMVM (Distortions are measured with PMOS SSIM).
where Ψ ∈ {PSNR YSVA, PSNR YBG, PMOS PSNR,
PMOS SSIM}, ΔEBi,j is the bit-rate saving ratio for the proposed MVC scheme with respect to the encoded picture at (i,j) position of a GOP. EBJMVMi,j and EB
i,j
proposed denote
encoding bits of the coded pictures by using JMVM and the proposed MVC scheme, respectively.
Because people usually pay less attention to the back-ground regions and more attention to ROIs, HVS is less perceptible to distortion in the background regions than that of ROIs. This implies that people are more sensitive to distortions in the ROIs than in the background region. As a result, high image quality is required in ROIs. For Ballet multiview video sequence, ΔPSNR YSVA is 0.46 dB
whileΔPSNR YBG is −1.11 dB. It means that the proposed
SVA-based MVC scheme improves image quality of ROI up to 0.46 dB; meanwhile, to improve compression ratio, the proposed SVA-based MVC scheme allocates fewer bits on the background regions and at the cost of its PSNR YBG.
In the proposed MVC scheme, the image quality of ROIs is getting better than that of background region, that is, PSNR YSVA > PSNR YBG, which meets the requirements
of HVS. Thus, the quality of the reconstructed images is improved. While evaluated by the regional selective image quality metrics, ΔPMOS SSIM is 0.78 and ΔPMOS PSNR is −0.70. It means the difference between the qualities of reconstructed images coded by the proposed MVC scheme and JMVM is tiny and imperceptible. However, the important and interesting fact is that ΔEB2,15 is 21.06%,
which indicates that 21.06% bit rate saving is achieved by the proposed MVC scheme while comparing with JMVM benchmark. Similar results can also be found for Break-dancers, Doorflowers, Alt Moabit, and Dog sequence. For Pantomime and Champagne tower sequences, because the
background regions are very flat and smooth, MBs in these regions are coded with SKIP/DIRECT mode and only very few bits are allocated by original JMVM, thus, a relative low saving ratio, 8.19% and 8.58%, is achieved by the proposed MVC.
In summary, the proposed MVC scheme achieves sig-nificant bit-rate saving ratio, up to 21.06% ∼ 34.29%; meanwhile, the ROIs’ image quality is improved up to 0.46∼
0.61 dB at the cost of imperceptible quality degradation at background regions. Additionally, PSNR Y of ROI is better than that of background, which meets requirements of HVS. Moreover, the proposed MVC scheme can save over 20% bit rate with imperceptible image quality degradation according to the evaluation of region selective image quality metrics.
7. Conclusions
(a) Breakdancers
(b) Ballet
(c) Doorflowers
(e) Pantomime
(f) Dog
(g) Champagne tower
Figure18: Subjective and objective quality comparison of the reconstructed images (Left: JMVM, Right: Proposed).
the proposed bit allocation algorithm can achieve over 21.06% ∼ 34.29% bit-rate saving at high bit rate while maintaining the same objective image quality and subjective image qualities. Meanwhile, the image quality of ROIs is improved by 0.46 ∼ 0.61 dB at the cost of indiscriminate image quality degradation in background regions, which is less conspicuous and sensitive to human visual system. It can be foreseen that the stereoscopic visual attention will play a more important role in the areas such as content-oriented three-dimensional video processing, video retrieval, and computer vision in future.