Prediction of delamination growth in laminated
composites using acoustic emission and cohesive zone
modeling techniques
Milad Saeedifar*, Mohamad Fotouhi*, Mehdi Ahmadi najafabadi*1, Hossein Hosseini
Toudeshky**
*Non-destructive Testing Lab, Department of Mechanical Engineering, Amirkabir University of Technology, Tehran, Iran
**Department of Aerospace Engineering, Amirkabir University of Technology, Tehran, Iran
Abstract
Mode I delamination is the most common failure mode in laminated composite materials. Determination of the crack growth in this mode has a vital role in the damage tolerance analyses and structural health monitoring of the structures which suffer from this type of damage. The main objective of this paper is to determine position of the crack tip during propagation of mode I delamination in the glass/epoxy composite specimens. To this aim, experimental investigation by mechanical and Acoustic Emission (AE) data and Cohesive Zone Modeling (CZM) technique are utilized. The crack tip position is identified using three methods. In the first method, position of the crack tip is identified using visual observation of the crack tip during the test. The second method utilizes cumulative energy of the AE signals to predict the crack growth. Finite Element analysis based on a CZM theory is used as the third method to investigate delamination growth. Because of poor performance of CZM technique, modified CZM based on the R-curve results of the interlaminar fracture toughness is proposed to predict the delamination propagation. The results indicate that AE method and modified CZM technique have a good performance to detect initiation stage and also to determine the crack length in the laminated composite structures.
Keywords: Delamination, Acoustic Emission, Cohesive zone Modeling, Finite Element Method.
1. Introduction
The structural applications of polymer-matrix composite materials reinforced with
fibers are expanded owing to the mechanical properties of these materials. On the other
hand, the incidence of internal defects may considerably alter the stiffness and reduce the
strength and lifetime of the composites [1-2].
Delamination is one of the most common damages that can arise in layered composite
materials [3-7]. It can be caused by manufacturing faults or subsequent operational effects
such as impact loads, fatigue, etc. Better understanding of delamination behavior in
laminated composite materials will cause increasing usage of these materials. Delamination
is difficult to distinguish during inspection and the literature revealed that there has been an
increased interest in non-destructive testing (NDT) and Finite Element Methods (FEM) for
this damage [8-12].
Acoustic emission (AE) is a capable non-destructive technique to investigate the
delamination damage in laminated composite structures [13-15]. AE signals are high
frequency sound waves and are the results of the strain energy released within a material
following fracture [16]. AE is a real-time and in situ non-destructive testing method for
health monitoring of the composite structures. Each AE signal originated from the active
damage mechanisms has valuable information about the damages and can be considered as
the acoustic signature of them [17-18]. Many researchers have already used AE to
monitor microscopic events such as matrix cracking, fiber breakage, etc., during the
delamination. In addition, AE was used to predict the delamination growth in laminated
composite materials [22-23]. The results showed that AE method is capable of predicting
delamination growth during the tests. Other researchers [24-25] used AE to evaluate
interlaminar fracture toughness of the composites and they reported acceptable results.
Some studies have also been conducted to numerically investigate the delamination
damage in laminated composites [12, 26-28]. The techniques utilized for the numerical
simulation can be divided into two groups. The first group is based on the fracture
mechanics, whereas the second group analyzes the problem according to damage
mechanics principals [27]. Cohesive Zone Modeling (CZM) is in the second group and
often is used for simulation of initiation and propagation of delamination in laminated
composites. Some researchers [26-27] simulated delamination using CZM techniques and
they found that by adjusting the cohesive element parameters accurate results can be
achieved.
The objective of this paper is to investigate the initiation stage of delamination and to
determine position of the crack tip during propagation in the glass/epoxy laminated
composites using AE method and CZM technique. In this work the modified CZM is
represented to simulate the experimentally studied specimens more accurately. This is a
novel model which uses the R-curve results of the interlaminar fracture toughness to
simulate delamination growth behavior. The results of AE technique and the modified
CZM can be used to develop an effective design tool to predict both crack initiation and
growth to verify that subcritical cracks will not grow to critical lengths between periodic
2. Experimental Procedures
2.1 Materials and specimens preparation
The experimental work was carried out on the epoxy resin reinforced by the E-glass
unidirectional and woven fibers with the density of 1.17 g/cm3,390 g/m2 and 300 g/m2, respectively. The laminates were prepared by hand lay-up. The starter crack was formed by
inserting a Teflon film with a thickness of 20 μm at mid-plane during molding as an initial
crack for delamination. The laminated composite test specimens consist of a rectangular
shape and uniform thickness consists of 14 plies. Characteristics of the specimens used for
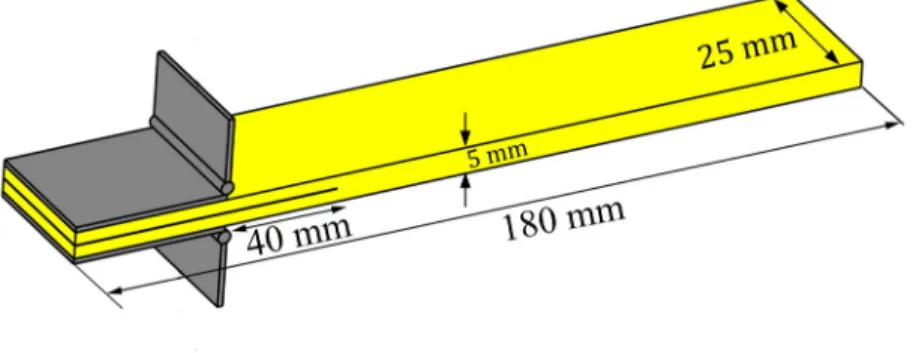
this study are illustrated in Fig. 1. For ease of working, the unidirectional specimen [0°] is
named U and the woven specimen [0°-90°] is named W.
Fig. 1Specimens geometry and dimensions
2.2 Test procedure
The tests are conducted according to ASTM D5528 standard [29]. The DCB test
were carried out at a temperature of 24°C and at a constant displacement rate of 3 mm/min.
The load and displacement were continuously measured and the crack length was recorded
using a digital video camera (SONY HDR-XR150) with 25X optical zoom and 300X
digital zoom. In order to investigate repeatability of the results, three samples were tested
for each condition.
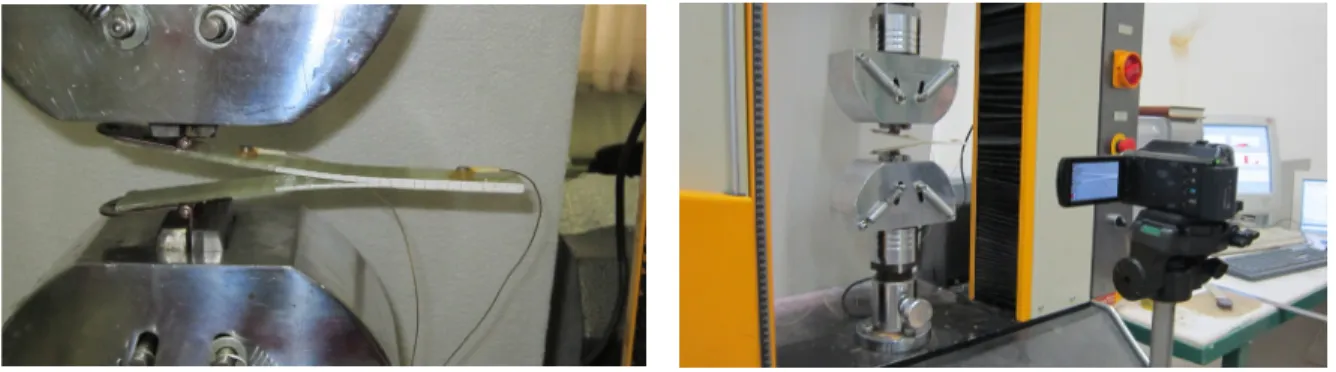
Fig. 2Experimental setup for specimens loading and the AE apparatus
2.3 Testing machine
A properly calibrated tensile test machine (HIWA) in the range from 0.5 to 500
mm/min was used in a displacement control mode with a constant displacement. All the
specimens were loaded with constant 3 mm/min crosshead rate.
2.4 AE device
AE events were recorded by using Acoustic Emission software AEWin and a data
acquisition system Physical Acoustics Corporation (PAC) PCI-2 with a maximum
sampling rate of 40 MHz. PICO which is a broadband, resonant-type, single-crystal
piezoelectric transducer from PAC, was used as the AE sensor. The sensor has a resonance
frequency of 513.28 kHz and an optimum operating range of 100–750 kHz. In order to
sensor was covered with grease. The signal was detected by the sensor and enhanced by a
2/4/6-AST preamplifier. The gain selector of the preamplifier was set to 37 dB. The test
sampling rate was 1 MHz with 16 bits of resolution between 10 and 100 dB.
3. Cohesive Zone Modeling
CZM is a technique in the framework of continuum damage mechanics that can predict
initiation and propagation of delamination in the laminated composites [27]. CZM
associates the tractions to the displacements at an interface where a crack may arise. The
behavior of cohesive element is expressed by a traction–displacement curve. Previous
research [30] illustrated that among the various constitutive curves employed for
traction-displacement curve (such as exponential, trapezoidal, bi-linear, etc.) of the cohesive
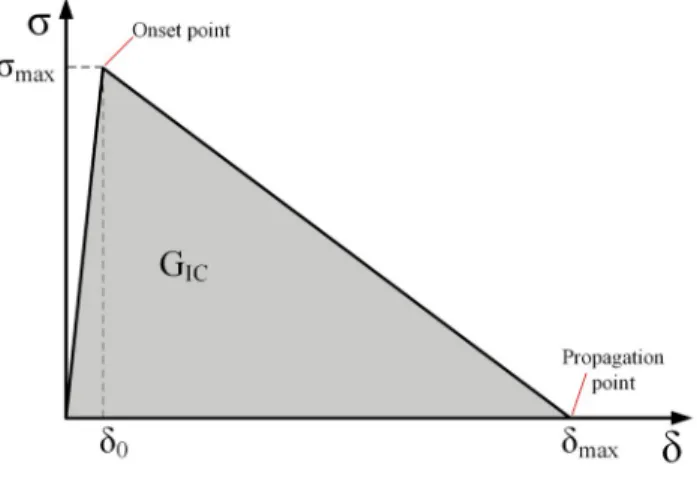
element, a bi-linear curve (See Fig. 3) has the best operation. The bi-linear curve has the
following features [28]:
a) An initial elastic region with the high stiffness (K) until the stress reaches to the
interface strength (σmax).
b) A following softening region until stress reaches to zero.
c) The area beneath the curve is equal to the interlaminar fracture toughness (GIC).
According to the above descriptions, when the stress of the cohesive element reaches
to the interface strength, crack initiates and when the area beneath the bi-linear curve is
Fig. 3 Bi-linear constitutive equation of cohesive element
4. Results and discussion
The results of investigated glass/epoxy DCB specimens are reported in bellow
sections.
4.1 Visual observation
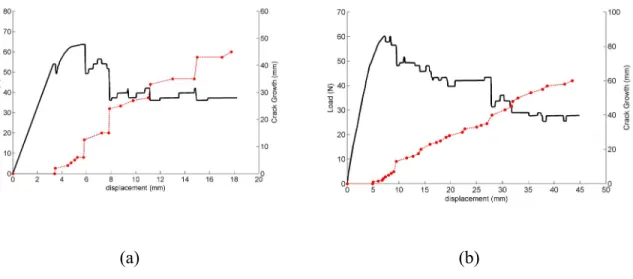
Figure 4 illustrates the load-displacement and crack growth-displacement curves for
specimens U and W. As it can be seen from Fig. 4.a, Propagation of delamination in
specimen U has a run-arrest behavior. At the arresting stage, the fiber bridging behind the
crack tip resists against delamination growth, therefore, the crack growth rate is slow. At
the running stage, the bridged fibers are broken and the crack propagates instantaneously.
According to Fig. 4.b, the crack growth behavior in specimen W is stable state compared
with specimen U. This is because of lower occurrence of the fiber-bridging phenomenon in
(a) (b)
Fig. 4 Load-displacement and crack length-displacement diagrams for specimen a) U and b) W.
4.2 Crack growth prediction using AE method
In this section, crack tip position in the specimens during the test is identified using AE
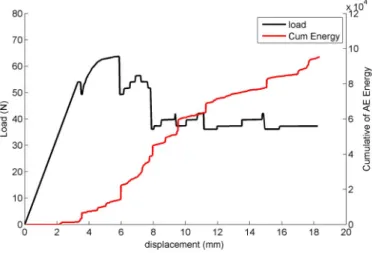
method. Figure 5 shows load and cumulative energy vs. displacement curves for specimen
U. By comparing Figures 5 and 4.a, crack growth and cumulative energy have a same
general trend and they have a linear relationship with displacement. Thus, according to Eq.
(1) crack growth can be related to the cumulative AE energy by a linear equation as follow:
(1)
Where A1, A2, A3, A4, A and B are the coefficient of the equations that are related to
the material properties and loading conditions. is the crack growth and CE is the
cumulative energy of the AE signals. Fig. 6 shows the linear relation between the crack
Fig. 5 Load-displacement and cumulative energy-displacement diagrams for specimen U
Figure 7 shows the predicted crack growth vs. visual crack growth curves for
specimens U and W. As it can be seen, this method could predict crack growth very well.
Fig. 7 predicted crack growth vs. visual crack growth curves for specimens a) U and b) W.
Table 1 shows average differences of the results that obtained by the AE method
compared with the visual method for specimens U and W.
Table 1 Average differences of the AE results for prediction of crack growth respects to visual results.
Specimens Average error (%)
U 3.3%
4.3 Crack growth prediction using CZM
In this section, delamination growth is predicted using FEM simulation based on CZM
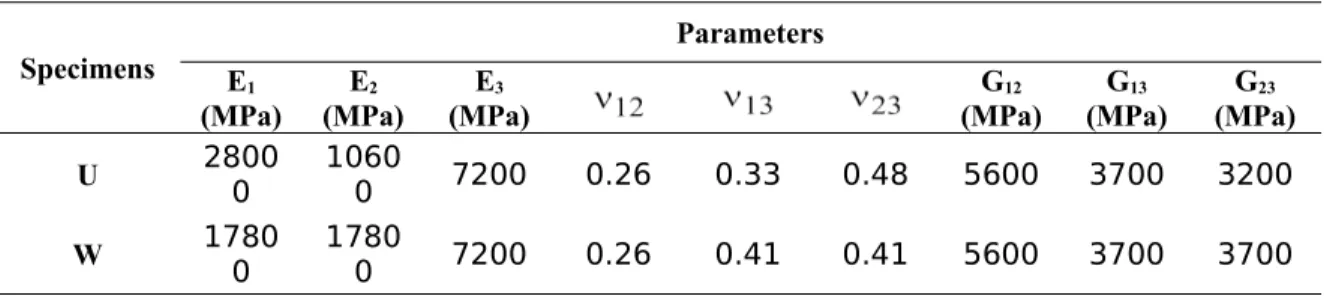
technique. The material properties of the specimens are listed in Table 2.
Table 2 The material properties of the specimens.
Parameters Specimens G 23 (MPa) G13 (MPa) G12 (MPa) E3 (MPa) E2 (MPa) E1 (MPa) 3200 3700 5600 0.48 0.33 0.26 7200 1060 0 2800 0 U 3700 3700 5600 0.41 0.41 0.26 7200 1780 0 1780 0 W
For composite section of the model, 2D, plane strain, continuum (solid) elements with
4 node and reduced integration formulation (CPE4R elements) are used. For the cohesive
section, 2D cohesive elements with 4node (COH2D4) are used.
CZM results are very sensitive to the element size and in order to obtain accurate
results very fine mesh must be utilized [26-28, 31-33]. Previous studies [26-28] indicated
that for accurate simulation, at least two elements must be inserted in the cohesive zone
length ahead the crack tip.
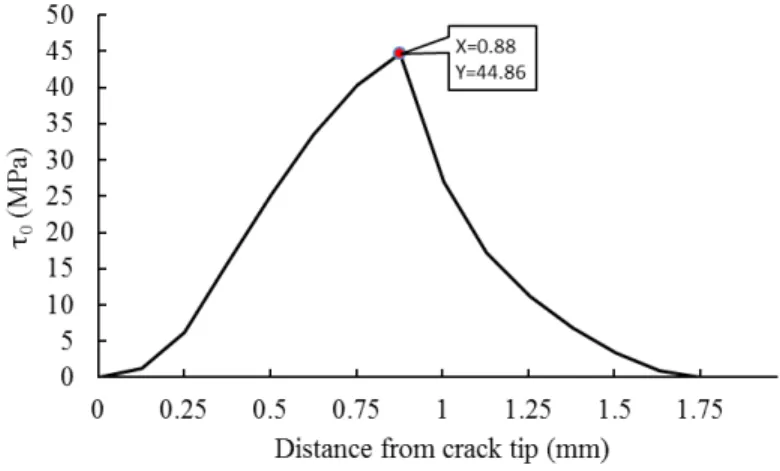
In order to determine the cohesive zone length ahead the crack tip, simulation is
performed by very small elements (0.125). For identifying the cohesive zone length, at the
point of first element failure, distribution of normal stress near the crack tip is plotted. The
distance from the crack tip to the point at which the stress reaches to the maximum value is
considered as the cohesive zone length (interface strength). Figure 8 shows the cohesive
value is accordance with the value obtained from theoretical formula (0.85 mm) and is in
agreement with the results of previous study [27].
Fig. 8 The cohesive zone length in specimen U.
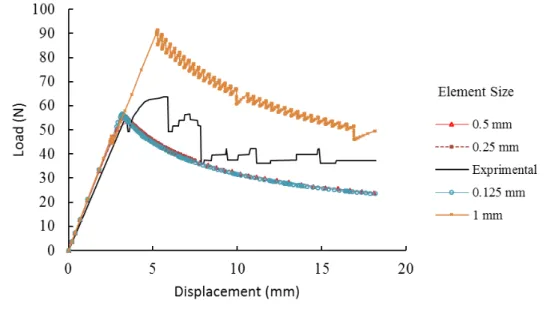
In order to investigate mesh refinement effects, several simulations are performed with
cohesive element length from 0.125 mm to 1 mm. Figure 9 shows the corresponding
load-displacement curves. The results indicate that when the element length is smaller than 0.5
mm, the predicted results converge to the experimental results. By increasing the element
size from 0.5 mm to 1 mm, the obtained results diverge. Using the cohesive zone length
obtained from Fig. 8 (0.88 mm), for mesh size smaller than 0.5 mm, more than two
elements are placed in the cohesive zone, while less than two elements are placed in the
cohesive zone for mesh size greater than 0.5 mm and is not sufficient for accurate
Fig. 9 Load- displacement curves for different element size.
The effects of interface strength are investigated by several simulations with interface
strengths from 2 MPa to 75 MPa and fixed element size (0.25 mm). Figure 10 shows the
corresponding load-displacement curves. As it is obvious, when the interface strength is 75
MPa, due to shrinkage of the cohesive zone, less than two elements are placed in the
cohesive zone, thus the results diverge. By reducing the interfacial strength, cohesive zone
expands, consequently, by using larger elements accurate results could be achieved. On the
other hand, drastic reduction of the interface strength (2 and 5 MPa) may change the stress
Fig. 10 Load- displacement curves for different values of interface strength.
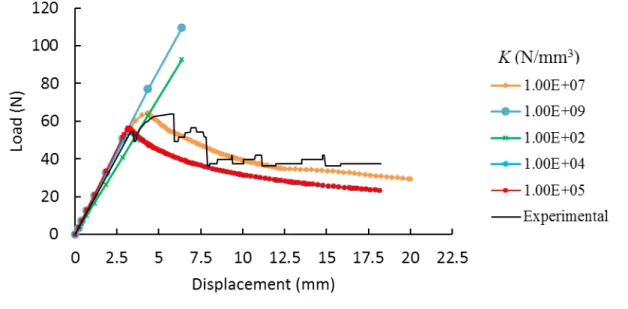
Figure 11 shows the results of several simulations which are carried out to evaluate
effects of the interface stiffness. In these simulations, interface stiffness is changed from
105 to 107 N/mm3 and the element length is 0.25 mm. As can be seen, for interface stiffness between 105 to 107 N/mm3, results of the simulation converge to the experimental results.
According to the obtained results, the parameters represented in Table 3 are used to
simulate delamination in the DCB specimens. Figure 12 shows distribution of S22 stress in
the specimen U.
Table 3 The parameters of cohesive elements for simulation of delamination in the specimens. Parameters
Cohesive element length
(mm) US WS
0.29 0.24
1e7 45
0.125
Fig. 12 Distribution of S22 stress in specimen U.
Figure 13 and 14 shows the load-displacement and crack growth- displacement curves
(a) (b)
Fig. 13 a) Load-displacement and b) crack growth-displacement, curves obtained from CZM and Experimental results for specimen U.
(a) (b)
Fig. 14 a) Load-displacement and b) crack growth-displacement curves obtained from CZM and Experimental results for specimen W.
As it can be seen, CZM could predict the initiation of delamination correctly. But,
differences between the predicted curves and experimental curves increases gradually. The
causes of these differences are occurrence of fiber bridging event in specimen U and crack
plane changing in specimen W (See Fig. 15), that CZM does not consider these events. In
other words, interlaminar fracture toughness of the specimens is not constant during the test
constant during the test. Figure 16 shows the R-curve of the interlaminar fracture toughness
(GR) for different crack growth values of specimen U.
Fig. 15 a) Fiber bridging in specimen U and b) Crack plane changing in specimen W.
By substituting of the GR values instead of one value as the GIC to the model by use of
the developed subroutines, simulation of the DCB specimens are repeated. Figures 17 and
18 show the corresponding results. As can be seen, the FEM results obtained from modified
CZM have a good accuracy and it can predict the initiation and propagation of the
delamination very well.
(a) (b)
Fig. 17 a) Load-displacement and b) crack growth-displacement, curves obtained from modified CZM and Experimental for specimen U.
(a) (b)
Table 4 shows average differences of the results that obtained by the CZM and
modified CZM methods compared with the visual method for determining the delamination
length during the tests.
Table 4 Average differences of CZM and Modified CZM results for prediction of crack growth
compared with the visual observations.
Specimens
Average error (%)
CZM Modified CZM
U 43% 8%
W 130% 13%
The results show that AE technique and the modified CZM are appropriate tools for
prediction of the delamination crack growth in laminated composite materials.
5. Conclusion
6. References
[1] W. Chen, Some Experimental Investigations in the Drilling of Carbon Fiber-Reinforced Plastic (CFRP) Composite Laminates, Int. J. Mach. Tools Manuf., 1997, 37(8), p 1097–1108
[2] S.R. Ravishankar and C.R.L. Murthy, Application of Acoustic Emission in Drilling of Composite Laminates, NDT&E Int., 2000, 33(6), p 429–435
[3] M. Kharazi, H.R. Ovesy, Postbuckling behavior of composite plates with through-the-width delaminations, Thin-Walled Structures, Volume 46, Issues 7–9, 2008, Pages 939–946.
[4] Venkateswaran Shanmugam, Ravi Penmetsa, Eric Tuegel , Stephen Clay, Stochastic modeling of delamination growth in unidirectional composite DCB specimens using cohesive zone models, Composite Structures, Volume 102, 2013, Pages 38–60.
[5] A.A. Bakhtiary Davijani, M. Hajikhani, M. Ahmadi, Acoustic Emission based on sentry function to monitor the initiation of delamination in composite materials, Materials & Design, Volume 32, Issue 5, May 2011, Pages 3059–3065.
[6] Quantian Luo, Liyong Tong, Calculation of Energy Release Rates for Cohesive and Interlaminar Delamination Based on the Classical Beam-adhesive Model, Journal of Composite Materials, 2009; vol. 43, 4: pp. 331-348.
[7] Gretchen B Murri, Effect of data reduction and fiber-bridging on Mode I
delamination characterization of unidirectional composites,Journal of Composite Materials, 2014; vol. 48, 19: pp. 2413-2424.
[8] A.B. de Morais, A.B. Pereira, M.F.S.F. de Moura, and A.G. Magalha˜es, Mode III, Interlaminar Fracture of Carbon/Epoxy Laminates Using the Edge Crack Torsion (ECT) Test, Compos. Sci. Technol., 2009, 69(5), p 670–676.
[10] S. Yashiro, J. Takatsubo, N. Toyama, An NDT technique for composite structures using visualized Lamb-wave propagation, Composites Science and Technology, Volume 67, Issues 15–16, December 2007, Pages 3202-3208.
[11] Guangkai Sun, Zhenggan Zhou, Application of laser ultrasonic technique for non-contact detection of drilling-induced delamination in aeronautical composite components, Optik - International Journal for Light and Electron Optics, Volume 125, Issue 14, July 2014, Pages 3608-3611.
[12] Silversides I, Maslouhi A, LaPlante G. Acoustic emission monitoring of interlaminar delamination onset in carbon fibre composites. Struct Health Monit 2013, DOI: 10.1177/1475921712469994.
[13] S. Benmedakhene, M. Kenane, M.L. Benzeggagh, Initiation and growth of delamination in glass/epoxy composites subjected to static and dynamic loading by acoustic emission monitoring, Composites Science and Technology Volume 59, Issue 2, February 1999, Pages 201–208.
[14] J. Bohse and A.J. Brunner, Acoustic Emission in Delamination Investigation, Delamination Behaviour of Composites, S. Sridharan, CRC Press, New York, 2008, p 217–277.
[15] Bakhtiary Davijani A.A, Hajikhani M, Ahmadi M. Acoustic Emission based on sentry function to monitor the initiation of delamination in composite materials. Mater Des 2011; 32(5): 3059–3065.
[16] R. K. Miller, Nondestructive Testing Handbook: Acoustic Emission Testing, 5 ed, American Society for Nondestructive Testing, 1987.
[17] Pashmforoush F, Fotouhi M, Ahmadi M. Damage Characterization of
Glass/Epoxy Composite under Three-Point Bending Test Using Acoustic Emission Technique. J Mater Eng Perform 2012; 21(7): 1380-1390.
[18] Arumugam V, Suresh Kumar C, Santulli C, Sarasini F, Joseph Stanley A. A Global Method for the Identification of Failure Modes in Fiberglass Using Acoustic Emission. J Test Eval 2011; 39(5).
[20] Fotouhi M, Heidary H, Pashmforoush F, Ahmadi Najafabadi M. Composite Materials Damage Characterization under Quasi-Static 3-Point Bending Test Using Fuzzy C-Means Clustering. Appl Mech Mater 2011; 110-116: 1221-1228.
[21] S. Huguet, N. Godin, R. Gaertner, L. Salmon, and D. Villard, Use of Acoustic Emission to Identify Damage Modes in Glass Fibre Reinforced Polyester, Compos. Sci. Technol., 2002, 62(10–11), pp 1433–1444.
[22] Romhany G, Szebényi G. Interlaminar fatigue crack growth behavior of
MWCNT/carbon fiber reinforced hybrid composites monitored via newly developed acoustic emission method. Express Polym Lett, 2012; 6(7): 572-580.
[23] Paget C.A. Delamination Location and Size by Modified Acoustic Emission on Cross-ply CFRP Laminates during Compression-Compression Fatigue Loading. ICCM17 proceedings, UK, 2009.
[24] A. Refahi Oskouei, A. Zucchelli, M. Ahmadi, and G. Minak, An Integrated Approach Based on Acoustic Emission and Mechanical Information to Evaluate the Delamination Fracture Toughness at Mode I, in Composite Laminate, Mater. Des., 2011, 32(3), p 1444–1455.
[25] Milad Saeedifar, Mohamad Fotouhi, Mehdi Ahmadi Najafabadi & Hossein Hosseini Toudeshky, Interlaminar Fracture Toughness Evaluation in Glass/Epoxy Composites Using Acoustic Emission and Finite Element Methods, Journal of Materials Engineering and Performance, DOI 10.1007/s11665-014-1291-2.
[26] Paul W. Harper, Lu Sun, Stephen R. Hallett, A study on the influence of cohesive zone interface element strength parameters on mixed mode behaviour, Composites: Part A, 43 (2012) 722–734.
[27] A. Turon, C.G. Da ´vila, P.P. Camanho, J. Costa, An engineering solution for mesh size effects in the simulation of delamination using cohesive zone models, Engineering Fracture Mechanics 74 (2007) 1665–1682.
[28] Paul W. Harper, Stephen R. Hallett, Cohesive zone length in numerical
[29] ASTM D5528-01, Standard Test Method for Mode I Interlaminar Fracture
Toughness of Unidirectional Fiber-Reinforced Polymer Matrix Composites, ASTM Standard, 2007, ASTM International, West Conshohocken, PA, 2007.
[30] G. Alfano, On the influence of the shape of the interface law on the application of cohesive-zone models, Composites Science and Technology, 66 (6) (2006), 723-730.
[31] V. Mollón, J. Bonhomme, A.M. Elmarakbi, A. Argüelles, J. Viña, Finite element modelling of mode I delamination specimens by means of implicit and explicit solvers, Polymer Testing 31 (2012) 404–410.
[32] H. Khoramishad, A.D. Crocombe, K.B. Katnam, I.A. Ashcroft, Fatigue damage modelling of adhesively bonded joints under variable amplitude loading using a cohesive zone model, Engineering Fracture Mechanics 78 (2011) 3212–3225. [33] Xiangqian Li, Stephen R. Hallett, Michael R. Wisnom, Predicting the effect of
through-thickness compressive stress on delamination using interface elements, Composites: Part A 39 (2008) 218–230.
List of Figure captions
Fig. 1 Specimens geometry and dimensions.
Fig. 2 Experimental setup for specimens loading and the AE apparatus. Fig. 3 Bi-linear constitutive equation of cohesive element.
Fig. 4 Load-displacement and crack length-displacement diagrams for specimen a) U and b) W.
Fig. 5 Load-displacement and cumulative energy-displacement diagrams for specimen U.
Fig. 6 Relation between crack growth and cumulative energy for specimen a) U and b) W.
Fig. 7 predicted crack growth vs. visual crack growth curves for specimens a) U and b) W.
Fig. 8 The cohesive zone length in specimen U.
Fig. 10 Load- displacement curves for different values of interface strength. Fig. 11 Load- displacement curves for different values of interface stiffness. Fig. 12 Distribution of S22 stress in specimen U.
Fig. 13 a) Load-displacement and b) crack growth-displacement, curves obtained from CZM and Experimental results for specimen U.
Fig. 14 a) Load-displacement and b) crack growth-displacement curves obtained from CZM and Experimental results for specimen W.
Fig. 15 a) Fiber bridging in specimen U and b) Crack plane changing in specimen W. Fig. 16 The R-curve of the interlaminar fracture toughness of specimen U.
Fig. 17 a) Load-displacement and b) crack growth-displacement, curves obtained from modified CZM and Experimental for specimen U.
Fig. 18 a) Load-displacement and b) crack growth-displacement, curves obtained from modified CZM and Experimental for specimen W.
List of Table captions
Table 1 Average differences of the AE results for prediction of crack growth respects to visual results.
Table 2 The material properties of the specimens.
Table 3 The parameters of cohesive elements for simulation of delamination in the specimens.