Current issues in the development of fetal growth
references and standards
Eric O. Ohuma1*, Tsi Njim2, Megan C. Sharps3
1 Nuffield Department of Obstetrics of Medicine, Centre for Tropical Medicine and Global Health, Oxford OX3 7BN, UK
2 Liverpool School of Tropical Medicine, Pembroke Place, Liverpool L3 5QA, United Kingdom. 3 Maternal and Fetal Health Research Centre, Division of Developmental Biology and Medicine, School of Medical Sciences, Faculty of Biology, Medicine and Health, University of Manchester, Manchester, UK, M13 9WL
Corresponding author* Dr. Eric O. Ohuma
Abstract
Purpose of Review:
This paper discusses the current issues in the development of fetal charts and is informed by a scoping review of studies constructing charts between 2012 and 2018.Recent findings:
The scoping review of twenty articles revealed that there is still a lack of consensus on how fetal charts should be constructed and whether an international chart that can be applied across populations is feasible. Many of these charts are in clinical use today and directly affect the identification of at-risk newborns that require treatment and nutritional strategies. However, there is no agreement on important design features such as inclusion and exclusion criteria; sample size and agreement on definitions such as what constitutes a healthy population of pregnant women that can be used for constructing fetal standards.Summary:
This paper therefore reiterates some of these current issues and the scoping review showcases the heterogeneity in the studies developing fetal charts between 2012 and 2018. There is no consensus on these pertinent issues and hence if not resolved will lead to continued surge of fetal reference and standard charts which will only exacerbate the current problem of not being able to make direct comparisons of fetal size and growth across populations.Important points:
- A scoping review of 20 studies between 2012 and 2018 showed several differences in the design considerations and methodologies for the development of fetal charts.
- Important study design features requiring consideration to produce these charts include: the type of approach, sampling methods, sample size and the definition of a healthy population of women.
- The current point arousing much debate around the construction of fetal growth charts is whether ethnicity plays a role in fetal growth and if it should be taken into account during the creation of these charts.
Introduction:
A reference or standard chart depicts a family of curves representing a few selected centiles of the distribution of some physical characteristic of the reference population as a function of age. Such charts allow an individual to be placed in the context of like individuals. Charts of measurements are useful for assessing humans at all stages: fetuses, neonates, children, and adults. Adolphe Quetelet (1796–1874) was the first to investigate the statistical properties of anthropometry and apply the concept of the normal distribution to anthropometry data (1). Francis Galton (1822 - 1911) introduced the use of percentile scores for comparing measurements with the normal distribution using data on attained height from birth to adulthood (2). A first application of this approach was in growth in height, which is normally distributed from birth to adulthood.
Fetal growth monitoring during pregnancy has been an important practice amongst obstetricians usually done to ascertain the health status of a fetus and relevant interventions may be provided when the health of a fetus is compromised (3, 4). Growth charts are intended to aid clinical judgements. Fetal growth charts are primarily used: to compare the size of a fetus with reference data when gestational age (GA) is known at a specified time (5); to estimate GA from fetal size (e.g., crown-rump length, and fetal head circumference are commonly used for this purpose) (6-8); and to assess a fetus’s rate of growth between two time points (velocity) (9, 10). For example, a fetus classified as being >97th centile according to an estimated fetal weight chart would prompt clinicians to either deliver early or consider a caesarean section to avoid complications that may be associated with delivering a large baby.
These differences in fetal growth charts with the need to be able to make direct comparisons were the motivation for the World Health Organisation (WHO) in 1995 to advocate for the creation of a single universal chart that could be used globally to assess fetal and child growth which reflects recent health and feeding recommendations of different populations and settings (13). This recommendation attracted several debates over the varying effects of various factors like environmental and genetic influences on fetal growth (14).
However, regardless of which growth chart is used clinically, there are design and methodological constructs that must be taken into consideration. To understand and summarise current issues in the developments of fetal references and standards, we did a quick review (by no means exhaustive) of studies published between 2012 and 2018 whose aim was to construct fetal references or standards. The review was aimed at understanding and highlighting the current debates and schools of thought regarding the development of fetal growth references and standards. We focussed on studies in the last 5 years as they represent a time period where three large prospective studies purposely designed to construct fetal growth charts for wide use were published i.e., the international fetal charts from the INTERGROWTH-21st Project (5), the WHO fetal growth charts intended for international application (15), and the National Institute of Child Health and Human Development fetal charts that were ethnic specific (16).
Scoping review
Search strategy:
Table 1: Search strategy
Search strategy
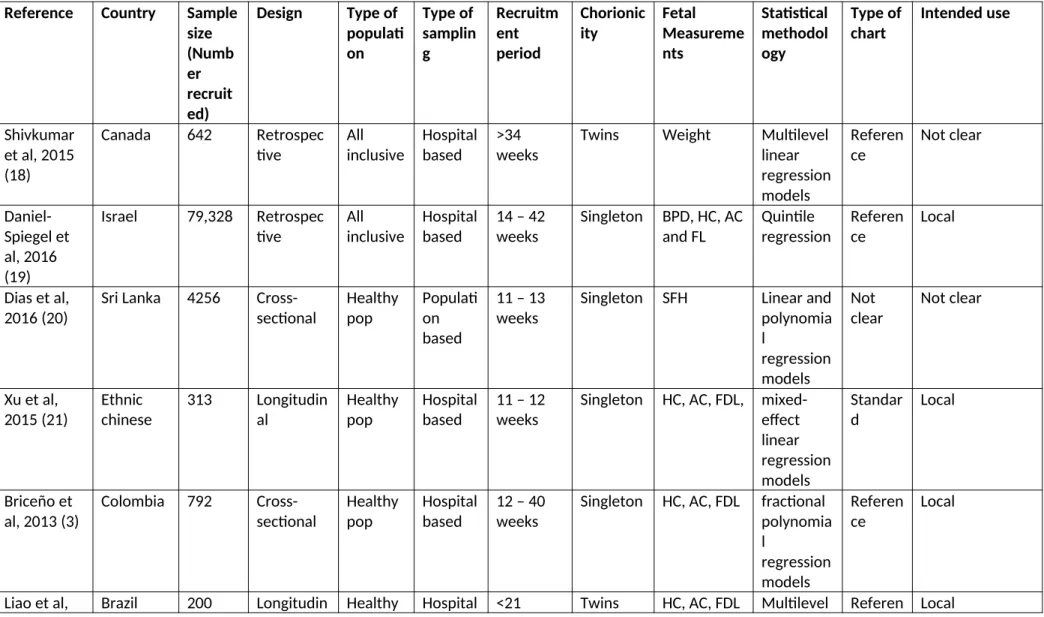
Table 2: Summary of the characteristics of the included studies
Reference Country Sample
size (Numb er recruit ed)
Design Type of
populati on Type of samplin g Recruitm ent period Chorionic ity Fetal Measureme nts Statistical methodol ogy Type of chart Intended use Shivkumar et al, 2015 (18)
Canada 642 Retrospec
tive All inclusive Hospital based >34 weeks
Twins Weight Multilevel linear regression models Referen ce Not clear Daniel-Spiegel et al, 2016 (19)
Israel 79,328 Retrospec tive
All inclusive
Hospital based
14 – 42 weeks
Singleton BPD, HC, AC and FL Quintile regression Referen ce Local
Dias et al, 2016 (20)
Sri Lanka 4256 Cross-sectional Healthy pop Populati on based
11 – 13 weeks
Singleton SFH Linear and polynomia l regression models Not clear Not clear
Xu et al, 2015 (21) Ethnic chinese 313 Longitudin al Healthy pop Hospital based
11 – 12 weeks
Singleton HC, AC, FDL, mixed-effect linear regression models Standar d Local Briceño et al, 2013 (3)
Colombia 792 Cross-sectional
Healthy pop
Hospital based
12 – 40 weeks
Singleton HC, AC, FDL fractional polynomia l regression models Referen ce Local
2012 (22) al pop based weeks regression analysis
ce
Gabbay-Benziv et al, 2017 (23)
USA 2161 Retrospec
tive All inclusive Hospital based <20 weeks
Twins FL, BPD, HC linear mixed model Referen ce Local Araujo Júnior et al, 2014 (24)
Brazil 31,476 Cross-sectional, retrospecti ve Healthy pop Hospital based <14 weeks
Singleton BPD, HC, AC, FL, EFW
polynomia l regression models Referen ce Local Araujo Júnior et al, 2014 (25)
Brazil 333
Cross-sectional, retrospecti ve Not clear Hospital based
14 – 38 weeks
Twin BPD, AC, FL and EFW polynomia l regression models Referen ce Local
Kwon et al, 2014 (26)
Korea 986
Cross-sectional
Healthy pop
Hospital based
15 – 19 weeks
Singleton BPD, HC, AC, FL, TL, HL, UL fractional polynomia l regression models Referen ce Local Buck Louis et al, 2015 (16)
USA 2,334 Longitudin
al
Healthy pop
Hospital based
8 – 13 weeks
Singleton BPD, HC, AC, FL, HL
linear mixed models with cubic splines Standar ds International/ ethnic-specific
Pay et al, 2017 (27)
Norway 42018 Retrospec tive All inclusive Hospital based All gestation al ages
Singleton SFH Non-linear regression of symphsio-fundal height Referen ce Local
Deter et al, 2016 (28)
USA 119 Longitudin
al Not clear Hospital based >17 weeks
MAC, FAV, FTV
modelling Jiang et al,
2013 (29) Ethnic chinese 6832 Cross-sectional Healthy pop Hospital based >16 weeks
Singleton BPD, AC, FL Polynomia l regression models Referen ce Local Sotiriadis et al, 2016 (30) Ethnic greek 1200 Longitudin al All inclusive Hospital based >16 weeks
Singleton BPD, HC, AC, FL, FTV
Polynomia l regression Referen ce Local Stirrup et al, 2015 (31)
England 2025 Retrospec tive All inclusive Hospital based >14 weeks
Twin BPD, HC, AC, FL Multilevel mixed-effects statistical models Referen ce Local
Rizzo et al, 2016 (32)
Italy 8070 Retrospec
tive All inclusive Hospital based First trimester
Singleton BPD, HC, AC, FL Quantile regression Referen ce Local/gender-specific Moety et al, 2015 (33)
Egypt 334
Cross-sectional
Healthy pop
Hospital based
20 – 41 weeks
Singleton FTV Multivaria ble linear regression model Referen ce Local Papageorgh iou et al, 2014 (5) Internatio nal 13108 Longitudin al Healthy pop Populati on based
9 – 14 weeks
Singleton HC, BPD, AC, FL, OFD
second-degree fractional polynomia l modelling Standar ds International Merialdi et al, 2017 (34) Internatio nal 1387 Longitudin al Healthy pop Hospital based First trimester
d
estimating equations method
Summary findings from the scoping review
Of the twenty studies, three aimed to develop fetal standards and were all longitudinal studies (the INTERGROWTH-21st project, the NICHD fetal growth studies and the WHO fetal study). Two of the three studies which established standards (the INTERGROWTH 21st project and the WHO fetal study were done in multiple countries while the NICHD fetal growth study was done only in the USA. The other seventeen studies were done in single countries: four in Europe, four in Asia, three in North America, four in South America, one in the Middle East and one in North Africa. The purpose of the study by Dias et al (20) was not clear and the remaining sixteen studies produced fetal reference charts. Four of the sixteen studies, which established references, were also longitudinal studies (16, 17, 22, 24) while the remaining twelve studies were all based on a cross-sectional design.
Similarly, the three large prospective studies that developed fetal standards differed in their definition of what they considered as healthy women. In brief, the NICHD Fetal Growth Studies carried out by Buck Louis et al excluded: women who smoked cigarettes or used illicit drugs in the past 6 or 12 months; who drunk ≥1 daily alcoholic drinks; had previous fetal congenital malformation; a history of non-communicable diseases (asthma requiring weekly medication, autoimmune disorders, cancer, diabetes mellitus, epilepsy or seizures requiring medication, hematologic disorders, hypertension, psychiatric disorders, renal disease, thyroid disease), or history of gravid diseases (gestational diabetes, severe preeclampsia/ eclampsia, or Haemolysis, Elevated Liver enzymes, Low Platelet count Syndrome) (16); while the WHO Fetal growth studies included women with no socioeconomic constraints, normal daily caloric intakes and normal BMI (34). For the Intergrowth 21st study, women were selected from urban areas located at low altitudes (<1600m). These areas were free from contaminants such as pollution, domestic smoke, radiation, and other toxic substances. The definition of a healthy population in this study was: no clinically relevant past medical history: no history of sexually transmitted diseases, no history of a previous pregnancy affected by pre-eclampsia/eclampsia, HELLP syndrome or a related pregnancy-associated condition, no clinically significant atypical red cell alloantibodies, negative urinalysis, systolic blood pressure <140 mmHg and diastolic blood pressure <90 mmHg and commenced antenatal care before 14 weeks of gestation. Optimal nutritional status defined as first trimester maternal height (≥153 cm), body-mass index (BMI; ≥18·5 and <30 kg/m2), and haemoglobin concentration (≥110 g/L) without receiving supplements or long-term medications (5).
We discuss some of the current issues in the development of fetal growth reference charts and standards in turn as informed by results of the scoping review of studies constructing fetal growth charts since 2012. These issues are by no means exhaustive but we believe represent some of key issues attracting debate in this field.
How charts are constructed – prescriptive vs descriptive approaches
One of the key differences in fetal growth charts is whether they are designed to be prescriptive or descriptive. Prescriptive charts describe the process of producing biological norms or a desirable target to be achieved or aspired to at individual and population levels (so as to construct growth standards). Prescriptive standards show how growth should occur, independent of time and place
the absence of factors known to affect fetal growth. For human growth, these are usually based on selected populations considered to be of optimal health (eg., adequate nutritional status and at low risk of abnormal growth) for example the WHO Multi-centre Growth Reference Study (MGRS) (37). Until recently, it was generally accepted that observed differences fetal growth were largely due to biological differences between different regions and ethnicities, resulting in a need for population-specific charts. This concept has been challenged by evidence demonstrating similarities in the genetic make-up of different non-isolated populations worldwide (38, 39), and more specifically by recent comparisons finding similarities in early and late linear fetal growth (40) in diverse populations.
In contrast, descriptive charts are commonly used to produce a reference chart that describes the anthropometry of a given population at a particular time and place, such as a hospital, region, or country. Descriptive reference charts are usually based on an unselected population with minimal exclusion criteria, for example, known risk factors for optimal health. Although they are used more widely, descriptive charts are only relevant to the source population. Different populations will differ in many aspects, such as rates of smoking during pregnancy, malaria, gestational diabetes, and maternal obesity, which can all affect newborn outcomes. In principle, following the descriptive approach requires separate reference charts for each sub-population of interest.
Many descriptive charts are constructed from fetal measurements as a function of gestational age (GA) of the specified population. An alternative type of descriptive chart is the customised chart. Customised growth charts are constructed following a multivariable analysis that accounts for maternal factors known to affect fetal growth such as age, weight, height, BMI, parity, ethnicity, sex of the fetus etc. or paternal factors such as height
(41)
. An example of such a chart is the gestation-related optimal weight curve (GROW) chart by Gardosi et al.,(41, 42)
. Unlike other fetal growth charts, the development of the customised charts does not need to exclude women based on their demographics as they are intended to be individualised and specific for each pregnant woman. The original computer-generated chart used data from 4179 births from a single hospital between 1989-1990 (42) by first obtaining the 10th, 50th, and 90th centiles at 40 weeks gestation and using a mathematical model to determine expected centiles at earlier gestations. The GROW chart was first constructed based on a UK population(42)
, and the charts have been used in multiple populations including; Australia(43)
, the United States of America(44)
and New Zealand(45)
.We summarise the three studies key characteristics and features:
1) The INTERGROWTH-21st Project was based on a prescriptive approach with an aim to construct a single fetal growth standard for each fetal biometry measurement for international use despite ethnic differences based on overwhelming evidence from the WHO-MGRS that growth amongst healthy populations in diverse geographical settings is similar (36). The INTERGROWTH-21st Project was a longitudinal study conducted across eight different geographical settings; Brazil (Pelotas), China (Beijing), India (Nagpur), Kenya (Nairobi), Oman (Muscat), UK (Oxford), USA (Seattle), and Italy (Turin) in healthy populations demonstrated to have minimal constraints on fetal growth. The participant selection involved defining free-living populations in defined geographic areas with evidence of adequate health outcomes in terms of maternal, perinatal and neonatal morbidity and mortality and then selecting healthy pregnant women with good nutritional statuses and low risk of pregnancy complications from the well-defined populations. The INTERGROWTH-21st project recruited over 4000 women prospectively for the construction of fetal standards. The study was conducted prospectively with recruitment carried out in the first trimester of pregnancy to ensure correct dating of the pregnancy. Follow-up antenatal ultrasound scans were performed every 5 weeks (± 1 week) by trained staff with identical ultrasound machines measuring both skeletal (head circumference, biparietal diameter, femur length and occipito-frontal diameter) and fat-based (abdominal circumference) growth measurement.
2) The WHO Fetal Growth Study is the fetal component of the WHO Multicentre Growth Reference Study, which aimed to establish growth charts for clinical use based on populations recruited from multiple countries - a similar aim to INTERGROWTH-21st Project (15). The WHO fetal study was a longitudinal prospective study of 1439 women recruited from ten countries i.e., Argentina, Brazil, Democratic Republic of the Congo, Denmark, Egypt, France, Germany, India, Norway, and Thailand (15). Similar to the INTERGROWTH-21st Project, the study was done prospectively with recruitment of women in the first trimester between 8 – 13 weeks, who had reliable information on their last menstrual period confirmed by an ultrasound scan of the crown–rump length. The women were then scheduled for follow-up ultrasound scans which were performed monthly. The WHO fetal study also measured both skeletal and fat-based growth measurement of: head circumference, estimated fetal weight, both femur and humerus length, abdominal circumference and biparietal diameter. The WHO fetal study focussed on the estimated fetal weight charts to evaluate variation due to country, maternal characteristics (age, height, weight, BMI, and parity), and sex of the fetus.
concept that one standard fits all. The study was, however, restricted to four self-reported ethnic groups of Asian, Hispanic, black, and white women in the USA. The study though prospective in nature, was a hospital-based, with women recruited from 12 centres within the USA, who did not have any constraints on fetal growth or development. In total 2,334 women were recruited onto the study, with analysis performed on 1737 pregnancies. The women were recruited prospectively in the first trimester confirmed by a dating scan and were divided into the aforementioned ethnic groups. The women were then allocated into an ultrasound schedule that was designed to capture weekly fetal growth assessment data without subjecting all the women to weekly ultrasound scanning. As such, each woman attended five follow up appointments. Similarly, both skeletal and fat-based measurements were undertaken; crown rump length, head circumference, biparital diameter, abdominal circumference and both the femur and humerus length until delivery.
Attained size versus growth - utility of fetal growth charts
There is a subtle difference between the growth of a fetus and the size of a fetus. In principle, size relates to measurements at a specific time, whereas growth relates to a change in size over time. Whilst fetal growth is evaluated from longitudinal measurements i.e., a series of anthropometric measurements made of each fetus at multiple time points (46-49), fetal size is determined at a single time point (35, 50, 51). However, the term fetal growth is often used to describe both of these measurements and is thus sometimes used inappropriately (50, 52) as fetuses which are determined to have abnormal growth may actually be normal in attained size (53). Longitudinal studies can therefore be used to produce both attained size and growth charts are used in different clinical applications, and have different interpretations.
Population-based sampling versus hospital-based sampling
countries (36). This could also be a potential source of bias in several low-income countries were a substantial number of women do not visit hospitals for pregnancy-related monitoring, prenatal and postnatal care.
Period of inclusion – pregnancy dating
The period of inclusion of the women into the study is also an important methodological consideration. For example, during the first trimester of pregnancy, there is less variability in fetal growth. Women recruited during this period using the first day of the last menstrual period could have this information confirmed using ultrasonographical evidence by measurement of the crown-rump length as it has been shown to be most reliable between between 9+0 to 13+6 weeks gestation, but not beyond this range (54) and considered an essential part of routine antenatal care. Recruitment after the first trimester, leads to difficulties in ascertaining of accurate dating for estimating the expected date of delivery. A reliable estimate of gestational age is key as it underpins clinical care and allows the expected delivery date to be estimated accurately, and also necessary for developing reference charts. Newborn outcomes such as preterm birth, small-for-GA, large-for-GA, and appropriate-for-GA are all dependent on having an accurate estimate of GA.
Study design – longitudinal, cross-sectional, and mixed designs
In contrast, a mixed design incorporates both longitudinal and cross-sectional measurements i.e., some participants are studied longitudinally and others cross-sectionally therefore for any given participant, the number of measurements included may be one or greater. A mixed design can be useful for studying growth intensively in periods of rapid growth using a longitudinal design and less intensively in periods of slow growth using a cross-sectional design. This may be an efficient, cost-effective approach especially for multicentre studies. An example is the WHO-Multi-centre Growth Reference Study (MGRS), which combined a longitudinal study design from birth to 24 months with a cross-sectional study of children aged 18 to 71 months (56). A mixed design is also likely to arise when using routine data collected from individuals requiring close monitoring who are seen more than once.
Statistical considerations
Appropriate statistical methodology is key to the construction of fetal growth references and standards. A desirable feature of fetal charts is that centiles change smoothly with GA, and that the selected statistical methodology for fitting centiles provide a good fit to the raw data (47, 48, 57). Some of the key statistical considerations include: (a) an assessment of whether the normality assumption is reasonable, as is usually the case for fetal data conditional on GA; (b) accounting for the increasing variability with gestation that is typical in fetal growth data; and (c) a goodness-of-fit assessment with graphical evaluation of the superimposed centiles should be conducted to compare the predictive model to the raw data.
Sample size
There is very limited literature on what to consider when determining the sample size of fetal growth studies (58-61). A systematic review of the methodology used in published ultrasound studies for developing size or pregnancy dating charts found that only 6 of 83 published ultrasound growth or size charts included their sample size calculations in the description of their methodology (62, 63).
estimating sample size for regression-based reference ranges were first proposed by Royston (59) and later extended by Bellera and Hanley (58). In 2011, Hanley and Moodie (70) proposed a unified approach for sample size, precision and power calculations that considers various study designs. Later in 2016, Hanley (61) discusses sample size considerations for the case of simple and multiple linear regressions. Regression analysis can be used to obtain reference limits that account for factors such as age, gender, and parity with corresponding confidence intervals (CIs) (71-74).
Precision and power are the key factors in the determination of sample size for constructing reference charts in addition to study design (longitudinal, cross-sectional, or mixed), number of repeated measurements per individual, existence of replicate measurements, and practicality (cost, time and manpower) (75). The precision of estimated centiles is inherently variable. Extreme centiles exhibit large imprecision because there are few observations at the extreme ends of the distribution, while the median has the greatest precision. For normally distributed unreplicated data, the standard error of the pth centile is obtained from the standard formula for the variance of a centile: SEp = SD√¿(1 + 1
2zp 2
) / n], (76)
where SE is the standard error, SD is the standard deviation of the measurement (which will increase with GA), zp is the value of the standard normal distribution corresponding to the pth centile, and n is the sample size. For example, for the 2.5th or 97.5th centiles, zp = ±1.96, giving SE = 0.08 SD with a sample size of 500 and 0.03 SD for a sample of 4,000. More extreme centiles will require a larger sample size to estimate than less extreme ones for the same precision. It is also advisable and common practice to inflate the calculated sample size by the expected percentage of attrition for the specific setting.
In general, longitudinal studies are more efficient and have greater power than cross-sectional studies. Royston (1995) defined this efficiency as the design factor, D, which is the number of fetuses in a cross-sectional study that would give the same precision as one fetus in a longitudinal study. He used a simulation study of ultrasound-based biparietal diameter and compared the variance of a centile in longitudinal and equivalent cross-sectional designs. He calculated the design factor (effect) to be ~2.3 (77). A longitudinal study thus requires approximately half to a third the sample size of a cross-sectional study to estimate a given centile with the same precision depending on the number of measurements per fetus. In the case of sub-groups or multi-centre studies, a sufficient power may be required in order to explore ethnic-specific (i.e. site-specific) charts.
Most studies aiming to construct fetal growth references are done in a single centre. The need for a large sample size and greater generalisability leads naturally to a multicentre design, which brings additional challenges. As multicentre studies are rare in human growth studies, the combinability problem is not common. However, the MGRS, INTERGROWTH-21st Project, NICHD, and WHO fetal study were multicentre studies and so faced this problem. Statistical significance is not appropriate for judging combinability, as even unimportant differences can be statistically significant especially in very large samples. Assessing how appropriate it is to pool data from multiple sites is challenging, as a judgment of the similarities in the fetal growth size patterns across the populations must be made. The combinability of studies in a meta-analysis is usually judged qualitatively using the similarity of the studies, such as the similarity of the participants, interventions, and outcome variables. This is akin to the standardised and careful section process employed by the studies which strives to ensure similarity of women selected from different sites. Judgments on similarity of data from different sites depends on quantifying the differences and variability inherent in the data for which there is no standard statistical approach for evaluating what is an acceptable level of agreement.
Some considerations on how to make judgments on similarity of data include: defining a priori a threshold of acceptable differences based on clinical knowledge for judging whether the differences between the centile curves from each site are acceptable before conducting the analysis, conducting a sensitivity analysis of the inclusion/exclusion of specific data to the overall fitted centiles, quantifying the amount of variability that can be attributed to site differences and defining a priori what differences are considered acceptable based on clinical impact or meaningfulness.
Concluding remarks
In this paper we have discussed some of the current developments and debates in the construction of fetal references and standards. We have highlighted some issues regarding how fetal growth reference charts are constructed (prescriptive and descriptive approaches), study design and methodological considerations for constructing reference centile charts. Important design features such as inclusion and exclusion criteria, sample size determination, gestational age (GA) estimation, and handling of data from multiple sites for multi-centre studies are seldom well addressed, considered or reported.
As many of these charts are in clinical use today and directly affect the identification of at-risk newborns that require treatment and nutritional strategies, the establishment of fetal biometric charts for use require careful methodological considerations. The observations by David Barker in the late 1980’s, on the association between early growth parameters such as birthweight and the risk of disease in later life (81, 82) leading to the famous “Barker’s hypothesis” reiterates how crucial and important the first 1000 days of life is. They confirmed the already-overwhelming evidence that fetal growth disorders are risk factors for adverse perinatal outcomes and can predispose infants to adult chronic diseases (83-87). These findings on early fetal programming and associated risk of disease in adulthood stimulated lots of interest among researchers culminating into the formation of an international society for developmental origins of health and disease (DOHaD). This is particularly important as there is still ongoing debate on whether a single growth standard chart can be used internationally (4). Those who argue against this suggest significant differences between racial/ethnic constructs sufficient enough for the production of racial/ethnic-specific charts for use in fetal growth monitoring implying a significant influence of a genetic component in fetal growth patterns existing across ethnicities. Proponents for a single growth standard for international use argue that differences observed in fetal growth patterns arise mainly due to socioeconomic factors like nutritional status and environmental exposures (36).
eight diverse populations following similar methodology, recruitment, standardisation and demonstrated that there was great similarity in fetal growth among healthy women who were well nourished and lived in good environments. The NICHD study hypothesised that there are differences in fetal growth by ethnicity and therefore aimed to construct ethnic specific charts. Gardosi et al have always argued for the need of customised charts that account for a woman’s characteristics that are known to affect growth such as height, weight, BMI and have constructed charts that include these variables.
References
Papers of particular interest, published recently, have been highlighted as:
• Of importance
•• Of major importance
1. Cole TJ. The development of growth references and growth charts. Annals of human biology. 2012;39(5):382-94.
2. Jensen AR. Galton's legacy to research on intelligence. Journal of biosocial science. 2002;34(2):145-72.
3. Briceno F, Restrepo H, Paredes R, Cifuentes R. Charts for fetal age assessment based on fetal sonographic biometry in a population from Cali, Colombia. J Ultrasound Med. 2013;32(12):2135-43. 4. Grantz KL, Hediger ML, Liu D, Buck Louis GM. Fetal growth standards: the NICHD fetal growth study approach in context with INTERGROWTH-21st and the World Health Organization Multicentre Growth Reference Study. Am J Obstet Gynecol. 2018;218(2S):S641-S55 e28.
5. ●● Papageorghiou AT, Ohuma EO, Altman DG, Todros T, Cheikh Ismail L, Lambert A, et al. International standards for fetal growth based on serial ultrasound measurements: the Fetal Growth Longitudinal Study of the INTERGROWTH-21st Project. Lancet. 2014;384(9946):869-79. This was a large longitudinal study of over 4000 women recruited from eight geographically diverse populations. Ultrasound measurements were collected in triplicate with each women seen between 4-6 times during pregnancy and measurements were done using standardised tools and equipment. The study is based on a prescriptive approach where women recruited were deemed to be healthy, well-educated, well-nourished and living in environments that are free of factors known to affect fetal growth. The study constructed international fetal standards based on all the ultrasound data from the eight recruiting sites.
of crown–rump length in the first trimester of pregnancy. Ultrasound in Obstetrics & Gynecology. 2014;44(6):641-8.
8. Altman DG, Chitty LS. New charts for ultrasound dating of pregnancy. Ultrasound in Obstetrics and Gynecology. 1997;10(3):174-91.
9. Owen P, Donnet ML, Ogston SA, Christie AD, Howie PW, Patel NB. Standards for ultrasound fetal growth velocity. BJOG: An International Journal of Obstetrics & Gynaecology. 1996;103(1):60-9. 10. Bertino E, Di Battista E, Bossi A, Pagliano M, Fabris C, Aicardi G, et al. Fetal growth velocity: kinetic, clinical, and biological aspects. Archives of Disease in Childhood - Fetal and Neonatal Edition. 1996;74(1):F10-F5.
11. Ioannou C, Talbot K, Ohuma E, Sarris I, Villar J, Conde Agudelo A, et al. Systematic review of‐ methodology used in ultrasound studies aimed at creating charts of fetal size. BJOG: An International Journal of Obstetrics & Gynaecology. 2012;119(12):1425-39.
12. Salomon LJ, Bernard JP, Duyme M, Buvat I, Ville Y. The impact of choice of reference charts and equations on the assessment of fetal biometry. Ultrasound Obstet Gynecol. 2005;25(6):559-65. 13. WHO Working Group on Infant Growth. An evaluation of infant growth: the use and interpretation of anthropometry in infants. Bull World Health Organ. 1995;73:165-74.
14. Lunde A, Melve KK, Gjessing HK, Skjærven R, Irgens LM. Genetic and Environmental Influences on Birth Weight, Birth Length, Head Circumference, and Gestational Age by Use of Population-based Parent-Offspring Data. American Journal of Epidemiology. 2007;165(7):734-41. 15. ●● Kiserud T, Piaggio G, Carroli G, Widmer M, Carvalho J, Neerup Jensen L, et al. The World Health Organization Fetal Growth Charts: A Multinational Longitudinal Study of Ultrasound Biometric Measurements and Estimated Fetal Weight. PLOS Medicine. 2017;14(1):e1002220. This was a multinational prospective observational longitudinal study of fetal growth in a healthy population of pregnant women with no constraints on fetal growth from ten countries (Argentina, Brazil, Democratic Republic of the Congo, Denmark, Egypt, France, Germany, India, Norway, and Thailand). A total of 8,203 sets of ultrasound measurements which were analyzed for outliers were used to provide fetal growth charts for estimated fetal weight and ultrasound biometric measurements for global use.
16. ●● Buck LGM, Grewal J, Albert PS, Sciscione A, Wing DA, Grobman WA, et al. Racial/ethnic standards for fetal growth: the NICHD Fetal Growth Studies. Am J Obstet Gynecol. 2015;213(4):449 e1- e41. This was a prospective study where 2,334 healthy women were recruited in the United States and randomized among four schedules during which in-person interviews and anthropometric assessments were conducted. The fetuses of 1,737 of the 2334 women who were consistently low-risk throughout the pregnancy were included in the development of the foetal growth standards. The authors declared that significant differences in fetal growth were found among four racial/ethnic groups (non-Hispanic whites, non-Hispanic Blacks, Hispanics and Asians) and that these racial/ethnic-specific standards could improve precision in the evaluation and monitoring of fetal growth.
17. Ioannou C, Talbot K, Ohuma E, Sarris I, Villar J, Conde-Agudelo A, et al. Systematic review of methodology used in ultrasound studies aimed at creating charts of fetal size. BJOG. 2012;119(12):1425-39.
19. Daniel-Spiegel E, Mandel M, Nevo D, Ben-Chetrit A, Shen O, Shalev E, et al. Fetal Biometry in the Israeli Population: New Reference Charts. Isr Med Assoc J. 2016;18(1):40-4.
20. Dias T, Abeykoon S, Kumarasiri S, Gunawardena C, Pragasan G, Padeniya T, et al. Symphysis-pubis fundal height charts to assess fetal size in women with a normal body mass index. Ceylon Med J. 2016;61(3):106-12.
21. Xu Y, Lek N, Cheung YB, Biswas A, Su LL, Kwek KY, et al. Unconditional and conditional standards for fetal abdominal circumference and estimated fetal weight in an ethnic Chinese population: a birth cohort study. BMC Pregnancy Childbirth. 2015;15:141.
22. Liao AW, Brizot Mde L, Kang HJ, Assuncao RA, Zugaib M. Longitudinal reference ranges for fetal ultrasound biometry in twin pregnancies. Clinics (Sao Paulo). 2012;67(5):451-5.
23. Gabbay-Benziv R, Crimmins S, Contag SA. Reference Values for Sonographically Estimated Fetal Weight in Twin Gestations Stratified by Chorionicity: A Single Center Study. J Ultrasound Med. 2017;36(4):793-8.
24. Araujo Junior E, Martins Santana EF, Martins WP, Junior JE, Ruano R, Pires CR, et al. Reference charts of fetal biometric parameters in 31,476 Brazilian singleton pregnancies. J Ultrasound Med. 2014;33(7):1185-91.
25. Araujo Junior E, Ruano R, Javadian P, Martins WP, Elito J, Jr., Pires CR, et al. Reference charts for fetal biometric parameters in twin pregnancies according to chorionicity. Prenat Diagn. 2014;34(4):382-8.
26. Kwon JY, Park IY, Wie JH, Choe S, Kim CJ, Shin JC. Fetal biometry in the Korean population: reference charts and comparison with charts from other populations. Prenat Diagn. 2014;34(10):927-34.
27. Pay ASD, Froen JF, Staff AC, Jacobsson B, Gjessing HK. Symphysis-fundus measurement - the predictive value of a new reference curve. Tidsskr Nor Laegeforen. 2017;137(10):717-20.
28. Deter RL, Lee W, Sangi-Haghpeykar H, Tarca AL, Li J, Yeo L, et al. Personalized third-trimester fetal growth evaluation: comparisons of individualized growth assessment, percentile line and conditional probability methods. J Matern Fetal Neonatal Med. 2016;29(2):177-85.
29. Jiang X, Zhang YH, Li Y, Ma X, Zhu YS, Shang L. Reference charts and equations of fetal biometry for normal singleton pregnant women in Shaanxi, China. Clin Exp Obstet Gynecol. 2013;40(3):393-8.
30. Sotiriadis A, Eleftheriades M, Chatzinikolaou F, Hassiakos D, Chrousos GP, Pervanidou P. National curves of foetal growth in singleton foetuses of Greek origin. Eur J Clin Invest. 2016;46(5):425-33.
31. Stirrup OT, Khalil A, D'Antonio F, Thilaganathan B, Southwest Thames Obstetric Research C. Fetal growth reference ranges in twin pregnancy: analysis of the Southwest Thames Obstetric Research Collaborative (STORK) multiple pregnancy cohort. Ultrasound Obstet Gynecol. 2015;45(3):301-7.
32. Rizzo G, Prefumo F, Ferrazzi E, Zanardini C, Di Martino D, Boito S, et al. The effect of fetal sex on customized fetal growth charts. J Matern Fetal Neonatal Med. 2016;29(23):3768-75.
34. Merialdi M, Widmer M, Gulmezoglu AM, Abdel-Aleem H, Bega G, Benachi A, et al. WHO multicentre study for the development of growth standards from fetal life to childhood: the fetal component. BMC Pregnancy Childbirth. 2014;14:157.
35. Bertino E, Milani S, Fabris C, De Curtis M. Neonatal anthropometric charts: what they are, what they are not. Archives of disease in childhood Fetal and neonatal edition. 2007;92(1):F7-F10. 36. Papageorghiou AT, Kennedy SH, Salomon LJ, Altman DG, Ohuma EO, Stones W, et al. The INTERGROWTH-21(st) fetal growth standards: toward the global integration of pregnancy and pediatric care. Am J Obstet Gynecol. 2018;218(2S):S630-S40.
37. ●● WHO Multicentre Growth Research Study Group. WHO Child Growth Standards based on length/height, weight and age. Acta Paediatr Suppl. 2006;450:76-85. This paper described the study design and statistical methods used to construct the WHO Child Growth Standards for the production of fetal growth charts from an international sample (ten countries) of infants from healthy mothers who had no constraint of fetal growth. The authors used the “Box-Cox power exponential (BCPE) method, with curve smoothing by cubic splines” to construct the curves. The overall conclusion was the possibility to use the resulting generated standards to assess children globally irrespective of geographical location and ethnicity as long as environmental conditions were adequate.
38. Hellenthal G, Busby GB, Band G, Wilson JF, Capelli C, Falush D, et al. A genetic atlas of human admixture history. Science. 2014;343(6172):747-51.
39. Prüfer K, Racimo F, Patterson N, Jay F, Sankararaman S, Sawyer S, et al. The complete genome sequence of a Neanderthal from the Altai Mountains. Nature. 2014;505(7481):43-9.
40. ●● Villar J, Papageorghiou AT, Pang R, Ohuma EO, Ismail LC, Barros FC, et al. The likeness of fetal growth and newborn size across non-isolated populations in the INTERGROWTH-21st Project: the Fetal Growth Longitudinal Study and Newborn Cross-Sectional Study. The Lancet Diabetes & Endocrinology. 2014;2(10):781-92. This study used two INTERGROWTH-21(st) components [The Fetal Growth Longitudinal Study (FGLS) where the primary markers of fetal growth were ultrasound measurements of fetal crown-rump length and the population-based Newborn Cross-Sectional Study (NCSS), which measured birthlength in all newborn babies]. Using variance component analysis, it was determined that between 1·9% and 3·5% of the total variability in fetal measurements could be attributed to between-site differences showing that fetal growth and newborn length are similar across diverse geographical settings in healthy populations.
41. Gardosi J. Customised assessment of fetal growth potential: implications for perinatal care. Archives of Disease in Childhood - Fetal and Neonatal Edition. 2012;97(5):F314-F7.
42. ●● Gardosi J, Chang A, Kalyan B, Sahota D, Symonds EM. Customised antenatal growth charts. The Lancet. 1992;339(8788):283-7. This study used a retrospective review of 4179 pregnancies with gestational ages confirmed by ultrasounds to produce an antenatal chart that could be customised for individual pregnancies after correction of physiologic variables like sex, maternal weight at first antenatal-clinic visit, height, ethnic group, and parity. The authors stated that adjustment for these variables make assessment of fetal growth more precise.
43. Mongelli M, Figueras F, Francis A, Gardosi J. A customised birthweight centile calculator developed for an Australian population. Australian and New Zealand Journal of Obstetrics and Gynaecology. 2007;47(2):128-31.
45. McCowan L, Stewart AW, Francis A, Gardosi J. A customised birthweight centile calculator developed for a New Zealand population. Australian and New Zealand Journal of Obstetrics and Gynaecology. 2004;44(5):428-31.
46. Salomon LJ. Early fetal growth: concepts and pitfalls. Ultrasound in obstetrics & gynecology : the official journal of the International Society of Ultrasound in Obstetrics and Gynecology. 2010;35(4):385-9.
47. ● Altman DG, Chitty LS. Design and analysis of studies to derive charts of fetal size. Ultrasound in Obstetrics and Gynecology. 1993;3(6):378-84. This opinion piece attempted to provide a list of key features required for the design and analysis of studies used to produce references for fetal size. This list included differentiating between size and growth; the use of longitudinal studies with adequate sample sizes, inclusion of a well-selected and described sample and use of appropriate statistical methods.
48. ● Altman DG, Chitty LS. Charts of fetal size: 1. Methodology. BJOG: An International Journal of Obstetrics & Gynaecology. 1994;101(1):29-34. This was a prospective study of 663 fetuses that attempted to determine features of study design and analysis necessary for adequate development of references for fetal size. The study described that sample selection, sample size, prospective collection of data and use of statistical methods that take increasing variation among fetuses during pregnancy into consideration are important.
49. ● Royston P, Altman DG. Design and analysis of longitudinal studies of fetal size. Ultrasound in Obstetrics and Gynecology. 1995;6(5):307-12. This paper describes the statistical analysis of longitudinal studies used for the establishment of fetal growth standards or references. The authors propose the use of multilevel models which adequately represent the data used for construction of fetal growth charts.
50. Deter RL, Harrist RB, Hadlock FP, Carpenter RJ. The use of ultrasound in the assessment of normal fetal growth: A review. Journal of Clinical Ultrasound. 1981;9(9):481-93.
51. Altman DG, Hytten FE. Intrauterine growth retardation: Let's be clear about it. BJOG: An International Journal of Obstetrics & Gynaecology. 1989;96(10):1127-8.
52. Williams RL, Creasy RK, Cunningham GC, Hawes WE, Norris FD, Tashiro M. Fetal growth and perinatal viability in California. Obstetrics and gynecology. 1982;59(5):624-32.
53. Salomon LJ. Early fetal growth: concepts and pitfalls. Ultrasound in Obstetrics & Gynecology. 2010;35(4):385-9.
54. Treloar A, Behn BG, Cowan DW. Analysis of gestational interval. American Journal of Obstetrics and Gynecology. 1967;99:34 - 45.
55. Chitty LS, Altman DG, Henderson A, Campbell S. Charts of fetal size: 2. Head measurements. British journal of obstetrics and gynaecology. 1994;101(1):35-43.
56. de Onis M, Garza C, Victora CG, Onyango AW, Frongillo EA, Martines J. The WHO Multicentre Growth Reference Study: Planning, study design, and methodology. Food and Nutrition Bulletin. 2004;25(Supplement 1):15S-26S.
57. Altman DG, Ohuma EO, International F, Newborn Growth Consortium for the 21st C. Statistical considerations for the development of prescriptive fetal and newborn growth standards in the INTERGROWTH-21st Project. BJOG. 2013;120 Suppl 2:71-6, v.
59. Royston P. Constructing time-specific reference ranges. Stat Med. 1991;10(5):675-90. 60. Jennen-Steinmetz C. Sample size determination for studies designed to estimate covariate-dependent reference quantile curves. Stat Med. 2014;33(8):1336-48.
61. Hanley JA. Simple and multiple linear regression: sample size considerations. Journal of Clinical Epidemiology. 2016;79:112-9.
62. Ioannou C, Talbot K, Ohuma E, Sarris I, Villar J, Conde-Agudelo A, et al. Systematic review of methodology used in ultrasound studies aimed at creating charts of fetal size. BJOG: An International Journal of Obstetrics & Gynaecology. 2012:no-no.
63. Napolitano R, Dhami J, Ohuma EO, Ioannou C, Conde-Agudelo A, Kennedy SH, et al. Pregnancy dating by fetal crown-rump length: a systematic review of charts. BJOG. 2014;121(5):556-65.
64. Harris EK, Boyd J. Statistical bases of reference values in laboratory medicine. Boca Raton: CRC Press; 1995.
65. Linnet K. Nonparametric estimation of reference intervals by simple and bootstrap-based procedures. Clin Chem. 2000;46(6 Pt 1):867-9.
66. Healy MJR, Rasbash J, Yang M. Distribution-free estimation of age-related centiles. Annals of human biology. 1988;15(1):17-22.
67. Wright EM, Royston P. Calculating reference intervals for laboratory measurements. Statistical Methods in Medical Research. 1999;8(2):93-112.
68. Linnet K. Two-stage transformation systems for normalization of reference distributions evaluated. Clin Chem. 1987;33(3):381-6.
69. Royston P, Matthews JNS. Estimation of reference ranges from normal samples. Statistics in medicine. 1991;10(5):691-5.
70. Hanley J, Moodie E. Sample size, precision and power calculations: a unified approach. J Biomet Biostat. 2011;5:2.
71. Virtanen A, Kairisto V, Uusipaikka E. Regression-based reference limits: determination of sufficient sample size. Clin Chem. 1998;44(11):2353-8.
72. Virtanen A, Kairisto V, Irjala K, Rajamaki A, Uusipaikka E. Regression-based reference limits and their reliability: example on hemoglobin during the first year of life. Clin Chem. 1998;44(2):327-35.
73. Elveback LR, Taylor WF. STATISTICAL METHODS OF ESTIMATING PERCENTILES. Annals of the New York Academy of Sciences. 1969;161(2):538-48.
74. Altman DG. Construction of age-related reference centiles using absolute residuals. Statistics in medicine. 1993;12(10):917-24.
75. Royston P, Altman DG. Using fractional polynomials to model curved regression relationships. Stata Technical Bulletin. 1994;21: 11-23.
76. Healy MJ. Notes on the statistics of growth standards. Annals of human biology. 1974;1(1):41-6.
78. Cohen J. Statistical power analysis for the behavioral sciences. Hillsdale, N.J.: L. Erlbaum Associates; 1988.
79. Norman GR, Sloan JA, Wyrwich KW. Interpretation of Changes in Health-related Quality of Life: The Remarkable Universality of Half a Standard Deviation. Medical Care. 2003;41(5):582-92. 80. ● WHO Multicentre Growth Reference Study. Assessment of differences in linear growth among populations in the WHO Multicentre Growth Reference Study. Acta Pædiatrica. 2006;Suppl 450:56 - 65. This study aimed to evaluate whether it was possible to pool data from the different populations in the WHO Multicentre Growth Reference Study (MGRS) for the construction of a single international growth standard. The authors showed that there was little variability in linear growth among the children from the different sites justifying the pooling of data to construct a single standard.
81. Barker DJ, Osmond C. Infant mortality, childhood nutrition, and ischaemic heart disease in England and Wales. Lancet. 1986;1(8489):1077-81.
82. Barker DJ, Winter PD, Osmond C, Margetts B, Simmonds SJ. Weight in infancy and death from ischaemic heart disease. Lancet. 1989;2(8663):577-80.
83. Sovio U, White IR, Dacey A, Pasupathy D, Smith GCS. Screening for fetal growth restriction with universal third trimester ultrasonography in nulliparous women in the Pregnancy Outcome Prediction (POP) study: a prospective cohort study. Lancet. 2015;386(10008):2089-97.
84. Gluckman PD, Hanson MA, Bateson P, Beedle AS, Law CM, Bhutta ZA, et al. Towards a new developmental synthesis: adaptive developmental plasticity and human disease. Lancet. 2009;373(9675):1654-7.
85. Gluckman PD, Hanson MA, Beedle AS. Early life events and their consequences for later disease: a life history and evolutionary perspective. Am J Hum Biol. 2007;19(1):1-19.
86. Barker DJ. The origins of the developmental origins theory. J Intern Med. 2007;261(5):412-7. 87. Gluckman PD, Hanson MA, Buklijas T. A conceptual framework for the developmental origins of health and disease. J Dev Orig Health Dis. 2010;1(1):6-18.