on Deposition Kinetics of Colloidal Hematite ((X-Fe203)
in Packed Beds of Silica Sand
Thesis by Jeff Noelte
In Partial Fulfillment of the Requirements for the Degree of
Doctor of Philosophy
California Institute of Technology Pasadena, California
2002
Acknowledgements
I would like to thank my advisors Professor Michael Hoffmann and Professor Jim Morgan. I am very grateful for their support, guidance, and patience. I would also like to thank the other members of my examining committee, Professor Mark Davis and Professor Geoff Blake. The generosity of Mark Davis and Jeremy Heidel in the making of electrophoretic mobility measurements, as well as the advice and encouragement of Professor Norman Brooks are greatly appreciated.
The daily rigors of graduate life were made much easier by Linda Scott and Fran Matzen. Their ever-present smiles and kind words could be counted on as much as their invaluable help. The final push to finish my experimental program was enhanced by many helpful and enjoyable conversations with Tim Lesko.
Abstract
The removal of colloidal (sub-micrometer) particles from flowing suspensions by deposition on surfaces is important in many natural and industrial processes (e.g., the fate of colloids and associated pollutants in groundwater systems and water treatment involving separation processes). In deposition, colloidal particles are transported to the vicinity of the collector surface by advection and diffusion. Colloidal interactions at short distances determine whether a particle will attach to a collector. Deposition rates are reduced by the presence of repuls4e colloidal interactions. Van der Waals attraction and electric double layer repulsion are combined in DLVO theory to describe the total interaction energy between two surfaces. The total interaction energy depends on the solution chemistry and the electric charge and potential of the interacting surfaces. To understand the attachment step of particle deposition, an understanding of the role of simple chemical changes in the water altering the electrostatic interaction is critical.
Deposition experiments using hematite particles and a silica sand were conducted to investigate the influence of specific adsorption to hematite on deposition kinetics. A variety of electrolytes, both inorganic and organic, were studied (e.g., phosphate, small organic acids, and polymeric organic compounds including fulvic and humic acid). Electrokinetic measurements were carried out, under chemical conditions similar to those in the deposition experiments, to provide information about the sign and magnitude of the surface charge on hematite particles.
potential-detennining ions. In the absence of specifically adsorbed species, hematite deposition is transport limited (favorable deposition) at pH 6.S and 1 millimolar NaCl. The addition of 100 micromolar total phosphate results in unfavorable deposition in which the deposition rate is reduced by approximately two orders of magnitude. Polymeric organic compounds produce unfavorable deposition at total concentrations around 10-5 gIL. It was observed that electrokinetic measurements in the presence of polymeric organic compounds are influenced by the particle concentration when hematite mobility is measured as a function of the total solute concentration. Experimental results indicated that adjusting the total polyelectrolyte concentration by the same factor relating the particle concentrations in the mobility measurements and deposition experiments resulted in matching the hematite surface properties in the mobility measurements to the deposition experiments.
Table of Contents
Acknowledgements ... iv
Abstract ... v
List of Plates ... xi
List of Tables ... xii
3.1 Particle Preparation and Characterization ... 3-1 3.1.1 Preparation of Hematite Particles ... 3-1 3.1.2 Particle Characterization ... 3-2 3.2 Particle Surface Properties ... 3-5 3.2.1 Specific Surface Area ... 3-5 3.2.2 Surface Site Density ... 3-5 3.3 Granular Porous Medium ... 3-6 3.3.1 Porous Medium Physical and Chemical Composition ... 3-6 3.3.2 Cleaning of Porous Medium ... 3-9 3.4 Electrophoretic Mobility Measurements ... 3-10 3.4.1 Electrophoretic Mobility of Hematite Particles ... 3-10 3.4.2 Electrophoretic Mobility of Sand Particles ... 3-11 3.5 Particle Deposition Experiments ... 3-11 3.5.1 Experimental Apparatus for Particle Deposition ... 3-11 3.5.2 Particle Deposition Procedure ... 3-14 3.5.3 Determination of Particle Concentration ... 3-17 3.5.4 Tracer Experiments ... 3-18 4. Experimental Results ... 4-1 4.0 Introduction ... 4-1 4.1 Tracer Experiments ... 4-1 4.2 Particle Deposition Rates ... 4-3 4.2.1 Effect of NaCI on Hematite Deposition ... .4-3 4.2.2 Effect of Inorganic Compounds on Hematite Deposition ... .4-5 4.2.2.1 Effect of Phosphate and Arsenate on Hematite Deposition ... .4-5 4.2.2.2 Effect of Fluoride on Hematite Deposition ... .4-7 4.2.3 Effect of Low Molecular Weight Organic Compounds on
Hematite Deposition ... 4-10 4.2.3.1 Effect of Oxalate and Related Compounds on Hematite
Deposition ... 4-10 4.2.3.2 Effect of Phthalate and Related Compounds on Hematite
4.2.3.3 Effect of Aspartic Acid on Hematite Deposition ... .4-14 4.2.3.4 Effect of Butyric Acid on Hematite Deposition ... .4-14 4.2.3.5 Effect of Lauryl Sulfate on Hematite Deposition ... .4-19 4.2.4 Effect of Polymeric Organic Compounds on Hematite Deposition ... .4-19 4.3 Electrokinetic Measurements ... 4-23 4.3.1 Effect of pH on Silica Sand Mobility ... .4-26 4.3.2 Effect of pH on Hematite Mobility ... .4-26 4.3.3 Hematite Mobility in the Presence of Inorganic Compounds ... .4-26 4.3.4 Hematite Mobility in the Presence of Oxalate and Related
Compounds ... 4-30 4.3.5 Hematite Mobility in the Presence of Phthalate and Related
Compounds ... 4-30 4.3.6 Hematite Mobility in the Presence of Aspartic Acid ... .4-32 4.3.7 Hematite Mobility in the Presence of Butyric Acid ... .4-32 4.3.8 Hematite Mobility in the Presence of Lauryl Sulfate ... .4-32 4.3.9 Hematite Mobility in the Presence of Polymeric Organic
Compounds ... 4-32 5. Discussion of Results ... 5-1 5.0 Introduction ... 5-1 5.1 Particle Mobility, ~-Potential and Surface Potential.. ... 5-1 5.2 Hematite Deposition in the Presence of Inorganic Solutes ... 5-2
5.2.1 Hematite Deposition in the Presence of Phosphate and Arsenate ... 5-2 5.2.2 Hematite Deposition in the Presence of Fluoride ... 5-5 5.2.3 Effect of Particle Concentration on Hematite Mobility ... 5-5 5.3 Hematite Deposition in the Presence of Small Organic Molecules ... 5-7
5.3.1 Hematite Deposition in the Presence of Oxalate and Related
Compounds ... 5-7 5.3.2 Hematite Deposition in the Presence of Phthalate and Related
5.3.5 Effect of Particle Concentration on Hematite Mobility ... 5-14 5.4 Hematite Deposition in the Presence of Polymeric Organic Compounds 5-15 5.4.1 Comparison of Deposition Results and Mobility Measurements ... 5-15 5.4.2 The Langmuir Equation and Total Adsorbate Concentration ... 5-20
6. Summary and Conclusions ... 6-1
6.0 Introduction ... 6-1 6.1 The Collision Efficiency and Electrostatic Repulsion ... 6-1 6.1.1 Theory and Observations ... 6-1 6.1.2 Cases Contrary to Electrostatic Considerations ... 6-8 6.2 Implications for Environmental Systems ... 6-10 6.3 Summary of Main Conclusions ... 6-11
References Appendix
List of Plates
Plate Page
I Transmission electron micrograph of synthesized hematite particles
used in this research ... 3-4
List of Tables
Table Page
List of Figures
Figure Page
1.1 Typical size ranges for aqueous particles ... 1-2 1.2 Schematic representation of particle deposition and aggregation ... 1-2 2.1 Generalized clean-bed particle breakthrough curve ... 2-3 2.2 Generalized particle breakthrough curve showing blocking and ripening ... 2-3 2.3 Typical total interaction energy profile when electrostatic repulsion
is significant ... 2-12 2.4 Schematic representation of the metal oxide surface ... 2-13 2.5 Schemaic representation of possible surface complexation reactions
of a diprotic acid ... 2-18 3.1 X-ray diffraction pattern of hematite prepared for this research
compared to a hematite standard ... 3-3 3.2 Sieve analyses of Ottawa 30 sand ... 3-7 3.3 Schematic diagram of the particle deposition apparatus ... 3-12 3.4 Total light extinction as a function of particle concentration ... 3-19 4.1 Tracer breakthrough curve ... 4-2 4.2 Hematite breakthrough curves in the presence of NaCl.. ... .4-4 4.3 Hematite breakthrough curves in the presence of phosphate ... .4-6 4.4 Experimental collision efficiency as a function of total phosphate
concentration ... 4-6 4.5 Hematite breakthrough curves in the presence of arsenate ... .4-8 4.6 Experimental collision efficiency as a function of total arsenate
concentration ... 4-8 4.7 Hematite breakthrough curves in the presence of fluoride ... .4-9 4.8 Experimental collision efficiency as a function of total fluoride
Figure Page
4.9 Hematite breakthrough curves in the presence of oxalic acid (C2) ••.•••••.••••••• .4-11
4.10 Hematite breakthrough curves in the presence of succinic acid (C4) ..••••....•.• .4-11
4.11 Hematite breakthrough curves in the presence of adipic acid (C6) •....•....•.•.•. .4-12 4.12 Hematite breakthrough curves in the presence of suberic acid (Cg) •••••••••••••• .4-12
4.13 Experimental collision efficiency as a function of total
dicarboxylic acid concentration ... 4-13
4.14 Hematite breakthrough curves in the presence of phthalate ... .4-15
4.15 Hematite breakthrough curves in the presence of benzene-tri ... .4-15
4.16 Hematite breakthrough curves in the presence of benzene-tetra ... .4-16
4.17 Experimental collision efficiency as a function of total
carboxylic acid concentration ... 4-16
4.18 Hematite breakthrough curves in the presence of aspartic acid ... .4-17
4.19 Experimental collision efficiency as a function of total
aspartic acid concentration ... 4-17
4.20 Hematite breakthrough curves in the presence of butyric acid ... .4-18
4.21 Experimental collision efficiency as a function of total
butyric acid concentration ... 4-20
4.22 Hematite breakthrough curves in the presence of lauryl sulfate ... .4-20
4.23 Experimental collision efficiency as a function of total
lauryl sulfate concentration ... 4-21
4.24 Hematite breakthrough curves in the presence of polyaspartic acid ... .4-21
4.25 Hematite breakthrough curves in the presence of Leonardite humic acid ... .4-22
4.26 Hematite breakthrough curves in the presence of S.R. fulvic acid ... .4-24
4.27 Hematite breakthrough curves in the presence of S.R. humic acid ... .4-24
4.28 Experimental collision efficiency as a function of total
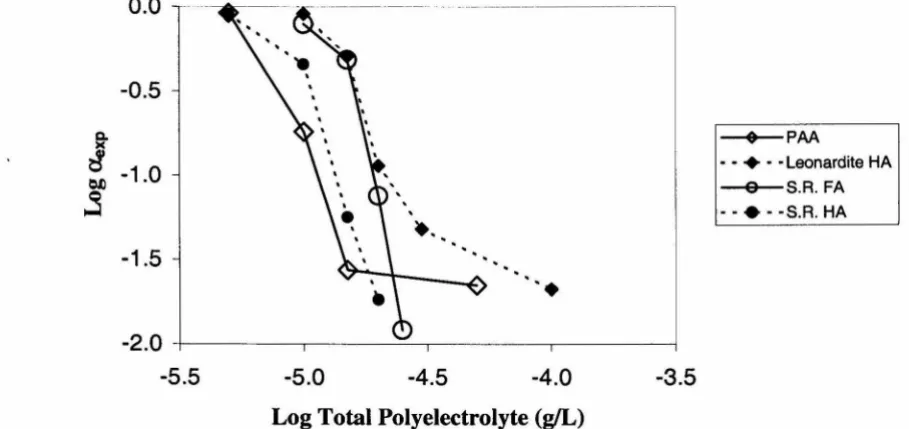
polyelectrolyte concentration ... 4-25
4.29 Electrophoretic mobility of Ottawa 30 sand as a function of pH ... .4-27
Figure Page
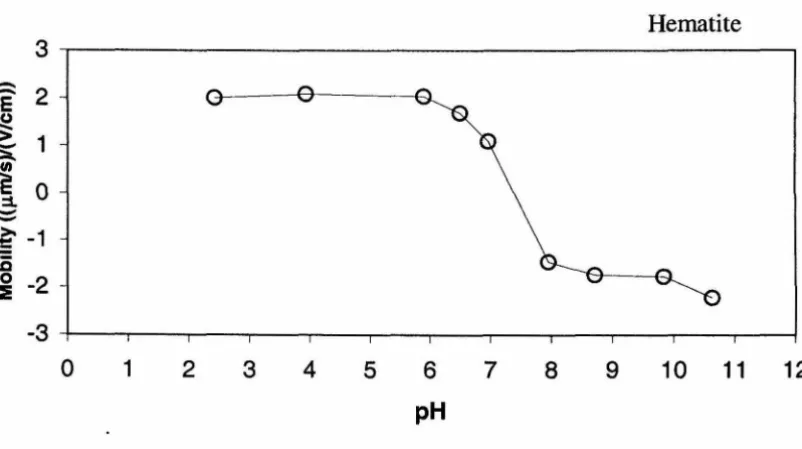
4.31 Electrophoretic mobility of hematite particles as a function of
total phosphate concentration ... 4-28 4.32 Electrophoretic mobility of hematite particles as a function of
total arsenate concentration ... 4-28 4.33 Electrophoretic mobility of hematite particles as a function of
total fluoride concentration ... 4-29 4.34 Electrophoretic mobility of hematite particles as a function of
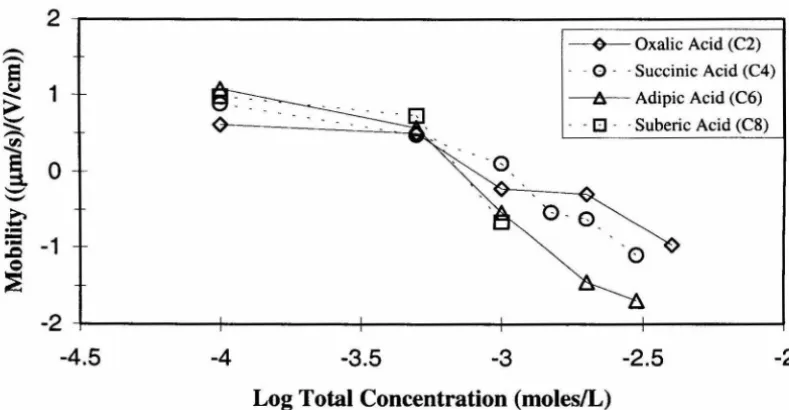
total concentration of oxalate and related compounds ... .4-31 4.35 Electrophoretic mobility of hematite particles as a function of
total concentration of phthalate and related compounds ... .4-31 4.36 Electrophoretic mobility of hematite particles as a function of
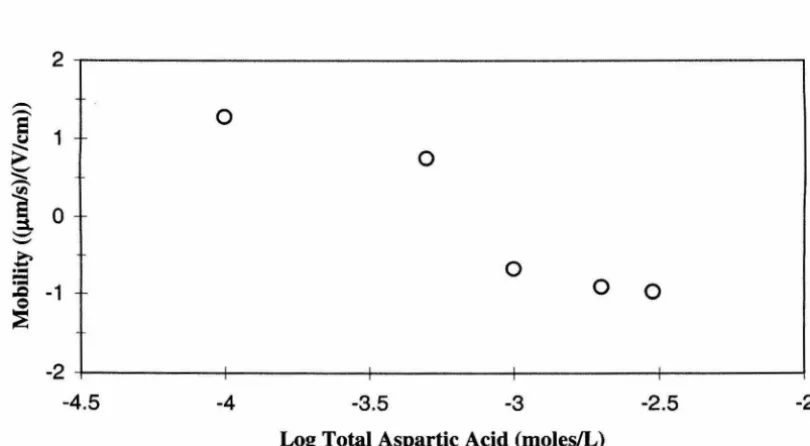
total aspartic acid concentration ... .4-33 4.37 Electrophoretic mobility of hematite particles as a function of
total butyric acid concentration ... 4-33 4.38 Electrophoretic mobility of hematite particles as a function of
totallauryl sulfate concentration ... .4-34 4.39 Electrophoretic mobility of hematite particles as a function of
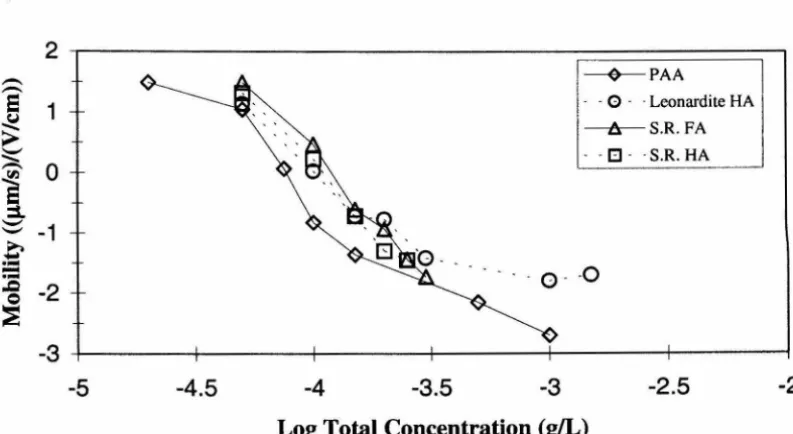
total concentration of polyelectrolyte ... 4-34 4.40 Electrophoretic mobility of hematite particles as a function of
total polyaspartic acid (PAA) concentration ... .4-36 4.41 Electrophoretic mobility of hematite particles as a function of
total Suwannee River humic acid concentration ... .4-36 5.1 Comparison of collision efficiency and hematite mobility as a function
of total phosphate concentration ... 5-3 5.2 Comparison of collision efficiency and hematite mobility as a function
of total arsenate concentration ... 5-3 5.3 Comparison of collision efficiency and hematite mobility as a function
Figure Page
5.4 Calculated hematite surface potential as a function of total phosphate
concentration for different hematite particle concentrations ... 5-8
5.5 Comparison of collision efficiency and hematite mobility as a function
of total succinic acid concentration ... 5-9 5.6 Comparison of collision efficiency and hematite mobility as a function
of total phthalate concentration ... 5-11 5.7 Comparison of collision efficiency and hematite mobility as a function
of total benzene-tri concentration ... 5-11 5.8 Comparison of collision efficiency and hematite mobility as a function
of total benzene-tetra concentration ... 5-13 5.9 Comparison of collision efficiency and hematite mobility as a function
of total aspartic acid concentration ... 5-13 5.10 Comparison of collision efficiency and hematite mobility as a function
of total butyric acid concentration ... 5-14 5.11 Comparison of collision efficiency and hematite mobility as a function
of total polyaspartic acid concentration ... 5-16 5.12 Comparison of collision efficiency and hematite mobility as a function
of total Leonardite humic acid concentration ... 5-16 5.13 Comparison of collision efficiency and hematite mobility as a function
of total Suwannee R4er fulvic acid concentration ... 5-17 5.14 Comparison of collision efficiency and hematite mobility as a function
of total Suwannee R4er humic acid concentration ... 5-17 5.15 Hematite mobility as a function of total polyaspartic acid concentration ... 5-19 5.16 Hematite mobility as a function of total Suwannee R4er humic acid
concentration ... 5-19 5.17 Comparison of collision efficiency and "adjusted" hematite mobility
Figure Page
5.18 Comparison of collision efficiency and "adjusted" hematite mobility
as a function of total Leonardite humic acid concentration ... 5-21 5.19 Comparison of collision efficiency and "adjusted" hematite mobility
as a function of total Suwannee R4er fulvic acid concentration ... 5-22 5.20 Comparison of collision efficiency and "adjusted" hematite mobility
as a function of total Suwannee R4er humic acid concentration ... 5-22 6.1 Collision efficiency as a function of the hematite mobility measured
at the same chemical conditions of the deposition experiment.. ... 6-2 6.2 Comparison of theoretical and experimental collision efficiencies as
a function of [KCI] (from Elimelech and O'Melia, 1990) ... 6-4 6.3 Theoretical collision efficiencies as a function of 1-1 electrolyte
assuming a normal distribution of surface potentials for particles
and collectors (from Elimelech et aI., 1995) ... 6-6 6.4 Comparison of theoretical and experimental collision efficiencies as
a function of pH for carboxylated latex particles for different porous
medium cleaning techniques (from Litton and Olson, 1993) ... 6-7 6.5 Experimental collision efficiencies as a function of the heterogeneity
1. INTRODUCTION
1.0 Introduction
Particles dispersed in aqueous solution are common in natural systems and
industry. Figure 1.1 shows some typical size ranges of particles. Colloidal particles,
roughly 1 nm to 10 )..lm, are of particular interest because they have appreciable specific
surface area and they don't settle out of solution under normal gravity. Therefore,
colloids play an important role when surface processes are involved. Henceforth, the
term "particle" will refer to a particle in the colloidal size range.
The deposition of colloidal particles from suspension onto solid surfaces is
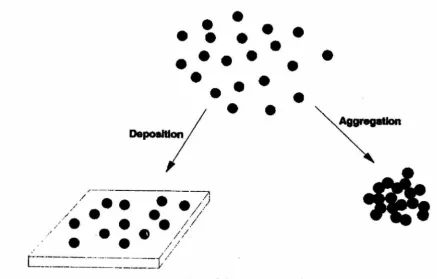
important in many natural and industrial processes. A schematic representation of the
particle deposition process is given in Figure 1.2. Granular (deep bed) filtration is one
process where particle deposition has great significance. In deep bed filtration, a liquid
suspension is passed through a porous filter medium (usually sand grains) where fine
particles are removed by deposition onto the surfaces of the filter medium (Tien, 1989).
Another area where particle deposition is important is groundwater quality. Particles
(e.g., metal oxides, clays, bacteria, and viruses) can undergo transport and deposition in
subsurface environments (Ryan and Elimelech, 1996). Contaminants (e.g., metals,
radionuclides, and hydrophobic organic compounds) are often associated with colloidal
particles in groundwater. The deposition behavior will influence the extent of migration
o
1AI
....
• Gln ....
...
....
I
I
v...
•
•CDIIoIdIII
PARnCLE
8Q'E81 "'"
I
-
...-
~--:--a.,-
-
•...
1mm
I
...
Figure 1.1: Typical size ranges for aqueous particulate matter. Adapted from Stumm and Morgan (1981).
.
'
•
•
•
•
•
•
•
••••
•
•
•
•
•
•
•
•
•
The main goal of this research is to gain a better understanding of the influence of
surface chemistry on particle deposition kinetics in flow through porous media. A
hematite particle suspension flowing through a silica sand bed served as a model system.
1.1 Motivation to Use Hematite as Model Colloid
Iron oxides and hydroxides are common in nature because iron is the fourth most
abundant element in the earth's crust (4.7%). One of the iron minerals found in the
environment is hematite (a-Fe203). The formation of iron oxides and hydroxides is
thought to result from the dissolution of minerals containing Fe(I1), which is
subsequently oxidized to form Fe(III). The solubility of Fe (III) oxides and hydroxides is
extremely low, consequently precipitates form.
Hematite particles can be synthesized in the laboratory by hydrolysis of Fe (III)
salts (Matijevic and Scheiner, 1978). Iron (III) has a strong tendency to form aqueous
complexes with many ions. Studies have shown the adsorption of inorganic ions, organic
ions, and polymeric organic compounds on iron oxide surfaces (Sigg and Stumm, 1981;
Schlautman and Morgan, 1994). Another important reason to use hematite as a model
colloid was that Liang (1988) studied the effects of surface chemistry on the coagulation
kinetics of colloidal hematite. The results of Liang's (1988) research were valuable in
the design of the experimental program for this research. Also, it was desirable to extend
the body of knowledge concerning the behavior of hematite particles in aquatic systems.
1.2 Scope and Objectives of Research
A large amount of particle deposition data can be explained, at least in a
semiquantitative manner, by the well-known DLVO theory
electrostatic repulsion between surfaces. Particle coagulation studies have shown that
specifically adsorbed species influence coagulation rates by affecting the surface charge
on particles (Liang, 1988; Tiller, 1993). It is expected that specifically adsorbed species
will influence particle deposition in a similar fashion.
In general, the goal of this research is to document and explain the impact of
small changes in the aqueous chemistry (i.e., addition of specifically adsorbed species) on
the deposition kinetics of hematite particles in a silica sand bed. The specific objectives
of this research are
1) Determine the effect of various inorganic ions on the deposition rates of hematite
particles. The species to be investigated are sodium salts of chloride, phosphate,
arsenate, and fluoride.
2) Determine the effect of various organic species on hematite deposition rates. The
species to be studied include (i) butyric acid and lauryl sulfate; (ii) phthalic acid,
1,2,4-benzenetricarboxylic acid, and 1,2,4,5-benzenetetracarboxylic acid; (iii)
oxalic acid, succinic acid, adipic acid, and suberic acid; (iv) aspartic acid and
polyaspartic acid.
3) Determine the effect of naturally occurring organic molecules on hematite
deposition rates. The species to be studied are leonardite humic acid, Suwannee
River humic acid, and Suwannee River fulvic acid.
4) Determine the effect of specifically adsorbed species used in particle deposition
experiments on the electrokinetic properties of hematite, and relate the
5) Interpret the particle deposition and electrokinetic results in terms of surface
2. Background and Models
2.0 Introduction
The purpose of this chapter is to present the theoretical background necessary for
the interpretation of the results of this research.
The removal (deposition) of particles from aqueous suspension by a porous
medium is considered to involve two distinct steps: the transport of suspended particles
to the surface of a collector (grain), followed by the attachment of particles to the
collector surface (Yao et aI., 1971). The transport step is controlled by the physics of the
system, while the attachment step is controlled by the chemistry of the system (O'Melia
and Stumm, 1967). Mass transfer theories are able to successfully describe the particle
transport step, as evidenced by the adequate description of particle deposition when
conditions for deposition are favorable (i.e., particle deposition is transport limited due to
the absence of repulsive forces) (Elimelech, 1991). However, the particle attachment
step has not been described successfully. Particle deposition studies under unfavorable
conditions (repulsive electrostatic interactions) have shown discrepancies between
theoretical predictions and observations of particle deposition rates (Litton and Olson,
1993; Elimelech and O'Melia, 1990). These discrepancies have motivated a great deal of
research focused on gaining a better understanding of the particle attachment step. This
research, concerned with the effects of surface chemistry on particle deposition, also
2.1 Clean-Bed Particle Deposition
Like most particle deposition studies to date, this research is concerned with the
initial stage of deposition where previously retained particles do not influence the
subsequent deposition of particles. This early stage of the particle deposition process is
referred to as "clean-bed" deposition. Hence, the particle deposition parameters reported
in this thesis can be viewed as "clean-bed" values.
Particle deposition rates in flow through porous media are determined from the
response of a packed bed to a step input of suspended particles which is expressed in the
form of a particle breakthrough curve. In a breakthrough curve, the effluent particle
concentration is plotted as a function of time. A typical particle breakthrough curve for
clean-bed deposition is shown in Figure 2.1. The key characteristic of a clean-bed
particle breakthrough curve is that the effluent particle concentration remains constant
once the breakthrough front passes.
For completeness, what happens when clean-bed conditions no longer exist will
be described briefly. When particles retained on the collector surface result in the
conditions for deposition becoming less favorable (increase in repulsive interactions), an
increasing trend is observed in the particle breakthrough curve. This is referred to as
"blocking." Conversely, when retained particles lead to more favorable deposition
conditions, a decreasing trend in the particle breakthrough curve is observed. The term
used to describe this event is "ripening" (Tien, 1989). Figure 2.2 shows a graphical
I=l
o
...
~
5/\
u I=l
o
U
~
...
u
...
~
•
•
•
•
•
•
•
•
•
•
•
•
•
•
j
Time
>
Figure 2.1: Generalized particle breakthrough curve under clean-bed conditions.
Time
2.2 Modeling the Deposition of Brownian Particles
2.2.1 The Advection-Dispersion Equation
In flow through porous media, the spatial and temporal variations in suspended
particle concentration can be described in mathematical terms by performing a mass
balance on an elemental control volume within a packed bed. Three processes are
significant for the construction of a balance equation for particle deposition, and they are
(i) Hydrodynamic dispersion of particles resulting from uneven velocity
profiles within pores and the finite size of colloidal particles.
(ii) Advection of particles due to their entrainment in the traveling fluid.
(iii) Removal of particles by deposition onto collector (sand grain) surfaces.
Combining these processes for an aqueous suspension of monodisperse particles flowing
vertically through a packed bed of spherical collectors gives the one-dimensional form of
the advection-dispersion equation (Bear, 1972; Rajagopalan and Chu, 1982; Grolimund et
aI., 1998):
(2.1)
where C is the particle concentration in aqueous suspension, t is time, and
z
is the spatial coordinate (vertical). Since a monodisperse particle suspension is being considered, Ccan be expressed as a number concentration or a mass concentration.
The first term on the right-hand side of Equation (2.1) accounts for the
hydrodynamic dispersion of suspended particles, where Dh is the hydrodynamic
dispersion coefficient. In advection-dominated systems, such as vertical flow through
packed beds of large, sand-sized grains (collectors), hydrodynamic dispersion is generally
(2.1) is the advection tenn. Particles usually travel slightly faster than the average fluid
velocity in a porous medium (Mau, 1992). Therefore, detennining the particle velocity
(Vp ) requires an independent equation (Johnson and Elimelech, 1995). The sink tenn
accounting for particle deposition is the last tenn in Equation (2.1), where k is the particle
deposition rate coefficient. The goal of many particle deposition studies, including this
research, is to detennine the effect of changes in system chemistry on the particle
deposition rate (i.e., k).
2.2.2 The Single Collector Efficiency
The particle deposition rate can be calculated from the removal of particles by the
porous medium in a packed bed. The accumulation of captured particles in the packed
bed is equal to the removal of particles by one collector (grain) multiplied by the number
of collectors comprising the bed. At this point, it is useful to consider a dimensionless
particle removal rate, 11, called the single collector efficiency which is defined as (Yao et
aI., 1971; Elimelech et aI., 1995):
rate of particle removal by the collector
rJ
=
rate of particle transport towards the projected area of the collector (2.2)Therefore, the particle removal rate by one spherical collector of radius ac is rJ1Ca/ UC,
where U is the fluid approach (superficial) velocity and C is the particle concentration. In
order to develop an expression for rJ, consider a differential slice of packed bed, with
height dz and cross-sectional area Ac. The number of collectors in the differential
volume, No is given by
Consequently, the accumulation of captured particles in the volume element can be stated
as
3
U
-1J(1-f)-CA dz
=
-QdC4 Q
c C
(2.4)
where Q is the volumetric flow rate (Q=UAc). Integrating over the entire bed depth with
the boundary conditions of C=Co at z=O and C=Ce at z=L (L is the bed depth) gives
C
fdC 3 L
J -
=
--1J(1- f)f
dzCo C 4Qc 0
(2.5)
Performing the integration results in
__ 4
QcIn(C
e )1Jexp - 3 (1- f)L Co
(2.6)
where CeiCo is the normalized effluent particle concentration taken from the particle
breakthrough curve of a deposition experiment and the subscript "exp" is used to indicate
that the value is based on experimental results.
2.2.3 Experimental Collision Efficiency
When the particle deposition rate is slower than the transport limited rate (i.e.,
unfavorable deposition) due to repulsive interactions between the particle and collector
surfaces, it is convenient to express the results in terms of the collision efficiency
a
(alsotermed attachment efficiency or sticking probability) (Ryan and Elimelech, 1996). Since
the collision efficiencies considered in this research are determined from experiment, the
experimental collision efficiency, CXexP' will be used. The experimental collision
efficiency is defined as the ratio of the measured particle deposition rate to the particle
interactions). For particle deposition in granular porous media, the experimental collision
efficiency is given by
f1exp
aexp =
-flo
(2.7)
where flo is the single collector efficiency under transport limited (favorable) conditions.
The value of
a
exp is between 0 (no deposition of particles) and 1 (particle deposition istransport limited).
Two approaches can be used to determine experimental collision efficiencies. In
one approach, the collision efficiency is calculated as the ratio of the measured particle
deposition rate (presented as f1exp) to the theoretical particle deposition rate under
favorable conditions (flo). The favorable single collector efficiency (flo) is calculated
from the advection-dispersion equation without including a term for electrostatic
interactions. In the second approach, the collision efficiency is calculated from the ratio
of the measured particle deposition rate (f1exp) to the measured particle deposition rate
under favorable chemical conditions (f1o,exp).
The second approach for determining the experimental collision efficiency was
used in this research. Favorable particle deposition was achieved by having the particles
and collectors oppositely charged. At pH 6.5 and in the absence of specifically adsorbed
species, the hematite particles are positively charged (pHzpc - 7.5) and the silica sand
grains are negatively charged (pHzpc - 2). However, under these conditions there can be
a significant enhancement in the particle deposition rate beyond the transport limited case
particle deposition rate had to be measured at a high enough ionic strength so as to
eliminate any possible enhancement of the transport limited deposition rate.
One must be aware of potential problems with using the measured single collector
efficiency under favorable deposition conditions. At high ionic strength, particle
coagulation may become significant. The formation of doublets, triplets, and
higher-order aggregates prior to and during deposition would probably result in measured
deposition rates different from the value for a monodisperse suspension. Also, at high
ionic strength, hydration forces can result in additional repulsive interactions as particles
approach collectors (Israelachvili, 1992). Preliminary experiments showed that these
potential problems were not significant.
2.3 Colloidal Interactions in Aquatic Systems
The types of interaction that exist between particles or a particle and a surface as
they approach each other will be presented. DL VO theory is based on two primary
interactions, electrostatic and London-Van der Waals forces. The theory, which was
developed to quantify the stability of colloidal suspensions, was introduced
independently by Derjaguin and Landau, and Verwey and Overbeek (Derjaguin and
Landau, 1941; Verwey and Overbeek, 1948).
2.3.1 London-Van der Waals Attraction Energy
London-Van der Waals forces result in a short-range attraction energy between
atoms, molecules, and macroscopic bodies. These forces are a consequence of the
fluctuation of charge in one atom polarizing another atom, and the other way around. For
a colloidal particle and a collector grain, it is assumed that the pairwise attraction
Following this assumption of pairwise additivity, Hamaker (1937) developed expressions
to evaluate the attraction energy. For the sphere-plate case (corresponding to a particle
and collector), the London-Van der Waals attraction energy is given by
(2.8)
where ap is the particle radius, h is the distance of separation, and A is the Hamaker constant. The Hamaker constant depends on the composition of the two interacting solids
and the medium that separates the two bodies (aqueous solution for this research).
Typically, A lies between 10-21 Joules and 10- 19 Joules (Elimelech, 1995).
2.3.2 Electrostatic Interaction
Metal oxides, like hematite (u-Fe203) and silica (Si02), acquire charge when in
contact with water. In order to maintain overall electroneutrality in the system, the
aqueous medium near the oxide surface must develop equal charge of opposite sign. The
result is a fixed layer of charge on the solid surface and a "diffuse layer" of charge
adjacent to the fixed layer, which together are called the electrical double layer. The
diffuse layer contains an excess of counter ions, opposite in sign to the fixed charge. The
Gouy-Chapman theory describes the charge distribution and electric potential function in
the diffuse layer (Stumm and Morgan, 1981).
When a particle approaches a collector at a short distance, the diffuse layers
overlap causing electrostatic attraction or repulsion. Electrostatic attraction will not be
considered further because it results in conditions favorable for particle deposition, which
can be successfully described using transport theory (see Section 2.0). The repulsive
calculated in two ways. One is to solve the Poisson-Boltzmann equation directly for a
given set of conditions, but a simple analytical solution usually cannot be achieved. The
other way is to build the formula from known expressions for each of the geometries
involved (sphere-plate for particle deposition). A presentation of several expressions of
this type is given by Elimelech et al. (1995). One such expression for the double layer
interaction energy VR, under constant surface charge conditions, is by Wiese and Healy
(1970):
{ (l+exPC-Kh)]
l
2 2)
[
l}
VR=
1Cco&l p 2lJ11lJ12 In - \lJI1 + lJI2 In 1- exp( -2Kh) ,l-exp(-Kh) (2.9)
where
eo
is the permittivity in vacuum, c is the relative permittivity, ap is the particleradius, If/l and 1f/2 are the surface potentials of the particles and collectors respectively, h
is the distance of separation, and Kl is the Debye-HUckel length. The equation is valid
for (i) low surface potentials (less than 60 m V), (ii) Kap>5, and (iii) 1: 1 electrolyte. The
Debye-HUckellength defines the diffuse layer thickness, and is given by
(2.10)
where e is the elementary charge of an electron, NA is Avogadro's number, I is the ionic strength, and k is Boltzmann's constant. For typical aqueous solutions, the diffuse layer
thickness, 11K, ranges from 1-100 nm. The deposition experiments of this research had
10-3 moleslL NaCI which results in a diffuse layer thickness of approximately 10 nm.
2.3.3 Total Interaction Energy (DLVO Theory)
The combination of electrostatic and Van der Waals forces is the basis of DLVO
theory. The total interaction energy VT between a particle and collector is obtained by
Vr
=
VR+ VA). A total interaction energy profile results when Vr is shown as a function ofseparation distance. Figure 2.3 shows a typical total interaction energy profile when
electrostatic repulsion is significant. Some general properties of the total interaction
energy, with respect to particle deposition, are
1) When electrostatic repulsion exceeds Van der Waals attraction over a certain
range, the resulting energy barrier hinders the approach of particles and
prevents contact with the collector.
2) If the energy barrier is not present (i.e., no electrostatic repulsion), particles
will deposit at a transport limited rate due to Van der Waals attraction.
3) Particle deposition rates can be decreased by raising the energy barrier (i.e.,
increasing the electrostatic repulsion). Increased electrostatic repulsion can be
achieved by the addition of specifically adsorbed species that reverse the
charge on the particles to the same sign as the charge on the collectors.
2.4 OxidelWater Interface
2.4.1 The Origin of the Surface Hydroxyl Group
Dry metal oxide surfaces (e.g., hematite and silica) have metal ions that are not
fully coordinated. When contacted by water, the surface metal ions coordinate with
water molecules. Surface hydroxyl groups are produced by proton transfer from the
adsorbed water molecules to nearby surface oxygen atoms (Schindler, 1981). This
chemisorption process is shown schematically in Figure 2.4.
Various adsorption studies have reported values from 4.5 to 9 OR groups per nm2
J
Energy Barrier
I
Separation
I
Secondary Minimum
... ~--- Primaty
Minimum
Figure 2.3: Typical total interaction energy profile when electrostatic repulsion is
(a>
(b)
(c)
Figure 2.4: Schematic representation of the metal oxide surface layer (cross section) .
• Metal atoms: 0 oxygen atoms. a) Dry metal oxide. b) Water molecules fill vacant
coordination sites. c) Proton transfer produces surface hydroxyl groups. From Schindler
types of surface hydroxyl groups exist (Parfitt, 1978). However, for modeling purposes
they are usually described by a single surface hydroxyl group (depicted as =MeOH).
2.4.2 Surface Chemical Speciation Model
The surface charge on metal oxides exhibits a pH dependence because surface
hydroxyl groups can gain or lose protons. Besides protons, other cations and anions can
react with surface hydroxyl groups to determine surface speciation and charge (Stumm et
aI., 1980). Acid-base reactions at metal oxide surfaces result in three types of surface
species. The reactions are expressed as follows:
=MeOH2 + ~ =MeOH +
W
=MeOH ~ =MeO- +
W
The equilibrium constants are defined by
Kint aJ
Kint a2
Kint _ (= MeOH)(H+) _ [= MeOH1H+)
r
=MeOHal - (= MeOH;) - [= MeOH;]
r
=MeOH:IKint _ (= MeO-)(H+) _ [= MeO-](H+)
r
=MeO-a2 - (= MeOH) - [= MeOH]
r
=MeOH(2.11)
(2.12)
(2.13)
(2.14)
where the "int" superscript indicates an intrinsic constant, ( ) represents activity, [ ]
represents concentration, and YI is the activity coefficient for species i.
The charged surface species, =MeOH2+ and =MeO-, produce surface charge and
potential. An expression for the surface charge density (0') is given by
0' = ([= MeOH;]-[= MeO-D-F
where F is the Faraday constant, Sa is the specific surface area of the solid, and Sc is the solid concentration in gIL. Applying a proton material balance to titration data allows the surface charge density to be evaluated by
(2.16) where CA and CB are the resulting concentrations of acid and base, respectively, added to
the system during titration. The relation of surface charge to pH is described by Equation (2.16). The pH value where proton-derived surface charge is zero (i.e., [=MeOH2 +] is
equal to [=MeO-n is defined as pHzpc. For the hematite used in this research, the pHzpc determined from mobility measurements was 7.5. This is in the range of 6.5 to 9 reported by other investigators (Amirbahman and Olson, 1995; Tiller, 1993; Liang, 1988). The pHzpc for the silica sand used in this research is approximately 2.2, which is similar to values reported in the literature (Litton and Olson, 1993; Elimelech et aI., 2000).
2.4.3 Models of the OxideIW ater Interface
To effectively model adsorption on metal oxide surfaces, an electrostatic model is needed in addition to a description of surface chemical reactions. Inclusion of an electrostatic model facilitates surface species activity corrections in the presence of charged surfaces. There have been a number of surface complexation models developed, but they are based on the same fundamental principles (Dzombak and Morel, 1990):
1) Adsorption takes place at specific coordination sites.
2) Mass law equations can be used to describe adsorption reactions. 3) Adsorption results in surface charge on metal oxides.
The diffuse layer model (Stumm et aI., 1970) is used in this research to make
model calculations to aid in the interpretation of experimental results. The model
assumes a layer of fixed charge on the surface of the oxide with a diffuse layer of
opposite charges in solution. The charges in the diffuse layer are distributed according to
the Boltzmann distribution. The model is incorporated into the computer code
MINEQL+ (Environmental Research Software). The reasons for choosing the diffuse
layer model are: (i) it has the least number of fitting parameters as a result of the simple
physical representation of the interface, and (ii) since the diffuse layers of a particle and
collector overlap upon close approach, it is necessary to have a diffuse layer included in a
model relating to particle deposition.
Restating the equilibrium constant expressions given in Equations (2.13) and
(2.14) in terms of an electrostatic correction factor gives
Kint
=
[== MeOH1H+) ex{-FlfIo)=KaPPex{_ FlfIo)al [==MeOH;] RT al RT (2.17)
Kint
=
[== MeO-](H+) ex{-FlfI 0)=
KaPP ex{-FlfI 0) ,a2 [== MeOH] RT a2 RT (2.18)
where lfIo is the surface potential and the superscript "app" indicates apparent constants
which vary with surface charge and pH. Apparent constants can be determined
experimentally, while intrinsic constants are determined by extrapolating apparent
constants to zero surface charge.
2.4.4 Adsorption of Anions on Hematite
The deposition rate of hematite particles in packed beds of silica sand is expected
affects the hematite surface charge and potential. It should be noted that anion adsorption
on silica (sand grains) is not expected to be important. There is no evidence that anions
(either inorganic or organic) adsorb appreciably to silica surfaces at near neutral pH
(experiments for this work were conducted at pH 6.5). Davis (1982) observed
measurable amounts of natural organic matter on colloidal silica only at pH values less
than 3. Therefore, the adsorption of anions on hematite will only be considered.
Specific adsorption can often be modeled as a ligand exchange process (Stumm et
aI., 1980), in which anion surface complexation releases hydroxyl ions:
(2.19)
The formation of bidentate complexes is possible, depending on ligand size and spacing
of surface coordination sites. Examples of possible surface complexation reactions
between hematite and a diprotic acid (e.g., oxalic acid or phthalic acid) are depicted in
Figure 2.5. The effect of anion adsorption on the surface charge of hematite can be
illustrated by the general equation for surface charge (a):
(2.20)
where F, Sa, and Sc are as described in Equation (2.15) and Zj is the valence on anion Aj •
If the affinity of an anion for the hematite surface is strong enough, specific adsorption
may not only reduce the magnitude of the surface charge, but also reverse its sign. This
has been observed by Liang (1988) for the adsorption of phosphate, humic acid, and other
anions on hematite below pHzpc (Le., hematite has a positive surface charge in the
absence of specifically adsorbed anions). Kallay and Matijevic (1985) also observed the
SUR FACE
SOLUTiON
SURFACE
OH2$
.x
w
It
K:l
~K1\l
IJJQ
+
K.1
..
HX
0OH
H2
X
.
.
..
x
Ka1U
><0
11
~2
HX
9
~Khll
00
8
Ka2lf
'. ex
2e
x·
Figure 2.5: Schematic representation of possible surface complexation reactions of the
diprotic acid H2X (e.g., oxalic acid or phthalic acid) with the surface hydroxyl groups of
The tendency of an anion to form surface complexes follows the same trend as the
anion's tendency to form anion-metal complexes in solution (Stumm and Morgan, 1981).
Therefore, strong complexes in solution correspond to strong complexes at the metal
oxide surface. This allows the equilibrium constants for an anion surface complex to be
estimated from equilibrium constants for solution complexes, when equilibrium constants
3. Materials and Methods
3.0 General Remarks
All solutions were prepared with deionized water purified by a Millipore Milli-Q
UV Plus system (R=18.2 MQ cm). Reagents were analytical grade and were used
without further treatment. One fulvic and two humic acids were obtained from the
International Humic Substances Society. The humic acids were leonardite humic acid
which was isolated from a leonardite (also referred to as lignite) deposit (oxidized coal)
in southeastern North Dakota, U.S.A.; and Suwannee River humic acid which was
isolated from the Suwannee River near Fargo, Georgia, U.S.A. The fulvic acid was
Suwannee River fulvic acid.
In general, pyrex glassware was used. The glassware was first cleaned in an
ultrasonic bath (Bransonic model 1210) with a detergent solution (Micro® cleaning
solution), soaked in 2.5 molar nitric acid at 45° C, rinsed with Milli-Q water, and finally
oven dried.
The pH of solution was monitored using a Beckman glass combination electrode
(BK 511063) and a pH meter (Beckman model <1>11 pH meter). NIST buffers were used
to calibrate the pH electrode.
3.1 Particle Preparation and Characterization
3.1.1 Preparation of Hematite Particles
Hematite particles (u-Fe203) were synthesized following the method of Liang
Milli-Q water preheated to 100° C and mixed. The dilution ratio was 1 to 20, and the
final solution concentrations of Wand Fe (III) were 0.05 M and 0.035 M, respectively.
The mixture was covered and placed in an oven at 100° C for 24 hours. The forced
hydrolysis process that results in hematite formation can be described by
2Fe3+
+
3H20 = Fe203(S)+
6H+ . (3.1)After the 24-hour heating period, the suspension was cooled to room temperature. The
supernatant was drawn off and the remaining particles were soaked in 0.01 M HCI04 for
24 hours. The procedure was repeated three times in order to remove amorphous iron
oxide coatings that might be present (Faust, 1985). The final suspension was stored as
stock at pH-3. The maximum yield of hematite particles possible from this synthesis
procedure is approximately 4 g, when starting from a 1 liter mixture of Fe(CI04)iHCI04
solution and heated Milli-Q water. However, due to incomplete conversion of Fe (III) to
hematite (U-Fe203) and loss of particles in the repeated removal of supernatant solutions,
the actual yield of hematite particles was approximately 1 g.
3.1.2 Particle Characterization
The mineral phase of the synthesized particles was determined by X-ray
diffraction analysis using a Scintag PAD-5 X-Ray Diffractometer with an automated SI2S
goniometer. The observed diffraction pattern for the synthesized particles (Figure 3.1,
top) is very similar to the diffraction pattern of standard hematite (Figure 3.1, bottom).
This confirms that the synthesis procedure was successful in producing hematite as the
bulk material.
The size and shape of the hematite particles were determined by TEM (Phillips
Prepared Hematite
5
IRON OXIDE / HEMATITE, STANDARD
Figure 3.1: X-ray diffraction pattern of hematite prepared for this research (top)
compared to the diffraction pattern for a hematite standard (bottom). The patterns match,
suggesting that the synthesis procedure was successful in producing hematite.
each synthesis influence the particle size and shape (Matijevic and Scheiner, 1978). Plate
I shows the particles to be approximately spherical with an average diameter of 67 nm
(taken as average of 20 particles). Additional information on particle size was obtained
using the technique of dynamic light scattering to measure the hydrodynamic size
(ZetaPALS with a particle sizing BI-MAS accessory, Brookhaven Instruments, N.Y.).
The hydrodynamic diameter was observed to be 82 ± 2 nm. One would expect the
hydrodynamic diameter to be larger than the actual diameter because it is the diameter of
a hypothetical hard sphere that diffuses with the same speed as the particle under
consideration. However, the synthesized hematite particles are not perfect spheres, they
tumble, and have water molecules associated with them which would result in the
measured hydrodynamic diameter being greater than the actual diameter. In subsequent
Plate I: Transmission electron micrograph of synthesized hematite particles used in this
micrographs (i.e., 67 nm) will be used. The properties of the hematite particles used in this study and others (both coagulation and deposition studies) are summarized in Table 3.1.
Reference Sample Preparation Particle pHzpc:
diameter (nm)
Liang (1988) Hydrolysis of Fe(CI04) at 70 8.5
(Coagulation) lOO"C
Tiller (1993) Hydrolysis of FeCh at lOO"C 60 9.5
(Coagulation)
Kuo and Matijevic (1980) Hydrolysis of FeCI3 at lOO"C 170 7.5 (Deposition)
Amirbahman and Olson (1993) Hydrolysis of Fe(CI04) at 170 6.5
(Deposition) lOO"C
This work Hydrolysis of Fe(CI04) at 67 7.5
(Deposition) lOO"C
Table 3.1: Comparison of hematite properties.
3.2 Particle Surface Properties 3.2.1 Specific Surface Area
The specific surface area was calculated by assuming that the particles were perfect spheres. Under this assumption, the specific surface area, Sa, was estimated to be
17.1 m2/g using the following equation:
S -
1 ( 1Td2 ) - 6a -
Ii
1Td3/6 - pd (3.2)where p is the density (taken as 5.24 g/cm3) and d is the particle diameter (67 nm, as
detennined by TEM). 3.2.2 Surface Site Density
approximately spherical hematite particles with an average diameter of 70 nm). Liang
(1988) studied the effect of surface chemistry on coagulation kinetics and was a valuable
resource for this particle deposition study. Due to these similarities and the need to
conserve particles so that the experimental program could be completed using the same
batch of particles, the surface site density for the particles of this study was taken to be
that measured for Liang's particles (4.98 ± 0.5 sites/nmz).
3.3 Granular Porous Medium
3.3.1 Porous Medium Physical and Chemical Composition
A silica sand (Ottawa 30 sand, U.S. Silica, Ottawa, IL) was used as the model
collectors in this research. The chemical composition of Ottawa 30 sand, as reported by
the manufacturer, is given in Table 3.2.
Sieve analysis of the sand, shown in Figure 3.2, was performed by Eylers (1994),
who used the Ottawa 30 sand along with another sand to study the transport of metal ions
between stream water and sediment bed. The geometric mean (dg) and the geometric
standard deviation (O"g) for the grain size, computed for the middle 80% of the size
distribution, are 500 /lm and 1.25, respectively. Plate II shows a photograph of some
Ottawa 30 sand grains magnified 5 times (Zeiss Axioplan 2 Imaging equipped with an
Axiocam digital camera). The shape of the grains is prolate spheroidal with a nominal
grain diameter of 520 /lm. The nominal grain diameter was determined by averaging the
Mineral Ottawa 30 sand
Si02 99.81%
Fe203 0.015%
Ah0 3 0.042%
Ti02 0.013%
CaO <0.01%
MgO <0.01%
Na20 <0.01%
Table 3.2: Chemical composition of Ottawa 30 sand (as reported by the supplier) .
99
90
70
50
30
10
10.1
••
:. .
/
... +
... :
...
~...
~... /: ...
~:... ..
: : : : A I ' : .:
~: : 1":
:
~ :
.
~/
1
.
··· .... r··· ..
···r···l···-;( ...
j ...
-r ... .
.. · .. ··· .. ·i .. ·· .... ·· .. ··; .. ·· .... ··· ... ··· ....
·i· .. ·:/:·· ..
··~·
... · ....
i···· .. ·· ..
··1 .. · .. · .. ···
: ; . : : :
: r : : :
··· .. ·~···:···7'·~·· ... ~ ... : ···l···
... \ ...
~
... /: ...
~
... ··l···· .. ··· .... · ..
·t···· ..
···l··· .. ··· .. ·
/'.
.
~;
... L
...
.L ..
/.~
...
l. ...
.
...
L
... 1
... ;. ... .
~.~ : ~ ~ ~
~
,~
:~
:
/
:. , :
...
~~... L ...
! ...
L
... L
... L
... .
/'j
!
..
l
~ j :.
, ,50
70
100
200
300
Mesh opening
(f.1IIl)500 700 1000
Plate il: Darkfield photograph (under 5x magnification) of the sand grains used in this
The porosity (pore space/total volume) of the Ottawa 30 sand was determined by measuring the volume of water required to fill the pore space of a sand bed packed by the "tap and fill" method which is the same way columns were packed for deposition experiments. In the tap and fill method, sand is slowly poured into a column containing water while the column is continuously tapped with a rubber mallet. Maintaining a free surface of water during the filling process keeps air bubbles from being incorporated in the sand bed, and continuous tapping allows for uniform packing. The porosity of Ottawa 30 sand determined in this manner was 0.34. The mineral density of the sand was found to be 2.63 glcm3 by placing a known amount of dry sand in a graduated cylinder and measuring the volume of water displaced.
3.3.2 Cleaning of Porous Medium
The sand cleaning procedure employed in this research was similar to that used by Elimelech et al. (2000). The steps are as follows:
1. Sonicate for 30 minutes in deionized water.
2. Soak in Sodium dithionite (0.1 M Na2S204) for 4 hours to remove surface impurities such as iron and manganese oxides.
3. Soak in chromic/sulfuric acid cleaning solution (Chromerge, Fisher Scientific, Pittsburgh, PA) for 12 hours.
4. Sonicate for 30 minutes in deionized water.
5. Soak in 5% hydrogen peroxide for 4 hours to remove organic impurities. 6. Soak in chromic/sulfuric acid cleaning solution for 12 hours.
9. Sonicate for 30 minutes in deionized water.
10. Dry at 50° C and store in sealed flask.
Between each of the above steps, the sand was repeatedly washed with deionized water
until the conductivity of the supernatant was equal to that of deionized water (- 2 j.tS/cm).
3.4 Electrophoretic Mobility Measurements
3.4.1 Electrophoretic Mobility of Hematite Particles
Hematite particle mobilities were measured using a ZetaP ALS instrument
(Brookhaven Instruments, N.Y.). The ZetaPALS determines particles mobilities using
~hase Analysis Light ~cattering. Samples were prepared by adding appropriate amounts
of Milli-Q water, NaCl stock, hematite stock, and specifically adsorbed ligand stock to a
glass cuvette (total sample volume was 1.4 mL). The samples were ultrasonicated (in the
glass cuvette) for 20 seconds (Bransonic model 1210 bath), the electrode assembly was
inserted, and the mobility measurement was started.
It would have been ideal to use the same particle concentration as in the
deposition experiments (influent concentration of 1 mg/L), since the particle mobility
measurements were made to assist in the interpretation of the particle deposition results.
However, preliminary measurements showed that a particle concentration of at least 10
mg/L was needed to give reproducible results. As the particle concentration approached
100 mg/L, the sample became too turbid for reproducible results. Therefore, the particle
mobility measurements were made using 10 mg/L hematite. Some of the measurements
were repeated using 50 mg/L, in order to elucidate the effect of particle concentration on
3.4.2 Electrophoretic Mobility of Sand Particles
For electrophoretic mobility studies, particles within the colloidal size range are
needed so as to avoid settling. Therefore, whole sand grains can't be used in such
measurements. Typically, sand grains are ground into particles suitable for
electrophoretic mobility measurements using a mortar and pestle (Amirbahman and
Olson, 1993) or rock mill (Johnson, 1999). To generate sub-micron sized sand particles
for this research, the approach of Johnson et al. (1996) was used in which sand grains
were ultrasonicated in deionized water for 10 minutes. Approximately 100 mL of sand
and 200 mL of Milli-Q water were used. The supernatant becomes turbid as a result of
sand particles being removed from the surface of the sand grains. This sand particle
suspension was diluted by a factor of 25 to make electrophoretic mobility measurements
in the same manner as the hematite particle mobility measurements. The size of the sand
particles was also measured on the ZetaPALS instrument. A bi-modal distribution was
observed with peaks at about 200 and 600 nm.
3.5 Particle Deposition Experiments
3.5.1 Experimental Apparatus for Particle Deposition
The model system for particle deposition was made up of the silica sand (Ottawa
30) packed in a cylindrical column. The experimental apparatus used in this research is
described schematically in Figure 3.3 and is comprised of the following components:
a) H20 reservoir (pH 6.5 Milli-Q H20 in 300 mL flask)
b) Particle suspension (2 mg/L hematite, pH 6.5, in a 125 mL flask)
c) Peristaltic pump with adjustable flow rate of 0-5 mUmin (Masterfiex model
~o
T-valve
Particle Suspension
Feed Pump #1
Influent sampling + __ -\
Spectrophotometer with flow-through cell
Effluent Pump
Figure 3.3: Schematic diagram of the particle deposition apparatus.
NaCI and Ugand
In fluent reservoir
eight-roller mini-cartridge pump head (Ismatec model 95600-36, Cole-Parmer
Instrument Co.).
d) NaClIligand solution (2 mM NaCl, variable ligand concentration, pH 6.5, in a
300 mL flask).
e) Isocratic pump with adjustable flow rate of 0-10 mUmin (Model G13IOA,
series 1100 iso-pump, Hewlett Packard).
f) Series of ten tubing expansions and contractions for mixing.
g) Cylindrical pyrex glass column of 3.07 cm inner diameter (7.4 cm2) with a
teflon end fitting containing teflon support mesh (125 /lm pore size).
h) Peristaltic pump (similar to one previously described) to control effluent flow
rate.
i) Spectrophotometer (diode array, model 8452A, Hewlett Packard) with a 2.5
cm flow-through cell used to quantify particle concentration.
Teflon tubing (0.8 mm Ld.) was used to transfer the solutions and suspensions in
the model system, except at the peristaltic pumps where tygon tubing (1.5 mm Ld.) was
used. The various valves and fittings were made of polypropylene. Four identical
column assemblies were made so that the experimental program could be executed more
rapidly. Each column was comprised of a 7.5 cm piece of pyrex tubing (3.07 cm Ld.)
with a teflon end fitting attached to one end. The end fitting held the teflon mesh (125
/lm pore size) that supported the sand bed and collected the column effluent in grooves
connected to the effluent tube. The end fittings for the columns and the 2.5 cm
flow-through cell were machined by the researcher from solid teflon blocks. Quartz windows
3.5.2 Particle Deposition Procedure
A typical particle deposition experiment consisted of measuring the concentration
of particles leaving the column (described earlier) packed with silica sand as a function of
time. The influent particle concentration is kept constant, by design. Here a list of the
steps involved in a deposition run is given followed by a more detailed description:
Pre-run
1) Place column, filled with Milli-Q water, in vacuum chamber to remove air
pockets below the support mesh.
2) Wet pack column with clean Ottawa 30 sand by tap and fill method (described
earlier).
3) Condition column by flowing solution of the same chemistry (minus particles)
as subsequent deposition experiment (10-15 pore volumes).
4) Adjust flow rate.
5) Measure influent particle concentration.
Actual deposition experiment
6) Start step input of particle suspension (defines t=O); measure effluent particle
concentration at 5 second intervals (forward particle breakthrough).
7) Start step input of particle-free solution (reverse particle breakthrough).
8) Stop column flow.
Post-run
9) Remove sand from column.
All of the particle deposition data to be presented were obtained using a bed depth
of 5 cm. The mass of sand required for this bed depth was 64.2 g, which was calculated
using the total volume of the column ({ column cross-sectional area} x {bed depth}
=
7.4cm2 x 5 cm
=
37 cm3), bed porosity (0.34), and mineral density of sand (2.63 g/cm3). Thecolumn was packed with sand by slowly pouring clean, dried sand into the column fil1ed
with Milli-Q water while continuously tapping the side of the column with a rubber
mallet. The sand bed was flushed with Milli-Q water to remove fines by allowing about
5 pore volumes to flow downward through the column unrestricted. The effluent tubing
was then connected to the bottom of the column, thus placing the effluent flow rate under
the control of the effluent pump. As Figure 3.3 illustrates, the top of the column is open
to the atmosphere with a layer of solution (influent reservoir) over the surface of the sand
bed. The influent reservoir must be maintained in order for saturated flow to continue.
This design was chosen because it makes possible the sampling of influent during a
particle deposition run.
The desired solution chemistry in the column influent was produced by
combining the flow of two streams. This was done in order to avoid particle aggregation
which would make the interpretation of deposition results untenable. One stream
contained the appropriate amounts of NaCI and the specifically adsorbed solute under
consideration, while the other stream contained the appropriate amount of hematite
particles. The pH of the NaCllligand solution and the particle suspension was 6.5. After
the two streams were mixed ahead of the column, by a series of 10 expansions and
contractions, the pH of the column influent was 6.5 ± 0.05. For all deposition
Prior to the actual particle deposition phase of an experiment, a particle-fre