Scenario-based Application of Neighborhood Greening Methods towards Mitigating
Urban Heat Environment in a World Heritage Site - Malacca, Malaysia
Kei Saito1, Ismail Said1 and Michihiko Shinozaki2
1 Department of Landscape Architecture, Faculty of Built Environment, University Technology
Malaysia, Johor, Malaysia. Email: kei@utm.my, b-ismail@utm.my
2 Architecture and Urban Design Course, College of Engineering and Design, Shibaura Institute of
Technology, Tokyo, Japan. Email: sinozaki@shibaura-it.ac.jp
Malacca city, located on the west coast of the central part of the Malaysian Peninsula, has been designated as a UNESCO World Heritage Site. At present, it is feared that the urban heat environmental condition will gradually worsen in the future. Employing a new design approach that modifies the surrounding heat environment by creating organically linked neighborhood green spaces, which encourage pedestrian walkability, will assist in efforts to conserve and improve the town as a sustainable heritage site. Through this research, firstly, future greening potential area were extracted based on the field survey and the results of the overlaid site appraisals which encompass microclimatic factor, visibility to the historical landscape elements and theoretical pedestrian movements by implementing computer simulation techniques. Based on the identified potential greening area, the three neighborhood greening scenarios were set: 1) based on the existing condition, 2) type of following existing conservation design guideline, and 3) type of maximized greening area with new pedestirian pathways. Then, the microclimate simulation was carried out for respective scenarios and the comparative study was made specifically from the viewpoint of where and how much each scenario could contribute to the urban heat environment mitigation through the investigation of changes of micrclimate conditions such as ambient temperature and surface temperature. From the results, we confirmed that the neighborhood greening approaches proposed through this study has been effectively functioned as a streetscape conservation-oriented urban heat environment improvement methods for historical town in a tropical region.
Keywords: Heritage Site, Neighborhood Greening, Urban Heat Mitigation, Walkability, Microclimate
1.0 Introduction
focusing on the aspect of mitigating urban heat environment by applying several scenario-based neighborhood greening approaches.
2.0 Methodology
This research is applied case study based on the previous paper (Saito, 2014b), which demonstrates future potential greening areas within the same study area through the analytical determining approaches by combining the result of several important aspects: urban microclimate and urban design qualities (accessibility, connectivity and visibility) and existing conservation design guideline. Initially, to set the three different scenarios including existing condition by referring to the result of that previous paper. In this step, the following two scenarios are proposed: 1. Greening in accordance with the existing conservation plan and design guideline in the study area, and 2. Greening maximally with street planting along the proposed pedestrian walkway by considering existing condition. Then, to make greening implemented digital urban models based on those three scenarios by using CAD and Geographic Information System (GIS) as a main spatial data management and editing tools. Subsequently, carrying out the computer simulation with microclimate models
(ENVI-met). As a result, urban microclimatic conditions in particular indices such as ambient air temperature and surface temperature are derived as an important environmental indicator. Based on the results, to analyze detail microclimatic conditions depend on the each scenario, especially by focusing on the changes of temperature distribution patterns and sectional profile on the representative streets. After synthesizing the results from these steps mentioned above, the findings about future neighborhood greening and its potential contribution to improving walkability along with the urban heat environment mitigation is discussed. The flow of main contents is summarized in the Figure 1.
2.1 Relationship with relevant previous works
To achieve the purpose mentioned in the previous section, this research combines and applies spatial data, analytical tools, and procedures that were used in previous studies done by authors. Saito (2013b) developed the fundamental research base including a spatial database, relevant planning documents in Malaysia, and analytical tools and procedures for microclimatic simulation by applying computer simulations and visibility studies using Space Syntax theory. In particular, with regard to microclimatic analysis in a tropical region, aspects of the outdoor physical environment such as air temperature, wind speed, and relative humidity were investigated by applying computer simulation models in a newly developed housing area with several blocks scale (Saito, 2011 and 2013a). From the aspects of a data acquisition and analysis tools, the merits and demerits of approaches that apply digital technologies, such as development and management of spatial databases, and data integration as a contribution to understanding the urban physical environment, were discussed by Saito (2014a). By combining the developed spatial database and analytical techniques which are mentioned above, the future potential greening area which could be expected to improve neighborhood walkability are identified through analytical approaches which combined three different perspectives: the urban heat environment, urban design/configuration, and existing development plans/directions. On the basis of those previous related works, this study attempts to apply and implement the results and findings as a contribution to obtaining new greening design methods for improving walkability in a world heritage site in a tropical region through a quantitative analysis based on the neighborhood greening scenarios.
2.2 Selection of case study area
present in the central area of the town, which was registered as a UNESCO World Heritage Site in 2008. The designated heritage site encompasses two zones: the core zone (0.37 km2) and a buffer zone (1.69 km2) surrounding the core zone. This study narrows the study area to an area measuring 480 m × 320 m, including the Malacca River that flows through the town center (Figure 2(b)), for further micro-scale consideration.
(a) Location of Malacca (b) The UNESCO-designated historical area Figure 2: Malacca, Malaysia
2.3 Spatial database and system framework
The major data sources used, which include digital and non-digital spatial data and officially observed climatic data, are listed in Table 1. The most significant basement data for this study were developed by the local authority, and several necessary data for analysis were prepared by the author.
Table 1: Stored Spatial Database
3.0 Neighborhood Greening Models
By applying the previous paper mentioned in the section 2.1, the neighborhood greening models are set based on the future potential greening area by considering several analytic viewpoints. In this step, to come up with the several scenarios from the different approaches, then each scenario is used as a subjective of comparison study with the effects of urban heat environment mitigation using microclimate simulation in the next chapter.
3.1 Greening Scenarios Setting
Initially, to make the scenarios towards neighborhood greenings models for the next step. In here, the three different scenarios including existing conditions are described. The Case 1 is the existing condition and regarded as a baseline model for the comparative analysis. Next, the Case 2 is the minimum greening implemented models by following the landscape plans and design guidelines of the existing conservation and management plan (Melaka Town and Country Planning Department, 2008b
Category Type Source from
2D Vector (Polygon) Cadstral Data (Lot) Local Authority
Block Original (Based on Cadstral Data)
Building Footprint Original (Based on Cadstral Data + Field Survey)
Building Height Original (Based on Field Survey + Panoramic Photos of Building Facade) Current Landuse
2D Vector (Line) Road Local Authority
River Local Authority
2D Vector (Point) Planting Field Survey + Aerial Photos Image data Aerial Photos Local Authority + Aerial Photos
Paper-based Map Topographic Map Department Survey and Mapping Malaysia Observatory data
and 2008c). Finally the Case 3 is the maximum greening implemented models including a covered pedestrian walkway by planted trees and new connection pathways with back lane covered by permeable surface materials, designed in accordance with the urban configurational aspect such as built form, street width and layout, and open spaces distribution. As a key basic concept, both of the Case 2 and Case 3 are planned to enhance a future walkability within the study area through a neighborhood greening. Especially in the Case 3, putting a priority on a quantitative measurement of an extent of urban heat environment mitigation through the greening and implementing new pathway, rather than a feasibility of the scenario contents in the future. The details of the each proposed planned scenario are described in Table 2. And Table 3 shows the breakdown of the study area’s Green Coverage Ratio (GCR) as a basis for knowing and measuring of the green space distribution on the each scenario. This shows the GCR is only 1.0%, 2.9% and significantly increased 12.6% on the Case 1, Case 2 and Case 3 respectively.
Table 2: Greening Scenarios
Basic ideas / directions Detail Plan / Actions
Case 1: Existing condition -
Case 2:
Following the existing conservation plan and detailed guideline (Melaka Town and Country Planning Department, 2008b and 2008c)
1. Replacing existing on-street parking zone with Green Walkway (covered by permeable surface using grasscrete paver)
2. Potted plant (Not included in the microclimate simulation)
Case 3: Proposing newly vegetation, open walkway and neighborhood pathway
1. Open Walkway (Covered by Terracotta Tiles) with 1.5 m in width along the shop houses especially on 9 m width road
2. Trees (Cratoxylon Formosum) and Car park with 2.4 m in width along the Open Walkway. The tree pairs are proposed in alignment with the party walls of the shophouses (5 - 6 m varies) so that the building façade could be opened to the open walkway and road (Refer to Figure 6).
3. Three new neighborhood pathway for connecting a major street with an inner-street (back lane). Refer to Saito, 2014b
4. Replacing existing unutilized back lane with Green Walkway (covered by grasscrete paver)
Table 3: Calculation of GCR (Green Coverage Ratio)
Through these scenarios above, the following things are expected to make a positive impact to the area.
• Improvement of walkability by organically connecting pedestrian walkway.
• Reducing urban heat environment especially from the aspect of air temperature and surface
temperature by providing shaded area by planted trees. Total 220 trees are newly proposed (currently 53 trees within the study area)
• Reducing number of on-street car parking by providing trees planting (Reducing the number of
parked car to less than half of the current condition.)
3.2 Implementing Green Spaces Based on the Scenarios
Secondly, implementing and making digital models of green spaces and pedestrian walkways to the study area by following scenarios that came up with in the previous subsection. In here, the potential area for future greening is applied as a basis, which is objectively calculated based on the different perspectives considered several important aspects (Urban Microclimate, Urban Configuration, and Existing Conservation Plan) in the previous paper. As the Figure 4 shows, the areas that are implemented the neighborhood greening plan by following scenario-based guideline described in
Trees Coverage
Area (m2) Green Spaces(m2) Trees CoverageArea (m2) Walkway (mGreen 2) Inner Walkway(m2) Green Spaces(m2) (C) =
(A) + (B) (D) (C) / (D) * 100
Case 1 1,099.6 373.5 0.0 0.0 0.0 0.0 1,473.1 153,600.0 1.0
Case 2 1,099.6 373.5 0.0 3,015.3 0.0 0.0 4,488.4 153,600.0 2.9
Case 3 1,099.6 373.5 10,666.3 0.0 5,835.1 1,417.3 19,391.8 153,600.0 12.6
Existing Setting Proposed Neighborhood Greening Area Total Green Coverage Area
(m2)
Total Study Area (480 x 320 m)
(m2)
GCR (%)
Table 2 are proposed. Those areas are basically on the pink color zone in Figure 4, which are derived from combined two top potential areas for future greening shown in the Figure 3. Additionally, in the Case 3, the three neighborhood pathways exclusive for pedestrian are proposed. These are intended to connect major streets and narrow back lane, and are supported by an improvement of the Integration Value based on the Space Syntax Theory and combined with existing buildings conditions along the streets. And the open walkways, which have 1.5 m in width along major streets, are proposed (Refer to the Figure 5(b)). Those open walkways are provided both sides (for the 9 m width streets) and one side (for the 6 m width streets) in accordance to the width of existing major streets. In addition to that, proposing street planting on the created vacant spaces after reducing the number of existing on-street car parking that are uninterruptedly seen on site to less than half. As for the street planting, the trees are (total 220 trees) implemented to one side of the streets due to the space limitation regardless width of streets. The detailed information about design components and dimensions are described in Table 2, Figure 5 and 6. The digital models after implemented all greening based on the each scenario are converted to the GIS format and stored in spatial database with other layers accordingly.
4.0 Effects of Each Greening Scenario on
Surrounding Microclimate Conditions
In this chapter, the microclimate simulation is carried out using the digital modeling data by
implementing scenario-based neighborhood greening in the section 3.2. With regard to the numerical results derived from the simulation, the comparative analysis are made especially focusing on ambient air temperature as well as surface temperature, which has a significant influence over an urban heat Figure 3: Potential Area for Future Neighborhood
Greening (Saito 2014b)
Figure 4: Neighborhood Greening Scenario based on the Higher Potential Area
(By coambining Rank 3 and 4 on Figure 3)
environment. As the previous paper (Saito, 2014b) confirmed and pointed out, an index of the wind velocity is excluded form the analysis because of no significant changes due to the low prevailing wind all year round in this region (Refer to the initial setting for microclimate simulation in Table 4).
4.1 Simulation of Neighborhood outdoor environment
A microclimatic simulation within the 480 m × 320 m area in the Malacca heritage site is conducted. This simulation model mainly considers the aspects of building height, tree height, and existing land-cover conditions in three-dimensional space using an ENVI-met 1 simulation model. Table 2 lists the initial settings 2 used in the simulation. The grid size (2 m × 2 m × 2.5 m) and the number of grids (240 × 160 × 20; x, y, z) are fixed. The types of land cover are categorized into three types: soil 3, concrete 3, and asphalt 3. The buildings 4, grass 5, and trees that include height information are located on these land covers.
Table 4: Initial Parameter Settings
Date June 21, 2012*
Duration 24 hours (6 pm June 20 to 6 pm June 21) Wind Velocity 1.8 m/s** at 10 m above the ground
Wind Direction 45 degrees** (from North-East)
Temperature 301.3 K*** (28.1
°C)
Relative Humidity 80.5%***
*The day of Summer Solstice in 2012, Malacca **Yearly Prevailing Wind and Direction in 2012, Malacca ***Monthly Mean Value in June 2012, Malacca
4.2 Distribution of Air Temperature and Surface Temperature
Figure 5 and 6 shows the results of ambient air temperature and surface temperature distribution respectively based on each scenario at 2 pm and 1.5 m above the ground.
4.2.1 Air Temperature
From the overall perspective, the extent of changes of air temperature distribution pattern based on each scenario is not so obvious, in particular no observable changes between Case 1 and Case 2. However, a closer look at the result by considering streets width shows that the distribution patterns of lower temperature are extended until surrounding junctions on the relatively narrow width within the dotted circles in Case 2 (Figure 7(b)) compared with Case 1 (Figure 7(a)). And it is observed that the
1 ENVI-met is a three-dimensional microclimate model designed to simulate the surface-plant-air interactions in urban environment with a
typical resolution of 0.5 to 10 m in space and 10 sec in time. Further detailed information: http://www.model.envi-met.com/ (Last access: 31 May, 2015)
2 All initial input data are referred to the official observation data in 2012 at the nearest weather station from the study area by the Malaysian
Meteorological Department.
3 Albedo: Soil (0), Concrete (0.4), Asphalt (0.2) 4 Albedo: Wall (0.25), Roof (0.3)
5 Grass height: 0.10 m
low temperature distributions are seen on the back lane and are relatively narrow streets, then those areas are spreading towards the surrounding in the Case 3.
(a) Case 1 (b) Case 2 (c) Case 3
Figure 7: Air Temperature at 2 pm above the ground
4.2.2 Surface Temperature
Next, the distribution patterns of surface temperature are focused on from the same viewpoint as section 4.2.1. The result of the Case 2 (Figure 8(b)) shows that noticeable surface temperature reductions are seen on the green walkway covered by permeable materials using grasscrete paver. In the Case 3 (Figure 8(c)) shows that surface temperature reduction area are seen under the trees crown on the open walkway due to the solar radiation sheltering effect by trees. It is observed that those effects are spreading around the area just below the tree crown compared with the Case 2, which the areas of surface temperature reduced are limited only on the green walkway. The viewpoint of a relationship between temperature changes and location on the streets surface will be elaborated in detail in the later section 4.4.
(a) Case 1 (b) Case 2 (c) Case 3
Figure 8: Surface Temperature at 2 pm on the ground
4.3 Distribution of Subtraction Based on the Result of Each Scenario
Figure 9 and 10 shows the subtraction of the distribution pattern of ambient air temperature and surface temperature based on each scenario at 2 pm and 1.5 m above the ground using the result of Case 1 as a basis.
4.3.1 Subtraction of Air Temperature
(a) Case 2 – Case 1 (b) Case 3 – Case 1 Figure 9: Difference between the scenario (Air Temperature Distribution)
4.3.2 Subtraction of Surface Temperature
Next, the subtraction of surface temperature distribution is focused on here. As described in the 4.2.2, the reduction of surface temperature are seen only on the green walkways finished by grasscrete shown in Figure 10(a) in Case 2. Whereas, in Case 3 (Figure 10(b)), the effects of surface temperature reduction approximately 10 - 15 C° could be seen on the area about 5 m around tree crown cover on the ground due to the position of the sun at 2 pm.
(a) Case 2 – Case 1 (b) Case 3 – Case 1
Figure 10: Difference between the scenario (Surface Temperature Distribution)
4.4 Profile of Air and Surface Temperature Changes on the Pedestrian Walkway
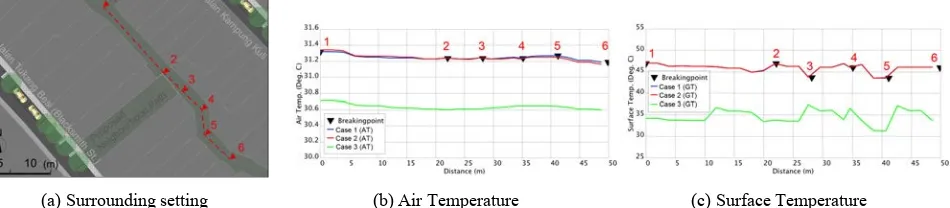
Addition to the distribution pattern analysis stated in the previous section, the extent of contribution to the reduction of air temperature and surface temperature on the streets in accordance with the street width are analyzed in detail through this section. The following three streets are chosen to observe the detail temperature changes on the street in cross section.
• On 9 m width street implemented pedestrian walkway to the both side (Section 1 in Figure 4) • On 6 m width street implemented pedestrian walkway to one side (Section 2 in Figure 4) • Back lane covered by permeable surface using grasscrete paver (Section 3 in Figure 4)
(a) Surrounding setting (b) Air Temperature (c) Surface Temperature Figure 11: Profile of Section 1 (about 9 m in width)
Next, the cross-sectional profile on the 6 m width street shown in Figure 12(a) is focused. The result of air temperature shown in Figure 12(b) describes the effects of air temperature reduction of Case 2 even though the difference between Case 1 and Case 2 is moderate as in the case with the condition on the 9 m width street. As for the comparison to the result of Case 3, the average air temperature reduction is approximately 0.4 - 0.5 C°. As a whole, the air temperature on this 6 m width street is approximately 0.5 C° higher compared with the result on the 9 m width street (Section 1). However, it was confirmed that the temperature reduction effect itself due to greening is slightly higher than on 9 m width because the degree of differences between before and after greening. And there is the proposed pocket park between breaking point 2 and 3 in Case 3, but no significant changes are seen in terms of air temperature reduction. Whereas, as for the changes of the surface temperature shown in Figure 12(c) describes that the localized effect to reduce surface temperature is seen especially on the location between breaking point 1 and 2 due to the presence or absence of street planting.
(a) Surrounding setting (b) Air Temperature (c) Surface Temperature Figure 12: Profile of Section 2 (about 6 m in width)
Finally, the cross-sectional profile on the back lane and proposed neighborhood pathway covered by grasscrete paver is focused. The result of air temperature shown in Figure 13(b) describes the moderate effect of reduction due to the permeable surface about 0.6 C° is seen on the back lane. There is the proposed neighborhood pedestrian pathway between breaking point 2 and 3 in Case 3, but no significant changes are seen in terms of air temperature reduction. As for the surface temperature shown in Figure 13(c), about 15 C° temperature reduction could be seen due to the differences of finished surface, but no noticeable effects are seen due to the proposed pedestrian pathway.
4.5 Average Air temperature and Surface Temperature on the Pedestrian Walkway
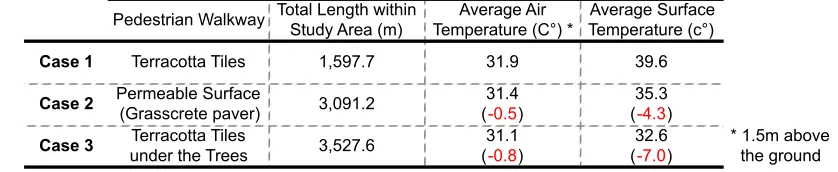
In here, the average air temperature and surface temperature on pedestrian walkway is highlighted in order to examine the degree of contribution to the temperature reduction in the whole study area by neighborhood greening through Case 1 (existing condition) and Case 2, 3 (proposing condition). As a result, Table 5 shows that average 0.5 C° and 0.8 C° reduction in air temperature on Case 2 and Case 3 respectively through comparison to the result of Case 1. Similarly, average 4.3 C° and 7.0 C° reduction in surface temperature on Case 2 and Case 3 respectively are confirmed.
Table 5: Air and Surface Temperature changes on the pedestrian walkway within the study area
5.0 Conclusion
Through this study, the objective comparative analysis focusing on the degree and extent of contribution to urban heat environment amelioration based on the scenario-based neighborhood greening and proposing pedestrian walkways are carried out. For that purpose, several objective analyses from the viewpoint of distribution pattern of air and surface temperature (section 4.2) and subtraction based on each scenario (section 4.3), and cross-sectional profile of both of air and surface temperature on different street width (section 4.4) have been made. As a result, obtained important findings are follows:
From section 4.2 and 4.3:
• Through the proposing pedestrian walkways covered by permeable materials, the effects to the
air and surface temperature reduction could be seen but those degree of contribution is not so significant and those extent is also limited just on the particular walkways (from Case 2).
• Whereas, through the proposing pedestrian walkways with street planting, it shows significant
contribution to reduce the surface temperature on the street under and around tree crown cover area. As a result, the proposed greenings have a significantly positive effect to reduce ambient air temperature and those effects could be widely spread towards surrounding area. It is expected that urban heat environment would be ameliorate within a whole study area not merely on the pedestrian walkway (from Case 3)
From section 4.4 and 4.5:
• It is cleared that the average air temperature on 6 m width streets is slightly higher than 9 m
width streets. It is considered that air temperature around relatively narrow streets get influenced by heat from surrounding building walls and surface of asphalt. However, a slightly higher degree of effects to the air temperature reduction is observed on the 6 m width streets. Hence, it is expected that there are higher potential through more active greening especially onto the narrow width streets.
• Regarding the relationship between the extent of greening in the study area (GCR) and
contribution to the amelioration of urban heat environment, by increasing the GCR to 2.9% (+1.9%) bring the area to drop average 0.5 C° in air temperature and 4.3 C° in surface temperature on the 1.5 m above the walkway and the ground covered by the permeable materials respectively (From Case 2). And, by increasing the GCR to 12.6% (+11.6%), it contributes to drop average 0.8 C° in air temperature and 7.0 C° in surface temperature by providing street planting along the proposed pedestrian open walkway (From Case 3).
As a conclusion, from proposing scenario-based neighborhood greening approaches which are aiming at enhancing future walkability with conserving historical buildings and streetscape, it is confirmed
Pedestrian Walkway Total Length within Study Area (m)
Average Air Temperature (C°) *
Average Surface Temperature (c°)
Case 1 Terracotta Tiles 1,597.7 31.9 39.6
Case 2 Permeable Surface
(Grasscrete paver) 3,091.2
31.4 (-0.5)
35.3 (-4.3)
that the average 0.8 C° and 7.0 C° reduction in air temperature and surface temperature respectively by overlaid shadow cast through the street planting which are total 272 (+220) trees in number along the newly proposed pedestrian walkway. These significant positive effects supported by scientific data show the expectation of enhancing the volume and flow of pedestrians by organically connecting each Point-Of-Interest such as an important historical building with walkway in the future. And in particular, the reducing the surface temperature through the street planting along the streets has considerable impact to ameliorate urban heat environment not only on the streets but also the whole study area. Additionally, this greening ways using street planting implemented has considered safeguarding a visibility to the historical buildings and streetscape carefully from the urban design perspective not only from the aspect of the physical environment. As a consequence, the neighborhood greening approaches proposed in this study has been effectively functioned as a streetscape conservation-oriented urban heat environment improvement methods for historical town in a tropical region. Furthermore, to continue an analytical study on reduction in traffic volume will be required to achieve the overarching goal of enriching the town through enhancing walkability in the Malacca World Heritage Site as a future study.
Acknowledgments
This study was supported by JSPS KAKENHI Grant Number 25420651.
References
Lin, Tzu-Ping and Matzarakis, A. (2008) ‘Tourism climate and thermal comfort in Sun Moon Lake, Taiwan’
International Journal of Biometeorology, 52: 281-290.
Melaka Town and Country Planning Department (2000) ‘Local Plan 2003 - 2015’.
Melaka Town and Country Planning Department (2008a) ‘Special Area Plan: Conservation Area Management Plan of Melaka Historical City, Melaka’.
Melaka Town and Country Planning Department (2008b) ‘Conservation Area Action Plan'.
Planning Department of the Government of the Hong Kong Special Administrative Region (2008). Urban Climatic Map and Standards for Wind Environment - Feasibility Study. Technical Input Report No.1: Methodologies and Findings of User's Wind Comfort Level Survey.
Rismanchiana, O. and Bellb, S. (2014) ‘Evidence-based spatial intervention for the regeneration of deteriorating urban areas: A case study from Tehran, Iran’ URBAN DESIGN International, 19: 1–21.
Saito, K., Ismail Said, Mohd Hisyam Rasidi and Shinozaki, M. (2011) ‘Quantitative Study of Relationship between Urban Structure and Ambient Microclimate in New Developed Housing Areas - Environmental-Friendly Housing Area Design Methods in Tropic Southeast Asia Part 1 –’, Journal of Architecture and Planning, Architectural Institute of Japan. 664: 1155-1162.
Saito, K, Ismail Said, Mohd Hisyam Rasidi and Shinozaki, M (2013a) ‘Quantitative Study on Green Coverage Ratio and Its Effectiveness of Ambient Temperature Reduction in Surrounding Terraced-House - Environmental-Friendly Housing Area Design Methods in Tropic Southeast Asia Part 2 –’, Journal of Architecture and Planning, Architectural Institute of Japan, 689: 1561-1567.
Saito, K., Ismail Said, and Shinozaki, M. (2013b) ‘A Study Towards Green Neighborhood Approaches in the Malacca World Heritage Site, Malaysia: Quantitative Analysis of Relationship between Historical Landscape Components and Green Spaces distribution’, In proceeding of the 12th International Congress of Asian Planning Schools Association, Taipei, Taiwan.
Saito, K. Ismail Said and Shinozaki, M. (2014b) ‘An Analytical Approach Toward Future Neighborhood Green Corridor for Enhancing Walkability in the context of World Heritage Site - Malacca, Malaysia’, In
proceeding of the 1st International Alliance for Sustainable Urbanization and Regeneration (IASUR), pp. 215-224.
Turner, A. (2001a) ‘From isovists to visibility graphs: a methodology for the analysis of architectural space’,
Environment and Planning B: Planning and Design. 28: 103-121.
Turner, A. (2001b) ‘Depthmap – A program to perform visibility graph analysis’, In proceedings of the 3rd International Space Syntax Symposium, Atlanta, US.
Turner, A. (2007) ‘To move through space: Lines of vision and movement’, In proceedings of the 6th International Space Syntax Symposium, Istanbul, Turkey.
URA: Urban Redevelopment Authority (Singapore) (1997) ‘Enhancing The Charms of Joo Chiat’, The Singapore Authority.