R E S E A R C H
Open Access
Detection method of flexion relaxation
phenomenon based on wavelets for patients with
low back pain
François Nougarou
1, Daniel Massicotte
1*and Martin Descarreaux
2Abstract
The flexion relaxation phenomenon (FRP) can be defined as a reduction or silence of myoelectric activity of the lumbar erector spinae muscle during full trunk flexion. It is typically absent in patients with chronic low back pain (LBP). Before any broad clinical utilization of this neuromuscular response can be made, effective, standardized, and accurate methods of identifying FRP limits are needed. However, this phenomenon is clearly more difficult to detect for LBP patients than for healthy patients. The main goal of this study is to develop an automated method based on wavelet transformation that would improve time point limits detection of surface electromyography signals of the FRP in case of LBP patients. Conventional visual identification and proposed automated methods of time point limits detection of relaxation phase were compared on experimental data using criteria of accuracy and repeatability based on physiological properties. The evaluation demonstrates that the use of wavelet transform (WT) yields better results than methods without wavelet decomposition. Furthermore, methods based on wavelet per packet transform are more effective than algorithms employing discrete WT. Compared to visual detection, in addition to demonstrating an obvious saving of time, the use of wavelet per packet transform improves the accuracy and repeatability in the detection of the FRP limits. These results clearly highlight the value of the proposed technique in identifying onset and offset of the flexion relaxation response in LBP subjects.
Keywords:Discrete wavelet transform, Wavelet per packets transform, Low back pain, Flexion relaxation phenomenon, Limit detection, sEMG signal
Introduction
Low back pain (LBP) is the most prevalent musculoskel-etal condition; its economic burden is very large and appears to be growing [1]. Persons seeking care for LBP constitute a substantial proportion of patients seen in primary care offices [2]. Although it is difficult to predict who among those with first episodes of LBP will develop recurrent or chronic symptoms, there has been a recent surge in the study of both clinical and biological markers of “potential chronicity”. Several authors have tried to characterize typical neuromuscular and kinematic patterns that distinguish the LBP patients from healthy partici-pants. Changes in feedforward EMG (Electromyogram)
activation [3,4], changes in erector spinae muscle fatigue characteristics [5], changes in the control of force produc-tion and movement producproduc-tion as well as changes in lum-bopelvic kinematics have all been described [6] as potential indicators of physiological adaptation to chronic LBP. Amongst the various physiological indicators of LBP, the flexion relaxation phenomenon (FRP) has been one of the most studied surface electromyographic (sEMG) responses.
The FRP is defined by a reduction of silence of myo-electric activity of the lumbar erector spinae (LES) muscle during full trunk flexion [7]. This neuromuscular response is likely triggered by growing mechanical load in the ligaments and disks of the lumbar spine which are highly innervated by mechanoreceptors and nociceptors monitoring proprioceptive and noxious stimuli [8]. The onset and offset of the flexion relaxation response, as well as the amplitude and kinematics of the FRP, can be * Correspondence:[email protected]
1Laboratory of Signals and Systems Integration (LSSI), Electrical and Computer Engineering Department, Université du Québec à Trois-Rivières, Trois-Rivières, QC G9A 5H7, Canada
Full list of author information is available at the end of the article
influenced by several factors such as loading of the trunk [9], lumbopelvic posture [9,10], angular trunk velocity [11], task repetition [12], and muscular fatigue [13,14]. Most importantly, persistent activation of the LES mus-cles during a full trunk flexion is typically observed in individuals with LBP as a protective“splinting”response to increase lumbar stabilization in response to pain or tissue injury [15,16]. The absence of the FRP in LBP patients has also been associated with muscle spasm [17], reduced range of motion [18], and exaggerated stretch reflexes [18].
The sEMG FRP response is characterized, in healthy individuals, by three distinct phases that can clearly be delimited from one another; these limits are far less dis-tinguishable in patients with LBP. FRP parameters are not only useful in fundamental research to study the underlying mechanisms of spinal stability, but their use in the clinical realm could also lead to significant devel-opment in the evaluation and clinical management of LBP. Effective, standardized, and accurate methods of identifying FRP limits are, however, needed before any broad clinical utilization of this neuromuscular response can be contemplated.
Determining the limits of the beginning and end of the FRP is performed manually. This manual process causes errors especially in the presence of strong non-stationary signals and presents a strong consumption of time. Therefore, automated algorithm methods of identi-fying these physiological events directly from sEMG sig-nals are clearly needed before any widely used clinical applications of the FRP can be developed. Because mus-cular activities appear during the FRP relaxation phase in case of LBP subjects, the determination of the relax-ation phase limits automatically is a non-trial problem for this kind of patients compared to healthy subjects. Indeed, in case of LBP subjects, the difference of ampli-tude between FRP phases is small and strong local impulses and artifacts appear during the relaxation phase. The contribution of this article consists in the de-velopment of an automated method based on wavelet transformation which would improve time limit detec-tion of sEMG FRP in case of LBP people. Convendetec-tional Discrete Wavelet Transform (DWT) and Wavelet Packet Transform (WPT) [16] are compared with visual meth-ods results obtained manually. Experimental system with real worlds data are used to validate our proposed ap-proach based on observation and quantization of two physiological proprieties. The wavelet transforms (WTs) DWT and WPT permit to decompose a signal in several sub-signals of different frequencies ranges while main-taining a strong accuracy in the time domain [16]. De-pending to the obtained wavelet decompositions which correspond to different groups of frequency, difference between FRP phases and artifacts can decrease. The idea
of the proposed method of FRP limits detection consists of taking advantage of time domain sub-signals obtained with wavelets transforms from the collected sEMG sig-nals. Instead of searching the limits of a single signal, we searched limits from all these sub-signals and realized an accurate detection based on all obtained limits.
Due to its ability to accurately analyze the time-frequency domain of non-stationary signals, WT appear in many works based on some bio-signals like sEMG signals [16-25] and in non-destructive evaluation to de-termine the time of fly information in the ultrasonic sig-nals [26]. Furthermore, the use of wavelets for the sEMG signals analysis is also legitimized by the fact that there is a similarity between the formation of a sEMG signal and the WT. The sEMG signal can be seen as a sum of little pulse waves named motor unit action potentials [17], and the WT is based on the fact that all signals are a sum of waves of different dilatations and translations [16]. WT is a powerful tool to cancel noises, as presented in [17] on sEMG signals. WT is also suc-cessfully used on sEMG signal in the following works: in [20] to automatically differentiate hand motions, in [21] to identify human emotions from face muscular activ-ities, in [22] to separate deep muscles contribution dur-ing calf contraction, and in [23] to study muscles contraction. Furthermore, the study of time and fre-quency domains of sEMG signals is essential: the time domain gives information about the strength, and fre-quency domain analysis returns information on fatigue and on used muscle fibers [24,27]. Moreover, in [25], the authors compare WT and Fourier transform for the esti-mation of fatigue. Authors of [18,19] address LBP and use WT in their data processing. However, even if WT is successfully used, in both cases the analyzed experi-mental tasks are different from the FPR task and these articles do not address the search for the limits of the re-laxation phase. In [18], wavelet decomposition is suc-cessfully applied on torso muscles sEMG signals to discriminate LBP and healthy subjects during a seating trunk rotation. In [19], a weight is attached to LBP patients and is suddenly dropped. WT helps to detect the drop on the spinal erector’s sEMG signal recorded during this task.
The following section describes the experimental set-up used to generate FRP sEMG signals. Background on WT and proposed methods are described in Section
“Proposed method based on WT”. Experimental results of the proposed FRP analysis based on wavelet methods are shown in Section“Experimental results and analysis”. Finally, the conclusions are proposed in the last section.
Experimental system and sEMG signal
standing position with arms crossed over their chest, subjects were instructed to bend forward as far as pos-sible during a 5-s movement period (flexion phase). Then, they were required to hold the fullyflexed position for a 3-s period and to return to the initial upright pos-ition. The extension phase lasted 5 s. Speed and duration of all the movement phases were standardized with a metronome. Each participant completed five flexion– ex-tension cycles or trials, notedU= 5.
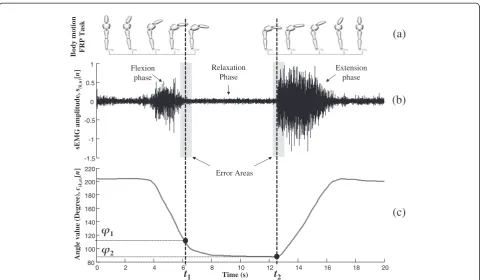
sEMG data were collected using bar bipolar active sur-face electrodes applied bilaterally over the LES at the level of lumbar vertebrae 5 (L5) approximately 3 cm from the mid-line (electrodes were applied in-line with muscle fiber direction). The two electrodes, placed on the left and right side of L5, simultaneously recorded muscle activities. The appearance of a sEMG FRP signal for the right sensor is shown in Figure 1b for a healthy subject. In this figure, all three phases of the back muscle activity can clearly be observed. Recall that the goal of the proposed algorithm is to automatically and accurately determine interval relaxation limits of time point t1and t2in Figure 1b. We noted error areas near each muscular activity limit in grey in Figure 1b. Those areas depict possible errors during limits detection. In our case, detection methods are applied to LBP subject and as shown in Figure 2 the limit determination is much difficult to realize. Indeed, in Figure 2, we can ob-serve the high non-stationarity of FRP signal for an LBP
subject compared to a healthy subject. However, it is es-sential to determine LBP FRP limits with good accuracy and good repeatability, in order to make inter-individual and intra-individual studies of FRP more reliable.
Electrode material was 99.9% Ag and interelectrode dis-tance was fixed at 10 mm. A ground electrode was placed on the left anterior superior iliac spine (ASIS) of each par-ticipant. Skin impedance was reduced by (i) shaving body hair, (ii) gently abrading the skin with fine-grade sand-paper (Red Dot Trace Prep, 3 M, St. Paul, MN, USA), and (iii) wiping the skin with alcohol swabs. sEMG activity was recorded using a single differential Delsys Surface sEMG sensor with a common mode rejection ratio of 92 dB at 60 Hz, a noise level of 1.2μV, a gain of 10 V/V ±1%, an input impedance of 1015 Ω (Model DE2.1, Delsys Inc., Boston, MA, USA) and sampled at FS= 1000Hz with a 12-bit A/D converter (PCI 6024E, National Instruments, Austin, TX, USA). The data were collected by LabView (National Instruments, Austin, TX, USA).
Additionally, kinematic data were collected by a mo-tion analysis system (OptotrakCertus, Northern Digital, Waterloo, ON, Canada). Light-emitting diodes were positioned on the right side of each participant on eight landmarks: lateral malleolus, lateral condyle of the femur, greater trochanter, ASIS, S2, L1, T12, and C7. The data were sampled at 100 Hz and low-pass filtered by a dual-pass, fourth-order Butterworth filter with a cutoff frequency at 5 Hz. An example of resulting
t
1-1.5 -1 -0.5 0 0.5 1
sEMG amplitude, s
(k,u)
[
n
]
0 2 4 6 8 10 12 14 16 18 20
80 100 120 140 160 180 200 220
Angle value (Degree),
c(k,u)
[
n
]
Time (s)
t
2Body motion FRP Task
Flexion phase
Extension phase Relaxation
Phase
1
2
(a)
(b)
(c)
Error Areas
kinematic angles data is shown in Figure 1c synchro-nized with the recorded sEMG signal in Figure 1b.
Due to the high non-stationarity of signal in case of LBP subjects, there are no obvious limits and the evaluation of their detection methods is a non-trivial problem. By ob-serving Figure 2, we can easily understand that visual detections could not be reliable enough to become a refer-ence to evaluate automatics methods. However, these kinematic data will allow us to evaluate our limits detec-tion methods. Indeed, two interesting physiological prop-erties between muscles activities relaxation interval limits
t1andt2and kinematics allow us to determine two assess-ment criteria. First, as shown in Figure 1c, limitst1andt2
obtained from this sEMG signal can be reported on the corresponding kinematic signal and convert into anglesϕ1
andϕ2. The physiological properties are as follow:
i. Ift1andt2are well determined, anglesφ1andφ2for
left and right sensors of a given trial have to be equivalent. This property represents our « accuracy criterion » described in expression (17) of Section
“Proposed evaluation method”;
ii. Ift1andt2are well determined, anglesφ1andφ2for
a given subject k and a given sensor have to be equivalent for all trials. This property constitutes our « repeatability criterion», defined in Section
“Proposed evaluation method”by the expression (18).
We evaluated the quality of our proposed methods using these properties in comparison with the conventional
approach based on visual detection of relaxation interval lim-its. From Figures 1 and 2, we observe the similitude to voice activity detection method developed to determine the limit of voice and non-voice intervals in the signal. Some previous work is done using WPT to determine these limits [28].
Proposed method based on WT General processing process
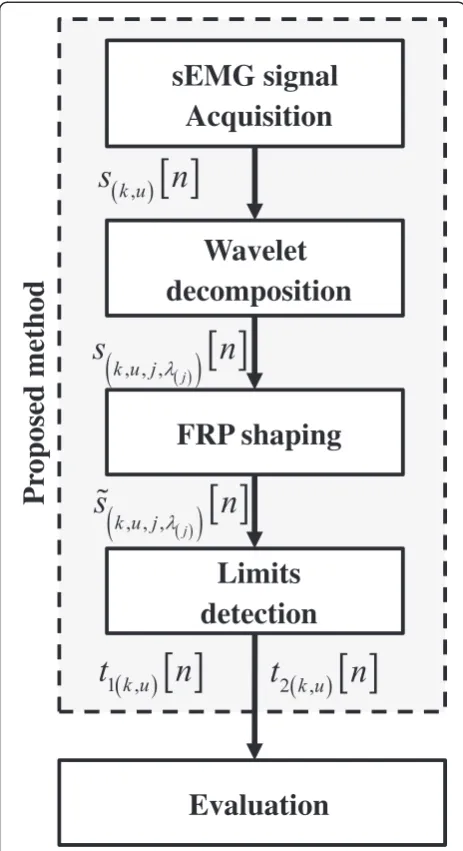
The general principle of the proposed limits detection method of the FRP is described in Figure 3. This dia-gram shows the following steps of the proposed process:
1. The first step called « sEMG signal acquisition » sampled at 1000 Hz and filtered the sEMG signal with a band-pass filter between 10 and 450 Hz in addition to dismissing the power supply harmonics of 60 and 100 Hz ones corresponding to the Certus kinematic sensor.
2. The second step consists in decomposing the filtered signal into signals using the DWT and the wavelet per packet transform (WPT) [16] described in Section“WT and wavelet per packet transform background”and applied on sEMG signal in Section
“WTs application to sEMG signal”. So, instead of relying solely on the filtered signal, we base our limits detection on several time domain sub-signals of the same signal at different frequency levels. In this way, the accuracy and repeatability of the search limits is improved.
-1.5 -1 -0.5 0 0.5 1
sEMG amplitude, s
(k,u)
[
n
]
(a)
-3 -2.5
-2 -1.5
-1 -0.5
0 0.5
1 1.5
0 2 4 6 8 10 12 14 16 18 20
Time (s)
sEMG amplitude, s
(k,u)
[
n
]
(b)
3. Before searching for limits, in the third step, each FRP sub-sEMG signal passes through a shaping algorithm presented in Section“Proposed shaping algorithm”. This algorithm has specifically been developed to determine the shape of the sEMG signal while eliminating residual forms mainly due to non-stationarity of the muscle activities.
4. The next step, depicted in Section“Limits detection of interval relaxation phase”, automatically determines the limits of main muscle activity on the left and right bound of relaxation phase with a simple threshold applied to each shape of each sub-signal from the sEMG signal. This way, we obtain as much estimated
limits as the number sub-signals and a decision is made about searched point time limits,t1andt2in Figure1.
5. We consider here one last step that evaluates the limits estimated based on movements captured by the body kinematic. The evaluation of obtained limits is not a trivial problem. Criteria of accuracy and repeatability have been defined and presented in Section“Proposed evaluation method”.
WT and wavelet per packet transform background Used in many applications, WT and wavelet per packet transform (WPT) are signal processing methods which provide a set of decomposed signals in independent fre-quency bands. It returns accurate time-frefre-quency infor-mation effective in case of non-stationary signals such as sEMG time series. Mathematically, the continuous wave-let transform (CWT) is defined as a convolution of a time series signal x(t) with a wavelet ψ(α,β)(t) of various
scalesαand translationsβ:
Wðα;βÞ¼ Z1
1
x tð Þψðα;βÞð Þt dt; ð1Þ
with
ψðα;βÞð Þ ¼t 1
ffiffiffi α
p ψ tαβ
: ð2Þ
Expression (1) represents the continuous wavelet ana-lysis equation. ψ(α,β)(t) is named « child wavelet » and is
obtained from a basic function referred to the « mother wavelet» ψ(t) as shown in (2). This basic wavelet can take several forms with different properties [16]. The time-frequency analysis resultW(α,β)is named the wavelet
coefficients (WCs) at scale α and time β. These coeffi-cients of the continuous wavelet decomposition accurately identify important time scale in a time series signal. How-ever, this method does not directly reconstruct the signal at specific timescales; for this reason, the process proposed in this article is based, not on WCs, but on their corre-sponding time series representation. The DWT produces these reconstructions from any WCs from discrete signal
x[n], forn= 1, 2,. . .,N. This is accomplished by determin-ing the WC in the same manner as described in (1) and (2), but with discrete dyadic version ofαandβ. The ana-lysis equation of DWT is written
Wð Þj;p ¼ XN
n¼0
x n½ ψð Þj;p ½np; ð3Þ
with
ψð Þj;p½ ¼n
1 ffiffiffiffi 2j
p ψ n
2j : ð4Þ
Compared to the CWT α= 2j and β= 2jp. j= 1, 2,. . .,J
are called the discrete levels of timescales andp= 0, 1,. . .,
sEMG signal
Acquisition
Wavelet
decomposition
FRP shaping
Limits
detection
Evaluation
Pr
oposed method
P are the discrete locations P jð Þ ¼
⌊
N2j2j⌋
where ⌊•⌋is the function of round down to the next integer. The DWT converts the real time series signalx[n] sampled at discrete time instantsninto a real two dimensional spaceW(j,p), ateach discrete leveljand discrete locationp.
Each of these WCs of the DWT can be thought of as « detail WCs » and can be used in the reconstruction of the time series signal at the specified level. It results the following synthesis equation named the « detail » time series signal of levelj:
dð Þj½ ¼n XP jð Þ
p¼0
Wð Þψj;p ð Þj;p½np ð5Þ
In order to complete the signal representation, it is necessary to add the low frequenciesQ(j,p)corresponding
to the scales larger than 2j. A scaling functionχ(j,p)[n] is
defined in (7) based on the basic function χ(t) called « father wavelet » and used to computed « approximation » coefficients (6).
Qð Þj;p ¼ XN
n¼0
x n½ χð Þj;p½np ð6Þ
with
χð Þj;p ½ ¼n
1 ffiffiffiffi 2j
p χ n
2j : ð7Þ
Similar to « detail » time series in (5), the « approxima-tion » time series signal of the jth level can be obtained with the synthesis equation (8).
að Þj½ ¼n XP jð Þ
p¼0
Qð Þφj;p ð Þj;p½np ð8Þ
As generalized by Mallat [16], the DWT can be seen as filters bank structure described in Figure 4. Each stage of the structure represents a wavelet leveljcomposed by two quadrature mirror filters h[n] and g[n]. h[n] is a low-pass filter and g[n] is a pass-band filter. These two filters are, respectively, obtained by inner product of the scaling function χ(t) and the wavelet function ψ(t) [16]. Considering the wavelet level j, a(j)[n] is computed by
passing the previous level approximation componentsa(j −1)[n] in the filter h[n] and d(j)[n] by passing the same
previous level approximation componentsa(j−1)[n] in the
filter g[n]. a(j)[n] is called low-frequency approximation
signal at the resolutionjandd(j)[n] high-frequency detail
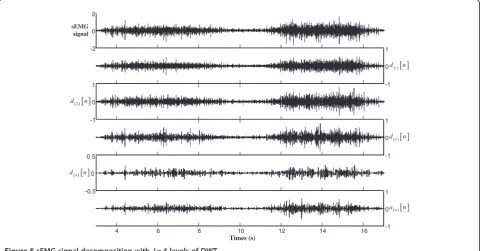
signal. Each level detail signal d(j)[n] of the wavelet
transformation corresponds to a representation of the signal at a given frequencies range [16]. Figure 5 gives an example of FRP sEMG signal decomposed with four
levels of DWT. It is interesting to observe that for all decomposed levels time pointt1andt2are preserved.
The WPT method is an expansion of the described DWT decomposition, which presents more possibilities for signal processing information extractions. In Figure 6, at each levelj, instead of only considering the decomposition of the (j–1)th approximation signala(j−1)[n], the (j–1)th
detail signal d(j−1)[n] is also decomposed. As depicted in
Figure 6, and contrary to the case of the DWT, the wavelet per packet transform can be seen as a complete tree struc-ture offering more resolutions and information about the input signal x[n]. To simplify the writing in Figure 6, syn-thesis signals of WPT are noted δ j;λ
j
ð Þ
ð Þ½ n whereλ(j)is the
index of sub-signal of the leveljwhereλ(j)= 1, 2,. . ., 2j. The
wavelet per packet transform returns 2jrepresentations of the input signal at each level. The DWT returns one detail signal at each leveljand one detail signal and one approxi-mation signal at the last levelJ. In this article, our goal is to take advantage of this large number of decompositions to determine the anglesϕ1andϕ2in Figure 1.
WTs application to sEMG signal
During the FRP experimentation, two sEMG signals of back muscle activities are recording: one sEMG signals from a sensor positioned to left of L5 and a second one from a sensor positioned to right of L5. We defines(k,u)L[n]
and s(k,u)R[n], thenth samples of the filtered sEMG signal
coming respectively from the sensor left (index•L) and the sensor right (index•R) at theuth trial of the subjectk. We notek= 1, 2,. . .,K,u= 1, 2,. . .,Uandn= 1, 2,. . .,N, withK
the number of tested subjects,Uthe number of repetition trials of the experimentation, andNthe number of samples of the sEMG signal sampled at the frequencyFS.
The proposed method globally depicted in Section“ Gen-eral processing process” is identically performed on both sEMG signals, s(k,u)L[n] and s(k,u)R[n]. Estimated t1 and t2
limits for these antagonist two FRP signals are used to evaluate all limits detection methods. In order to simplify the writing, the processing process is described for the FRP sEMG response of a given left-right sensor, noteds(k,u)[n].
Based on the explanation of the DWT and the WPT, the sEMG signals(k,u)[n] is decomposed throughJ
wave-let levels. Considering the WPT, we notes k;u;j;λ
j
ð Þ
ð Þ½ n the
λ(thj) time-series representation of the signal s(k,u)[n] at
level j; with λ(j)= 1, 2,. . ., 2j and j= 1, 2,. . .,J.
Consider-ing J levels of the WPT method, the total number of
obtained sub-signalsNSis defined byNS¼
PJ j¼0
2j.
Proposed shaping algorithm
By nature, sEMG signal is a sum of electrical potential generated by muscle cells [17]. As a result, this signal
and its decompositions are composed by random peaks of different amplitudes. Furthermore, some arti-facts can appear during the acquisition. For these
g[n]
h[n]
g[n]
h[n]
g[n]
h[n]
g[n]
h[n]
Levels
j=1
j=2
j=3
j=4
Figure 4Tree structure of DWT forJ= 4 levels.
-2 0 2
sEMG signal
-1 0 1
-1 0 1
-1 0 1
-0.5 0 0.5
4 6 8 10 12 14 16 -1
0 1
Times (s)
1
d n
3
d n
4
a n
4
d n
2
d n
reasons, the detection of muscles activities in a relax-ation phase, defined in time interval t1 and t2 (in Figure 1) could not perform well visually directly from
s(k,u)[n] or sðk;u;j;λð ÞjÞ½ n . It is necessary to develop an
accurate shaping method in order to make the relax-ation interval main muscular activities appear clearly. In order to efficiently realize this sEMG signal shap-ing, we proposed a method based on moving
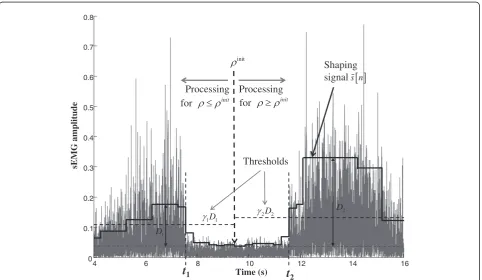
multi-size windows, which results are shown in Figure 7. Based on several moving windows of different sizes, the shaping method smooth the EMG signal by de-creasing the contribution of local artefacts while pre-serving the accuracy of the smoothing. The proposed shaping process is an iterative method done from an initial point of the relaxation, noted ρinit(see Figure 7). ρinit
is defined between the interval [t1t2], preferably
g[n]
h[n]
g[n]
h[n] h[n] g[n]
g[n]
h[n] h[n] g[n] h[n] g[n] h[n] g[n]
Levels
j=1
j=2
j=3
Figure 6Tree structure of WPT forJ= 3 levels.
t
1 Time (s)6 8 10 12 14 16
0.1 0.2 0.3 0.4 0.5 0.6 0.7 0.8
sEMG amplitude
4 0
init
Processing Processing
Shaping signal
for init for init
t
21D1
1
D
2
D
2D2
Thresholds
s n
around the middle of the relaxation phase. Our multi-windows method is performed identically and inde-pendently of both sides of this initial starting point: (i) for time points ρ greater than ρinit, ρ≥ρinit and (ii) for time points ρ less thanρinit, ρ≤ρinit. Consequently, to simplify our notation, we only describe the process realized forρ≥ρinit.
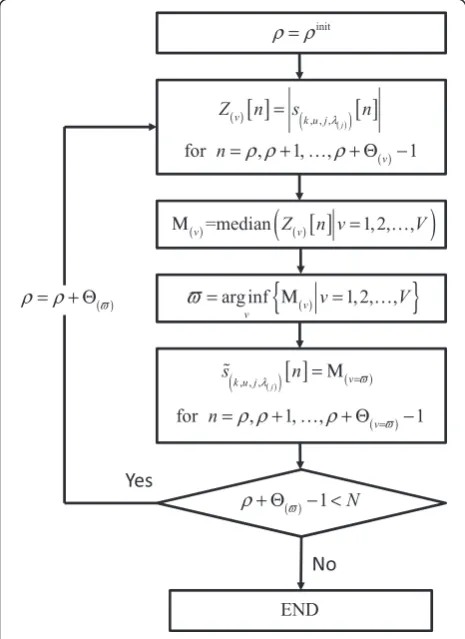
We considerρ the processing time point, equal toρinit at the first iteration, andVwindows of indexv= 1, 2,. . .,V
with different sizes Θ(v). For ρ≥ρinit as depicted in
Figure 8, allVwindows are applied to the absolute value of sEMG sub-signal,s k;u;j;λ
j
ð Þ
ð Þ½ n, and giveVdifferent sizes segmentsZ(v)of this sub-signal defined for allvas
Zð Þv½ ¼n sðk;u;j;λð ÞjÞ½ n
for n
¼ρ;ρþ1;. . .;ρþΘð Þv 1; ð9Þ
where |•| is the absolute value function. The median value of all these segments is computed as M(v)=median(Z(v)[n]| n=ρ,ρ+ 1,. . .,ρ+Θ(v)−1) andv= 1, 2,. . .,V. The selected
window referred as indexϖcorresponds to the lowest cal-culated median value,ϖ¼arg infv Μð Þvjv¼1;2;. . .;Vg
By choosing the window with the lowest median, we reduce
the effect of local artefacts and ensure that only the major signal events are taken into account. It is a robust and sim-ple method. The shaping signal of s k;u;j;λ
j
ð Þ
ð Þ½ n , noted ˜sk;u;j;λ
j
ð Þ
ð Þ½ n, simply takes the value of the selected median M(ϖ)along the selected window intervalΘ(ϖ):
˜
s k;u;j;λ
j
ð Þ
ð Þ½ ¼n Μðv¼ϖÞ for n
¼ρ;ρþ1;. . .;ρþΘðv¼ϖÞ1: ð10Þ
For the next iteration, the processing time point ρ becomes ρ=ρ+Θ(ϖ). And for ρ≥ρinit, the process
continues and repeats itself until the end of signal, ρ +Θ(ϖ)−1 =N(see Figure 8). As mentioned previously,
the same iterative method is performed on the other side time of ρinit for ρ<ρinit. Once the shaping process performed, all shaping sub-signals s˜k;u;j;λ
j
ð Þ
ð Þ½ n
of all subject k and for their all U trails will be used to determine limits t1 and t2, as explained in the next section.
Limits detection of interval relaxation phase
The use of shaping signals simplifies the automated detection of time point t1 and t2. For each shaping signal s˜k;u;j;λ
j
ð Þ
ð Þ½ n the time point detection process is similar for both side time of ρinit. For n<ρinit and n≥
ρinit
, the method is, respectively, looking for the time point t1 and for the time point t2. As illustrated in Figure 7, for both sides indexed 1 and 2 like for t1
and t2, distances between maximum and minimum amplitude values first are computed as follows
D1k;u;j;λ j
ð Þ
ð Þ ¼max s˜k;u;j;λ
j
ð Þ
ð Þ½ nn¼ρinit1;ρinit2;. . .;1
min s˜k;u;j;λ
j
ð Þ
ð Þ½ nn¼ρinit1;ρinit2;. . .;1
ð11Þ
D2k;u;j;λ j
ð Þ
ð Þ ¼max s˜k;u;j;λ
j
ð Þ
ð Þ½ nn¼ρinit;ρinitþ1;. . .;N
min s˜k;u;j;λ
j
ð Þ
ð Þ½ nn¼ρinit;ρinitþ1;. . .;N
ð12Þ
Both side empirical threshold values, γ1 and γ2 (0
<γ≤1) are imposed to maximum amplitude distances computed in (11) and (12). The time points t1 and t2
correspond to the position at which sub-signals ampli-tudes are equivalent to the percentage of distances γ1D1ðk;u;j;λð ÞjÞ and γ2D2ðk;u;j;λð ÞjÞ, as depicted in Figure 7. Therefore, time points t1 and t2 of the λ(thj) sEMG
signal decomposition for the trial u of the subject k, notedt1 k;u;j;λ
j
ð Þ
ð Þ and t2 k;u;j;λ
j
ð Þ
ð Þ, are expressed as follow: In (13) and (14),Δt= 1/FSis employed in order to con-vert limits in time. At this point of the process, based on
NS results of limits time pointt1and t2, we can make a decision to determinate time point interval of relaxation phase. We propose to apply two decision functions, one to compute the time point t1ðk;uÞ by simply applying mean function,mean(•):
t1ðk;uÞ¼mean t1k;u;j;λ j
ð Þ
ð Þj¼1;2;. . .;J and λð Þj ¼1;2;. . .;2j ;
ð15Þ
and a second to compute ˜t1ðk;uÞ by applying the median
functionmedian(•):
t˜1ðk;uÞ¼median t1k;u;j;λ j
ð Þ
ð Þj¼1;2;. . .;J and λð Þj ¼1;2;. . .;2j
ð16Þ
Proposed evaluation method
As mentioned in Section“WTs application to sEMG sig-nal”, we consider two sEMG sensors: one on the left side of L5 and another one on the right side of L5. Therefore, after the wavelet decomposition, the FRP shaping and the limits time point detection (see Figure 3), we determine limits time points t1(k,u)L(t1(k,u)R) and t2(k,u)L(t2(k,u)R) and
for each trial u of each subject k for left (right) sEMG sensors.
In order to estimate limits time pointst1andt2, we re-port those estimations on kinematic signal,c(k,u)[n], which
returns position angle in degree of the subject k during hisuth trial. As shown in Figure 1, reporting limits time pointst1andt2onc(k,u)[n], anglesϕ1andϕ2are obtained,
respectively. In the same manner, for each sEMG signal limits and based on limits time pointt1(k,u)L(t1(k,u)R) and t2(k,u)L(t2(k,u)R) we determinate anglesϕL1(k,u)(ϕ1(Rk,u)) and
ϕ2(Lk,u)(ϕ2(Rk,u)) for the left (right) sensor.
We are interested in the kinematics angles because the two physiological properties between muscles ac-tivities relaxation time point limits and kinematics angles permit us to determine two assessment criteria as follows:
i. For each subjectk, estimated kinematic angles must be similar between left and right sEMG sensors during the same trialu. The error between the angles of left and right sensors of the same trialumust tend to zero and permit to evaluate the accuracy criterion:
ϕL
1ðk;uÞϕR1ðk;uÞ→0; andϕL2ðk;uÞϕR2ðk;uÞ→0 ð17Þ
It is known that for a subjectkduring the flexion– re-laxation task, the end of the flexion must occur at the same kinematic angle according to all U trials. The be-ginning of the extension must also appear at the same kinematic angle according to all trials. The standard de-viation function, std(•), of each angle ϕ1(k,u)L, ϕ1(k,u)R,
ϕ2(k,u)L,and ϕ2(k,u)Rin function of trials must tend to 0,
with u= 1, 2,. . .,U, allows us to evaluate the repeatability criterion:
stdðϕL1ðk;uÞju¼1;2;. . .;UÞ→0;
stdðϕR1ðk;uÞju¼1;2;. . .;UÞ→0;
stdðϕL2ðk;uÞju¼1;2;. . .;UÞ→0; and
stdðϕR2ðk;uÞju¼1;2;. . .;UÞ→0:
ð18Þ
Experimental results and analysis Compared methods and parameters
Twenty-five participants, K= 25, with chronic LBP volunteered for the study: 14 men, 11 women with mean age of 28.3 years and standard deviation of ±8.9. All par-ticipants gave their written informed consent according to the research protocol approved by the local ethics committee. As previously depicted in Section “ Experi-mental system and sEMG signal”, each subject com-pleted five successive flexion and extension movements resulting (U= 5): five kinematics angles signals, five sEMG signals for the sensor localized to the left of L5 and five signals for the sEMG sensor to the right of L5.
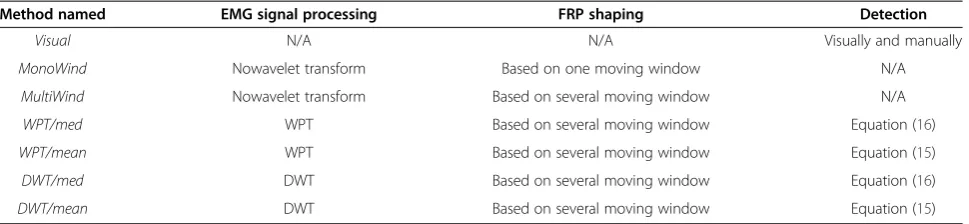
In order to evaluate the interval limits of the relax-ation phase, six different methods are compared based on the exact same sEMG experimental signals. Table 1 lists the main definitions of each studied method apply-ing to left and right sEMG signals to find t1 and t2.
t2 k;u;j;λ
j
ð Þ
ð Þ ¼ argsup
n ˜
s k;u;j;λ
j
ð Þ
ð Þ½ n≤γ2D2 k;u;j;λ
j
ð Þ
ð Þn¼ρinit;ρinitþ1;. . .;NΔt: n
ð14Þ
t1 k;u;j;λ
j
ð Þ
ð Þ ¼ argsupn ˜sðk;u;j;λð ÞjÞ½ n≤γ1D1ðk;u;j;λð ÞjÞn¼ρ
init1;ρinit2;. . .;1
Δt; n
Because it is the method currently used to analyze sEMG signal of FRP, the conventional method to deter-mine the interval limit is based on the visual and manual techniques. This conventional method is compared to the proposed automated methods. Two experienced assessors performed the conventional method of FRP sEMG limits (t1 and t2). These two visual methods are referred as methods «visual1» and «visual2» in results. In order to observe the performances of different sizes of moving windows in the shaping method without WT, the methodMonoWindis applied directly on the filtered sEMG signal based on the same process presented in Section “Proposed shaping algorithm” and Figure 8, but with only one moving window of sizeΘ(1)= 0.6swithV
= 1. The shaping method with V sizes of moving win-dows (Figure 8) is directly applied on the filtered sEMG signal (without WT) withΘ(1)= 0.6 s,Θ(2)= 0.8 s,Θ(3)=
1.6 s, andΘ(4)= 2 s (V= 4), and is referred asMultiWind
method. Four different methods based on shaping with multi-moving windows and wavelet signal decompos-ition are also compared. The methods WPT/mean and
WPT/meddecompose the filtered sEMG signal with the
wavelet per packet transform and, respectively, use a
meandecision equation (15) and amedianone Equation (16) to determine the two limits. Both based on DWT,
DWT/mean and DWT/med, methods also estimate, re-spectively, limits with mean and median operations.
All parameters depicted in Table 2 have been chosen from parameters studies according to accuracy and re-peatability criteria. Four levels of decomposition (J= 4, Table 2) represent the best compromise between obtained performances of criteria and processing time. Compared to other simulated wavelet family, the mother wavelet « Haar » shows good estimation of FRP limits. It resultsNS= 4 decomposed signals in methods employing DWT and NS= 30 sub-signals in WPT based methods. Following the same parameter selection, thresholds for limits detection (Section“Limits detection of interval re-laxation phase”) equal toγ1=γ2= 0.2 have been chosen
Statistical analyses
Accuracy and repeatability criteria for the limit t1 were analyzed using one-way repeated measures ANOVAs to determine the effect of time limit detection methods. Planned contrasts were used to test fora priori hypoth-eses. The MultiWind method was compared to both wavelet-type methods (based on WPT and DWT) in order to determine the additional contribution of wavelet-type methods to the detection. Planned con-trasts were also used to compare the visual detection methods to the WPT wavelet-type methods. Finally, planned contrasts were used to assess the difference between the MonoWind and the MultiWind methods. Statistically significant results obtained for accuracy and repeatability criteria of t1are specified in Figures 9a and 10a.
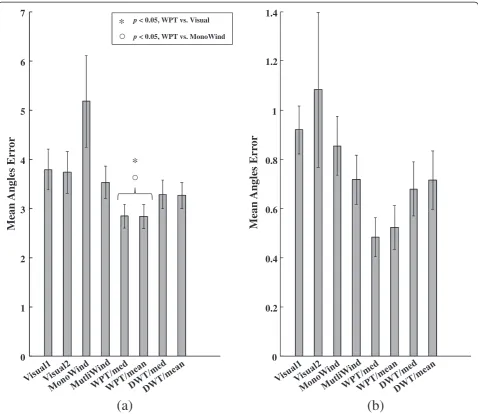
Accuracy and repeatability results
Figure 9 shows the ability of methods to find close boundaries between the left and right sensors fort1and
t2. This figure presents the means of accuracy criterion compared to all subjects and corresponding standard errors obtained for all methods. As explained in Section
“Proposed evaluation method” with the criterion of
Table 2 Parameters used for WT, shaping methods and limits detection
Values
Wavelets parameters
Number of levels (J) 4
Number of DWT sub-signals (NS)
4
Number of WPT sub-signals (NS)
30
Wavelet type Haar
Shaping parameters
Number of multi-windows (V) 4
Sizes of multi-windows method (Θ(v))
Θ(1)= 0.6 s,Θ(2)= 0.8 s,Θ(3)= 1.6 s, and Θ(4)= 2 s
Size of one-window method Θ(1)= 0.6 s
Determinations parameters
Threshold values γ1= 0.2 andγ2= 0.2
Table 1 Detection methods studied and their main properties
Method named EMG signal processing FRP shaping Detection
Visual N/A N/A Visually and manually
MonoWind Nowavelet transform Based on one moving window N/A
MultiWind Nowavelet transform Based on several moving window N/A
WPT/med WPT Based on several moving window Equation (16)
WPT/mean WPT Based on several moving window Equation (15)
DWT/med DWT Based on several moving window Equation (16)
accuracy (17), the mean angles error of right and left sensors for all trials and subjects must tend to 0.
First considering statistically significant differences fort1
in Figure 9a, methods based on WPT show an accuracy criterion significantly smaller than visual results (Visual1
and Visual2) and MonoWind method. It represents an interesting result for methods using WPT because no other method presents a significant difference with visual and MonoWind Methods. The use of WPT with the multi-windows shaping algorithm (methods WPT/med
and WPT/mean) improves results compared to (i) using just the multi-windows shaping algorithm (method Multi-Wind) and (ii) using DWT with the multi-windows shap-ing algorithm (methodsDWT/medandDWT/mean).
Based on average results, we also can make the follow-ing remarks:
i. Both visual methods (Visual1andVisual2) yielded equivalent mean error of approximately four degrees;
ii. UnlikeMultiWindmethod and all others, the
MonoWindapproach seemed less efficient for
finding close limits between the right and left sensors. This technique shows the worse mean of the accuracy criterion and the highest variability. These bad results are mainly due to the presence of stronger local pulses and artifacts during the relaxation phase in case of LBP subjects. The
0 1 2 3 4 5 6 7
Mean Angles
Err
or
0 0.2 0.4 0.6 0.8 1 1.2 1.4
Mean Angles
Err
or
(a)
(b)
*
*
p< 0.05, WPT vs. Visual p< 0.05, WPT vs. MonoWindshaping algorithm based on several moving windows is clearly more efficient for this kind of signals; iii. Even if there is no significant difference between
those methods we observe that: (i) DWT-based methods offer better results thanMultiWindand (ii) the mean error is the smallest for method based on WPT decomposition of sEMG signal;
iv. In this case, no obvious difference appears between making a decision based on mean (15) or based on median (16).
Due to the nature of the flexion–extension task, look-ing fort2(Figure 9b) is a smaller challenge than looking for t1. The extension phase uses more muscle activities
and determining this limit from sEMG signal is easier. This fact explains the smaller mean angles errors obtained to find t2compared to t1 for all methods. For this reason, no statistical analysis has been performed for the limitt2. Even if all methods return good right/left detection of t2, methods based on WPT presents the best average results (the smallest errors).
Figure 11 compares limits of all methods obtained with visual methods. If Figure 9 gives a good idea of the methods’ accuracy when they determinate limits from right and left sensors, this does not mean that limits are well localized. The goal of Figure 11 consists to inform us if estimated limits of methods are well localized. Our best limits localizations references are limits obtained by
0 1 2 3 4 5
6 7 8
Standard Deviation
0 1 2 3 4 5 6 7 8
Standard Deviation
Left sensor Right sensor Left sensor
Right sensor
(a)
(b)
* *
p< 0.001, WPT vs. Visual p< 0.001, WPT vs. MonoWindp< 0.001, WPT vs. MultiWind
p< 0.05, MultiWind vs. MonoWind
* *
visual methods. Indeed, based on the confidence of experienced assessors, their results differ, but their limits localization definitively cannot be out of range. For each trial, subject, limit, and method, an error between visual estimates and all others methods has been computed and average results compared to subjects and trials are presented in Figure 11. Mean errors versusVisual2 and for limitst1andt2are exposed in this figure. Interesting remarks are given follow:
i. First considering both visual methods (see paler gray color bar in each plot), the mean differences between the two visual methods are 4.7 degrees fort1
Figure11aand 5.4 degrees fort2Figure11b. Based
on the confidence of experienced assessors, we consider those results as errors references to analyze the others method. Smaller errors obtained with others methods will give a strong idea of their good limits localization;
ii. Compared toVisual2fort1andt2and except for
MonoWind, automated methods present smaller
differences withVisual2thanVisual2versusVisual1.
The angles differences of automated methods compared to visual methods are smaller than the differences between the two visual methods. This fact allows us to (i) be confident on automated methods limits localization and (ii) note the difference between visual estimations made by two different persons.
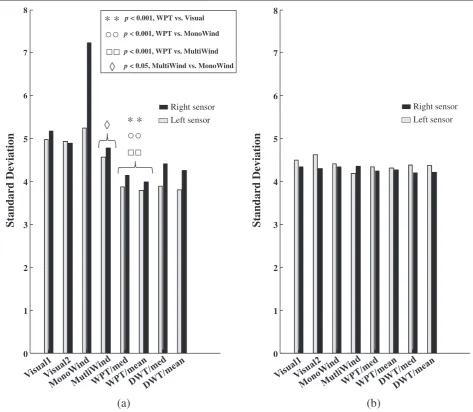
Based on the repeatability criterion defined in Section
“Proposed evaluation method” by the expression (18), Figure 10 expresses the repeatability (in term of standard deviation) of limits estimation for t1and t2in function of all repetitive trials of a subject. Means of obtained standard deviations for all subjects is shown in Figure 10 for right and left sensors and for t1 and t2. As depicted by (18), results must tend to 0. According to significant differences indicated in Figure 10a for limits t1, we can make the following observations:
i. MethodsWPT/medandWPT/meanshow a clear significant difference in term of repeatability compared to visual methods,MultiWindand
MonoWind. The use of wavelet per packet transform
clearly improves the repeatability criterion in the case of LBP subjects;
ii. The multi-windows shaping algorithm employed in
MultiWindprovides a significant result of
repeatability compared to the methodMonoWind, which used a mono-window shaping technique;
iii.MultiWindpresents no significant difference with
visual methods and with methods based on DWT considering the repeatability.
Based on average standard deviation, we can also note that
i. MonoWindhas the strongest difference results
between trials limits estimation, especially in the
0 1 2 3 4 5 6
Mean Angles
Err
or
0 1 2 3 4 5 6
Mean Angles
Err
or
(a)
(b)
case of right sensor. As explained in Figure9, this shaping method is too sensitive to random artifacts present in sEMG signal;
ii. Both visual methods (Visual1andVisual2) have equivalent mean standard deviations in function of experimental trials repetitions of approximately 5 degree;
iii. Once again, no meaningful difference is observed between taking a decision based on mean (15) or based on median (16).
In case of limitst2(Figure 10b), all methods yield simi-lar mean standard deviation in function of experimental trials repetitions. As already justified, it is easier to find this limit and all methods have a similar behavior.
Our analyses illustrate the difficulty to determinet1 com-pared tot2in case of LBP subjects. In order to observe the distribution of obtained results in terms of accuracy and repeatability for t1, Figure 12 depicts box plot for each method with the smallest observation, the lower quartile, the median, upper observation, the largest observation and outliers. In the case of repeatability results (Figure 12b), we consider the mean between left and right sensors. Indeed, for all methods, a statistically study reveals no significant difference between left and right sensors. Significant differ-ences presented in Figures 9a and 10a are based on data distributions exposed in Figure 12 for all methods.
The evaluation of accuracy and repeatability criteria demonstrates the interest of using wavelet decompos-ition to determine limits of the relaxation phase for LBP subjects. However, WPT methods which make their limits choices from 30 sub-signals show better performances than DWT based on 4 sub-signals. Methods with WPT yields to statically significant improvement compared to visual limits determination for both criteria. In addition, the proposed multi-windows shaping algorithm presents good abilities to smooth signals with strong local artifacts and impulses, as it is the case in sEMG response of LBP patients.
Computation times
It is also essential to mention the processing time to complete the detection of limits with all methods. In total, considering numbers of subjects, trials per subject, right and left sensors and 2 limits per signal to estimate, 500 limits were determined. It took in total 3 h for each experienced assessors and 8 min for all automated meth-ods to estimate limits.
More precisely, we observe how many times each method takes to detect limits of all trials of one LBP subject. Methods MonoWind, MultiWind, respectively, realized the limits detection of one subject in 0.1 and 0.29 s. Wavelet-based methods need 20.8 s. Those meth-ods are computed simultaneously with a Matlab wavelet
0 5 10 15 20
Mean Angles
Err
o
r
2 4 6 8 10 12 14
Standard Deviation
(a)
(b)
function. It would be easy to reduce computing times of wavelet methods by optimizing it and compiling it in C language. Finally, the average processing time to visually determine limits of all trails of one subject is 7.2 min. We can clearly conclude that proposed methods offer a significant gain of time.
Conclusion
sEMG parameters based on timing characteristics within the sEMG signal and in relation to other biomechanical signals such as movement are often used in kinesiology and health-related research. From an experimental and technical standpoint, visual identification of discrete events embedded within sEMG signals is time consum-ing. Moreover, standardization between assessors and subjects has proven to be challenging and its evaluation is often neglected. On the other hand, several automated methods have been suggested to define the onset and offset of muscle activity. Among the proposed approaches, onset and offset detection based on calculation of the standard deviation range of the sEMG baseline before a certain activity is commonly used. However, the standard deviation-based approaches have several limitations. In addition, searching for limits of the relaxation phase of sEMG FRP response in case of LBP patients is a real challenge. For this kind of subjects, it is difficult to separ-ate visually and automatically the three phases of FRP. WTs are employed here to improve the determination of FRP phases, by taking advantage of the time-domain sub-signals obtained with WT from the sEMG signal. The proposed method of limits detection based on wavelet per packet transform outperforms all others automated methods. Compared to visual identification, in addition to demonstrating an obvious saving of time, the use of WPT clearly improves the accuracy and repeatability in identifying onset and offset of the flexion relaxation response for LBP subjects. An optimization method is currently developed to deter-mine automatically best parameters of the proposed method. Other future works should focus on the development and evaluation of FRP onset and offset detection in various sub-populations of LBP patients. Such tools should be integrated in kinesiology and health-related research and will eventually improve patients’evaluation in various clinical spheres.
Competing interests
The authors declare that they have no competing interests.
Acknowledgment
The authors thank Marie-Pierre Harvey (physical activity master degree student and DC), Emmanuelle Dion (chiropractic student) and Jean Daniel Dubois (psychology PhD student) for their contributions in data acquisition and statistical analyses. The authors wish to thank the Natural Sciences and Engineering Research Council of Canada and ReSMiQ for their financial support.
Author details
1
Laboratory of Signals and Systems Integration (LSSI), Electrical and Computer Engineering Department, Université du Québec à Trois-Rivières, Trois-Rivières, QC G9A 5H7, Canada.2Chiropractic Department, Université du Québec à Trois-Rivières, Trois-Rivières, QC G9A 5H7, Canada.
Received: 2 November 2011 Accepted: 18 June 2012 Published: 19 July 2012
References
1. S Dagenais, J Caro, S Haldeman, A systematic review of low back pain cost of illness studies in the United States and internationally. Spine J8, 8–20 (2008)
2. S Dagenais, AC Tricco, S Haldeman, Synthesis of recommendations for the assessment and management of low back pain from recent clinical practice guidelines. Spine J10, 514–529 (2010)
3. PW Hodges, Changes in motor planning of feedforward postural responses of the trunk muscles in low back pain. Exp Brain Res141, 261–266 (2001) 4. PW Hodges, CA Richardson, Inefficient muscular stabilization of the lumbar
spine associated with low back pain. A motor control evaluation of transversus abdominis. Spine21, 2640–2650 (1996)
5. C Lariviere, AB Arsenault, D Gravel, D Gagnon, P Loisel, Evaluation of measurement strategies to increase the reliability of EMG indices to assess back muscle fatigue and recovery. J Electromyogr Kinesiol12, 91–102 (2002) 6. MA Esola, PW McClure, GK Fitzgerald, S Siegler, Analysis of lumbar spine and hip motion during forward bending in subjects with and without a history of low back pain. Spine (Phila Pa 1976)21, 71–78 (1996)
7. CJ Colloca, RN Hinrichs, The biomechanical and clinical significance of the lumbar erector spinae flexion-relaxation phenomenon: a review of literature. J Manipulative Physiol Ther28, 623–631 (2005)
8. S Holm, A Indahl, M Solomonow, Sensorimotor control of the spine. J Electromyogr Kinesiol12, 219–234 (2002)
9. A. Gupta, Analyses of myo-electrical silence of erectors spinae. J Biomech 34, 491–496 (2001)
10. JP Callaghan, NM Dunk, Examination of the flexion relaxation phenomenon in erector spinae muscles during short duration slumped sitting. Clin Biomech (Bristol, Avon)17, 353–360 (2002)
11. MA Sarti, JF Lison, M Monfort, MA Fuster, Response of the flexion-relaxation phenomenon relative to the lumbar motion to load and speed. Spine26, 421–426 (2001)
12. MW Olson, L Li, M Solomonow, Flexion-relaxation response to cyclic lumbar flexion. Clin Biomech (Bristol, Avon)19, 769–776 (2004)
13. M Descarreaux, D Lafond, R Jeffrey-Gauthier, H Centomo, V Cantin, Changes in the flexion relaxation response induced by lumbar muscle fatigue. BMC Musculoskelet Disord9, 1–9 (2008)
14. M Descarreaux, D Lafond, V Cantin, Changes in the flexion-relaxation response induced by hip extensor and erector spinae muscle fatigue. BMC Musculoskelet Disord11, 1–7 (2010)
15. JP Lund, R Donga, CG Widmer, CS Stohler, The pain-adaptation model: a discussion of the relationship between chronic musculoskeletal pain and motor activity. Can J Physiol Pharmacol69, 683–694 (1991)
16. S Mallat,A Wavelet Tour of Signal Processing(Academic Press, San Diego, CA, 1998)
17. Y Tingting, L Quan, A Qingsong, Study on best wavelet packet based on independent threshold de-noising for MUAP, in2010 Second World Congress on Software Engineering (WCSE),Wuhan China., vol. 1 (, 2010), pp. 269–272 18. S Kumar, N Prasad, Torso muscle EMG profile differences between patients
of back pain and control. J. Clin. Biomech.25(2), 103–109 (2010) 19. MH Pope, A Aleksiev, ND Panagiotacopulos, JS Lee, DG Wilder, K Friesen, W
Stielau, VK Goel, Evaluation of low back muscle surface EMG signals using wavelets. J. Clin. Biomech.15(8), 567–573 (2000)
20. MI Ibrahimy, OO Khalifa, Hand motion detection from EMG signals by using ANN based classifier for Human Computer Interaction, in2011 4th International Conference on Modeling, Simulation and Applied Optimization (ICMSAO), Lumpur, Malaysia(, 2011), pp. 1–6
22. SC Landry, BM Nigg, KE Tecante, Standing in unstable shoe increase postural sway and muscle activity of selected smaller extrinsic foot muscles. Gait Posture32(2), 215–219 (2010)
23. MBI Reaz, MS Hussain, F Mohd-Yasin, EMG analysis using wavelet functions to determine muscle contraction, in8th International Conference on e-Health Networking, Applications and Services HEALTHCOM 2006(, 2006), pp. 132–134
24. HS Roy, D Casavant, M Emley, LD Gilmore, CJ De Luca, EMG analysis using wavelet functions to determine muscle contraction, in. Proceedings of the Annual International Conference of the IEEE Engineering in Medicine and Biology Society, vol. 4 (, 1988), pp. 1732–1733
25. P Coorevits, L Danneels, D Cambier, H Ramon, H Druyts, JS Karlsson, G De Moor, G Vanderstraeten, Correlations between short-time Fourier- and continuous wavelet transforms in the analysis of localized back and hip muscle fatigue during isometric contractions. J Electromyogr Kinesiol18(4), 637–644 (2008)
26. S Legendre, D Massicotte, J Goyette, T Bose, Wavelet-transform-based method of analysis for lamb-wave ultrasonic NDE signals, in. IEEE Trans. on Instrumentation and Measurement, vol. 49(3), 2000, pp. 524–530 27. A Naït-Ali,Advanced Biosignal Processing(Springer, Berlin, 2009) 28. R Chiodi, D Massicotte, Voice activity detection based on wavelet packet
transform in nonlinear space communication channel, inInt. Conf. on Advances in Satellite and Space Communications (SPACOMM), Colmar, France
(2009), pp. 54–57
doi:10.1186/1687-6180-2012-151
Cite this article as:Nougarouet al.:Detection method of flexion relaxation phenomenon based on wavelets for patients with low back pain.EURASIP Journal on Advances in Signal Processing20122012:151.
Submit your manuscript to a
journal and benefi t from:
7 Convenient online submission
7 Rigorous peer review
7 Immediate publication on acceptance
7 Open access: articles freely available online
7 High visibility within the fi eld
7 Retaining the copyright to your article