Patterns of physical activity and the effect of accelerometer wear on physical
activity participation in people with Type 2 diabetes
MacMillan, F., Kirk, A. (Department of Sport, Culture and the Arts/Creative and Aesthetic Studies, University of Strathclyde)
Abstract
Data were taken from a trial comparing three physical activity interventions, in 134 people with T2D (age=61.3±10.3yrs; BMI=33.32±6.9kg/m2). The interventions were a one-to-one
consultation, a written-delivered pack and a leaflet. Physical activity was measured over seven days, using the GT1M accelerometer, pre-intervention and 6 and 12 months post-intervention. Weekly and daily total accelerometer and step counts were recorded then analysed using analysis of variance. Significance was set at p < 0.05. At baseline men had greater accelerometer counts than women. Accelerometer and step counts were greater in participants <61yrs and in employment. Greatest counts were on day 1 of accelerometer wear, lowest counts on day 7 at baseline and 6 months, and day 5 at 12 months. At baseline an interaction of gender and day of wear for step count and at 12 months for step and accelerometer count was found. Women, those >61yrs and retired individuals are the most inactive subgroups of people with T2D and are priority for intervention. The ‘wear effect,’ from measurement of physical activity with an accelerometer, should be considered when evaluating the effectiveness of interventions, with possible removal of the first day of data.
Keywords
Physical activity, accelerometer, Type 2 diabetes, physical activity patterns.
Abbreviations
BMI = Body Mass Index
T2D = Type 2 diabetes
Type 2 diabetes (T2D) is characterised by hyperglycaemia caused by defects in insulin secretion and/or insulin action. Regular physical activity in people with T2D can improve glycaemic control, cardiovascular risk factorsandquality of life (Kirk et al, 2004). Despite these possible benefits, the majority of people with T2D do not participate in regular physical activity (Hays and Clark, 1999).As has been shown in people issued with an exercise leaflet used in diabetes management (Kirk et al, 2004), current interventions used in care are often not enough to increase physical activity. A successful intervention method to increase and maintain physical activity participation is required.
Effectiveness of physical activity interventions has been studied in people with T2D using objective and/or subjective methods to measure change in physical activity (Kirk et al, 2004; Kirk et al, 2009). Although objective methods (e.g. accelerometers and pedometers) may have less variability in reporting than subjective methods (e.g. physical activity recall questionnaires), there are issues with objective measurement, such as data interpretation (Corder, Brage and Ekelund, 2007). Accurate objective measurement of physical activity is critical to determine the true effect of an intervention. The Actigraph is the most accurate commercially available monitor for physical activity measurement and has been extensively validated (Plasqui and Westerterp, 2007).
When deciding on a method to measure physical activity there are several issues to consider including the reliability and validity of the method, preferably in the population of interest, and the number of days of measurement required to accurately estimate habitual physical activity. Another consideration is the ‘wear effect’ the method may have on physical activity. This change from the norm is known as the Hawthorne effect; a temporary change in the participant’s behaviour due to observation of the participant (Wickstrom and Bendix, 2000).
It is important to determine the effect of accelerometer wear on the amount of physical activity performed to make valid conclusions on the effectiveness of physical activity
Methods
Participants and Procedures
Data were taken from a randomised controlled trial comparing the effectiveness of three physical activity interventions for people with T2D (Kirk et al 2009). One hundred and thirty four people provided informed consent and participated in the study (65 males and 69
females). Mean participant age was 61.3±10.3yrs and mean participant BMI was 33.32±6.9kg/m2 (±SD). Of participants 47.8% were retired.
Inclusion criteria were: Type 2 diabetes mellitus that met recognised criteria (The Expert Committee on the Diagnosis and Classification of Diabetes Mellitus, 2003) and doing no or little physical activity but interested in doing more, determined using a validated
questionnaire (Marcus et al, 1992). Recruitment methods included advertisements in newspapers and a hospital diabetes centre, through general practitioner referrals, diabetes talks, university newsletters and a diabetes exercise class. Subjects were medically stable for exercise participation.
Data collection was from March 2006 to March 2008. The Tayside Committee on
Medical Research Ethics reviewed and approved the study. In the main trial participants were randomised on an individual basis using consecutively numbered sealed envelopes to three groups and given a one-to-one physical activity consultation delivered by a research assistant (n=47), a written-delivered physical activity pack covering the same material as the
consultation (n=52), or a standard exercise leaflet (n=35). The intervention aim was to increase physical activity participation to meet guidelines for health benefits; to accumulate 30 minutes of moderate intensity physical activity most days of the week (Pate et al, 1995). Details and descriptions of the one-to-one consultation and written-delivered pack content have been previously published and for an in-depth description of the study methodology refer to Kirk et al, 2009.Participant demographics were recorded at baseline. Physical
Outcome measures
Physical activity was objectively measured using the Actigraph GT1M accelerometer (Actigraph LLC, Pensacola FL). The Actigraph measures step counts and body acceleration per minute (Freedson and Melanson, 1998), with a total daily step count and accelerometer count calculated. The Actigraph detects acceleration in the vertical plane and measures the number and speed of accelerations to determine the accelerometer count. Accelerometers were worn around the waist on the right hand side for 7 days before the intervention and at 6 and 12 months follow up, except while bathing and sleeping. Participants kept a 7 day diary of sleep and awake hours to aid accelerometer data cleaning.
Data treatment and statistical analysis
Accelerometer data cleaning was based on guidelines for handling missing data (Ward et al, 2005). Accelerometer wear-time compliance and cleaning was conducted for each participant by comparing times worn on the accelerometer with the diary of sleeping and waking hours. When 2-6 hours of awake data were missing, an average from waking hours of that week was used for the missing activity counts. If >6 hours of data was missing or if there were <10 hours of wear, an average activity count for the rest of the week was calculated and used as the whole day count. When >3 days of data were missing data were discarded from analysis.
Data were analyzed using SPSS for Windows 14.0. Analysis of variance determined if there were differences in mean weekly accelerometer or step counts by gender, age, BMI, socioeconomic status, employment status and intervention group at baseline. Age was categorised as > or ≤ the mean group age of 61yrs. BMI was categorised as ≥ or <30 kg/m2
(≥30 kg/m2 is classed as obese). Participants were in a one-to-one consultation,
Repeated measures analysis of variance was used to determine if there were differences in accelerometer and step count by day of wear. Further subgroup analysis was conducted with gender, age, BMI, intervention group, socioeconomic status and employment status using the categories listed above. When overall effects were identified pairwise comparisons with Bonferroni adjustments were used to reveal where the differences were. Significance was set at p<0.05. The shape of data in each group was assessed using a Mauchly Sphericity test. When sphericity was not similar across groups (p<0.05) a Greenhouse Geisser modification was used to adjust the data, making groups more comparable.
Results
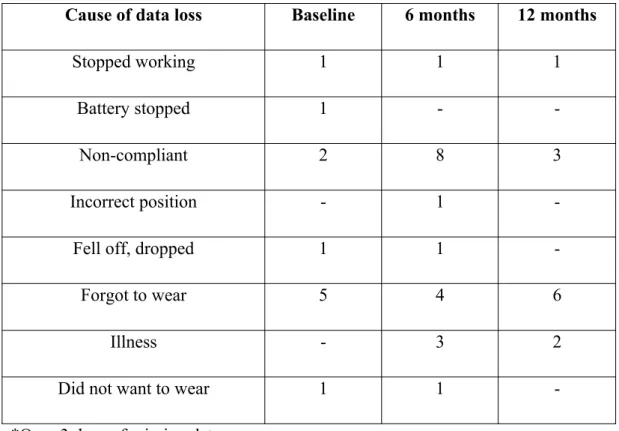
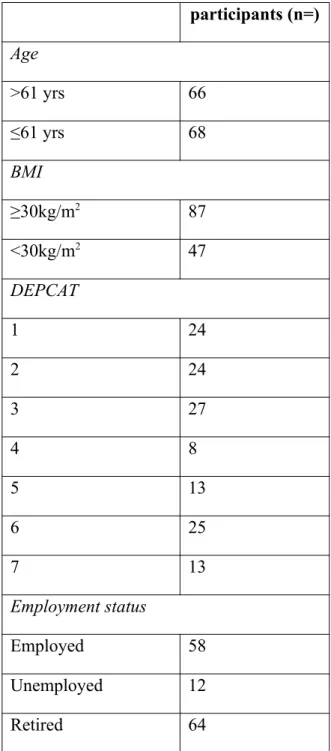
Table 1 details the reason for loss of accelerometer data at baseline, 6 and 12 months. Complete accelerometer and step count data were provided from 123 participants and 121 participants at baseline, 103 and 102 participants at 6 months and 104 and 104 at 12 months. Table 2 shows participant number in each category.
Patterns of physical activity
There was an overall effect of gender on accelerometer count, F(1,121)=6.30, p=0.013, but not on step count, F(1,119)=2.27, p=0.134. In men accelerometer count (219696±10959.087) was greater than women (180636.6±11048.551) (mean±SD).
An overall effect of age group on accelerometer, F(1,121)=11.18, p=0.001, and step count, F(1,119)=6.61, p=0.011, was found. Mean accelerometer count in those >61 years was less (174585.7±10842.679) than those ≤61 years (225649.3±10754.883). Step count was also less in participants >61 years (5326.7±297.923) than in those ≤61 years of age
(6396.8±290.626).
There was an overall effect of employment status on accelerometer, F(2,120)=6.03, p=0.003, and step count, F(2,118)=5.48, p=0.005. Accelerometer count was greater in those that were employed (229322.6±11529.683) than in those that were retired
compared to retired people (5285.040±299.156). No overall effects were found for socioeconomic status, BMI classification or intervention group.
Effect of accelerometer wear on physical activity level
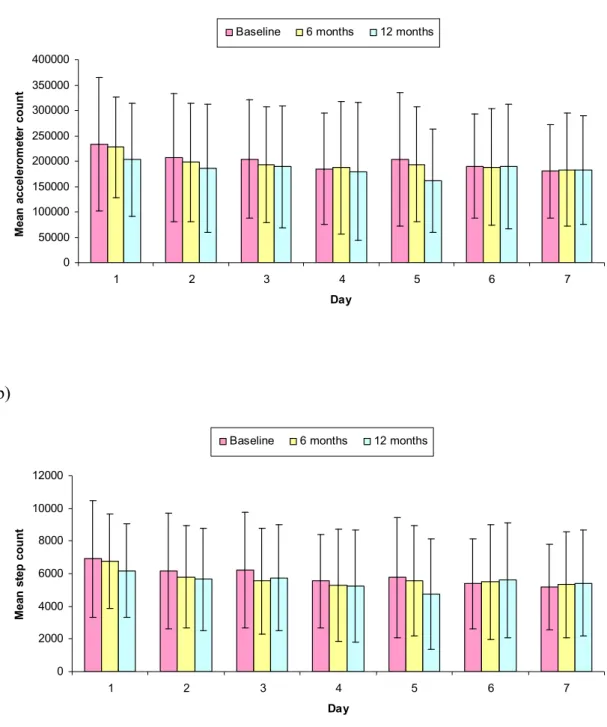
Figure 1 illustrates the pattern of accelerometer and step count for the 7 days of wear at baseline, 6 and 12 months. An effect of day was recorded for both accelerometer and step counts at each time point; for accelerometer counts (at baseline F(5.2,638.1)=5.83, p=0.000, 6 months F(6,612)=3.35, p=0.003 and 12 months F(6, 618)=2.85, p=0.009)) and for step counts (at baseline F(6,720)=7.10, p=0.000, 6 months F(6,606)=4.52, p=0.000 and 12 months F(6,628)=3.80, p=0.001)). At each time point the greatest mean accelerometer and step count was on day 1. The lowest mean accelerometer and step count was on day 7 at baseline and 6 months, and day 5 at 12 months.
At baseline, day 1 mean accelerometer (233395±131510) and step count (6901±3549) were greater than days 4, 6 and 7. Step count was also greater on day 1 compared to day 5 (5757±3698). Day 7 (5182±2634) had a lower step count than days 2 (6166±3533) and 3 (6196±3540). Accelerometer count on day 1 (227261±99281) was greater than days 4 (187430±130938), 5 (193449±112854), 6 (188309±114915) and 7 (183202±111340) at 6 months. Step count at 6 months was greater on day 1 (6776±2879) than any other day of the week. Day 1 at 12 months had a greater accelerometer (203278±111273) and step
(6190±3403) count than day 5 accelerometer (160793±101945) and step (4739±3054) count. No other significant differences between days of the week for mean accelerometer or step count were found.
There was no significant interaction of day of accelerometer wear in subgroup analysis with age group, intervention group, employment status, socioeconomic status, or BMI classification on accelerometer or step count at any time point.
than days 1, 2 and 3. An effect of day on step count, F(6, 348)=5.91, p=0.000, was found in females at baseline. Day 1 had a greater step count than any other day of the week. An effect of day on accelerometer count was found for females at 12 months, F(4.4,225.4)=5.30, p=0.000, but not for males, F(6,306)=1.32, p=0.247. In females there was a greater count on day 1 than days 2, 5 and 7. Both males, F(6,306)=2.37, p=0.029, and females,
F(4.9,252)=5.39, p=0.000, had an effect of day on step count at 12 months. Males had a greater step count on day 2 than day 5 and females had a greater count on day 1 than days 2, 5 and 7.
Discussion
Patterns of physical activity
In healthy adults a step count <5000 steps/day indicates someone with a ‘sedentary lifestyle’, 5000-7499 steps/day is classed as ‘low active,’ 7500-9999 steps/day is categorised as
‘somewhat active,’ 10,000-12499 indicates an ‘active’ individual and ≥12500 falls into the ‘highly active’ category (Tudor-Locke et al 2008). In this study, using the Actigraph, mean daily step count fell into the ‘low active’ class for women at baseline, apart from day 5 which was classed as ‘sedentary.’ This was greater than mean step count (4352±2981 steps/day) found using theYamax Digiwalker SW-701 (Yamax Corporation, Japan) in a study by Strycker et al (2007) of women with T2D.For men at baseline mean daily step count was >5000 steps every day of the week and classed as ‘low active’,(Tudor-Locke et al, 2008). Tudor-Locke et al (2002) determined normative data for step count/day in people with T2D using a pedometer (Yamax Digiwalker SW-200, Accusplit, CA) in a cross-sectional study. The average step count/day was 6662±3077. A study of 57 people (mean age of 62yrs and BMI of 32kg/m2) with T2D found average daily step count (Yamax Digiwalker SW-700,
Yamax Corporation, Japan), to be 7296±2066 (Engel and Lindner, 2006). These values are similar to values in this study and place participants in the ‘low active’ class.
This study found indications of higher physical activity among males, those <61yrs and employed individuals. Men had a greater weekly accelerometer count at baseline than women, although step count was not significantly different. This may be due to men
performing more, higher intensity physical activities than women, which would record more accelerometer counts but not step counts (Melanson et al, 2004). Tudor-Locke et al (2002) found no differences in steps/day measured using a pedometer (Yamax Digiwalker SW-200, Accusplit, CA), between 98 males and 62 females, with T2D. Mean participant age was 52.4±5.3 yrs, which is less than in this study.
Participants aged ≤61years were more active than those aged >61yrs at baseline. Strycker et al (2007) found women younger than 60yrs had greater daily pedometer counts than older women. Findings from epidemiology studies (Caspersen Pereira and Curran, 2000) are generally in agreement with these results; physical activity participation declines with age.
Employed participants had greater accelerometer and step counts than retired participants at baseline. This difference may be due to more ‘working age,’ younger, individuals in the employed compared to retired group. There were no differences in physical activity level between the unemployed and employed or the unemployed and retired. Kaleta & Jegier (2005) found that as occupational physical activity energy expenditure increased the risk of inactivity during leisure time increased. Employed individuals may compensate leisure physical activity for occupational activity thus having similar total activity levels to unemployed individuals who perform more leisure physical activity.
Physical activity patterns were similar across all socioeconomic status and BMI
categories, as well as intervention groups. Engel and Linder (2006) also found no association between socioeconomic status and physical activity in people with T2D diabetes. The results of this study with BMI categories are in contrast to that of Strycker et al (2007) who found step counts were lowest in women with the greatest BMI. Mean BMI, 35.4±8.3kg/m2, was
similar to the BMI of participants in this study. This study included male participants and categorised participants as ≥ or < 30kg/m2.Strycker et al (2007) split BMI into four quartiles
for analysis. This study used a different device to measure physical activity. These differences in study design may explain the differences in findings.
Differences between days for accelerometer and step count at baseline, 6 and 12 months in people with T2D, were found. At all time points the highest accelerometer and step count was on day 1. At baseline and 6 months the lowest counts were on day 7. At 12 months the lowest count was on day 5. The results suggest a ‘wear effect’ may exist when participants are asked to wear an activity monitor for 7 days. Results indicate enhanced physical activity levels at the start of wearing an activity monitor with a return to true physical activity behaviour with time. This appears to occur at each time point (baseline, 6 and 12 months) of measurement. At baseline a significant interaction between day and gender for step count was found and at 12 months for step and accelerometer count. No other significant interaction effects with day were found for intervention group, BMI classification, age group,
employment status or socioeconomic status.
The control group had similar ‘wear effects’ on accelerometer and step count as the intervention groups. Van Sluijs et al (2006) used a randomised controlled trial with a four-group design to determine if measuring physical activity level in a physical activity trial effects physical activity participation and if the measurement effects are similar in the control and intervention group. Participants were randomised to a control or intervention group and further randomised to groups provided with physical activity measurement at baseline, 8 weeks and 6 months or measurement only at 6 months. 717 participants took part, some with T2D. An inverse measurement effect on physical activity participation with the CSA
accelerometer, worn for 3 days, but a positive measurement effect with self-reported physical activity was found. The authors suggest the inverse effect with the accelerometer, by the monitor being unable to accurately record cycling movement in a group of highly active subjects; a popular activity in their study population. For most outcomes the effect of measuring physical activity was not group dependent. Van Sluijs’ findings alongside the results of this study highlight the importance of distinguishing between an intervention or measurement effect on physical activity participation, to make valid conclusions about the effectiveness of interventions.
Few papers have studied the number of days of accelerometer wear required to give an accurate estimate of habitual physical activity in people with T2D. A study of pedometer data reliability (Yamax Digiwalker SW-701,Yamax Corporation, Japan) in women with T2D found that using 2 or more consecutive measurement days provided a reliability coefficient of 0.80 or greater for usual physical activity level (Strycker et al, 2007). A study measuring annual step count in healthy people aged 65-83yrs using a monitor (modified Kenz
Lifecorder, Suzuken Co. Ltd., Japan) found 4 days of randomly timed measurements of step counts provided 80% reliability (Togo et al, 2008), suggesting random sampling can provide a reliable measure of physical activity in fewer days than consecutive sampling, in a healthy elderly population. The results of this study however suggest it is important in people with T2D to have a more continuous sampling period, possibly with the first day of data removed for analysis. When deciding on the length of the sample period the validity of the measure, participant burden, and the requirement of both weekend and weekdays should be weighed up. Taking into consideration at least day one day being discounted from analysis, that protocol adherence decreases with days of wear and the knowledge from previous research suggesting that at least 3-4 days are required for a reliability of 80% but that 7 days give a greater reliability (90%), with the Actigraph in healthy adults (Matthews et al, 2002), a recommendation to wear the accelerometer for a minimum of 8 days would seem reasonable; 7 days would give greater reliability and would allow day 1, which was found to be
consistently higher in this study than other days, to be removed from analysis.
Conclusions
Priority subgroups for physical activity intervention were identified; women, those over 61 years of age and retired individuals. In addition a ‘wear effect’ of measurement of physical activity with an accelerometer is shown. This information should be considered when investigating the effectiveness of physical activity interventions using accelerometers and pedometers as outcome measures. Rejecting the first day of monitoring may be an
appropriate method.
This study was conducted at the Institute of Sport and Exercise, University of Dundee. Special thanks to project participants and to Diabetes UK for funding this research (BDA:RD 04/0003033). We would like to acknowledge Jodi Barnett and Dr Alex McConnachie for their contribution to the study.
Bibliography
Caspersen, C.J., Pereira, M.A., Curran, K.M. (2000) Changes in physical activity patterns in the United States by sex and cross-sectional age. Medicine and Science in Sports and Exercise, 32: pp 1601-1609
Corder, K., Brage, S., Ekelund, U. (2007) Accelerometers and pedometers: methodology and clinical application, Current Opinion in Clinical Nutrition and MetabolicCare, 10: pp 597-603
Engel, L., Lindner, H. (2006) Impact of using a pedometer on time spent walking in older adults with Type 2 diabetes, Diabetes Educator, 32: pp 98-106
Freedson P.S., Melanson, E., Sirard, J. (1998) Calibration of the Computer Science and Applications, Inc. accelerometer, Medicine and Science in Sports and Exercise, 30: pp 777-81
Kaleta, D., Jegier, A. (2005) Occupational energy expenditure and leisure-time physical activity, International Journal of Occupational Medicine and Environmental Health, 18: pp 351-56
Kirk, A., Mutrie, N., MacIntyre, M., Fisher M. (2004) Effects of a 12-month physical activity counselling intervention on glycaemic control and on the status of cardiovascular risk factors in people with Type 2 diabetes, Diabetologia, 47: pp 821-32
Kirk, A., Barnett J., Leese G., Mutrie N. (2009) A randomised trial investigating the 12 month changes in physical activity and health outcomes following a physical activity consultation delivered by a person or in written form in Type 2 diabetes: TIME2ACT, Diabetic Medicine, 26: pp 293-302
Marcus B.H., Selby V.C., Niaura R.S., Rossi J.S. (1992) Self efficacy and the stages of exercise behavior change. Research Quarterly in Exercise and Sport, 63: pp 60-66
Matthews C.E., Ainsworth B.E., Thompson R.W., Bassett DR Jr. (2002) Sources of variance in daily physical activity levels as measured by an accelerometer. Medicine & Science in Sports & Exercise, 34: pp 1376-1381
McCloone, P. (2004) Carstairs scores for Scottish postcode sectors from the 2001 Census. University of Glasgow, Glasgow, Public Health Research Unit
Pate, R.R., Pratt, M., Blair, S.N, Haskell, W.L., Macera, C.A., Bouchard, C., Buchner, D., Ettinger, W., Heath, G.W., King, A.C., Kriska, A., Leon, A.S, Marcus, B.H., Morris, J., Paffenbarger, R.S., Patrick, K., Pollock, M.L., Rippe, J.M., Sallis, J., Wilmore, J.H. (1995) Physical activity and public health: A recommendation from the Centers for Disease Control and Prevention and the American College of Sports Medicine, The Journal of the American Medical Association, 273: pp 402-07
Plasqui, G., Westerterp, K.R. (2007) Physical activity assessment with accelerometers: an evaluation against doubly labeled water, Obesity, 15: pp 2371-79
Strycker, L.A., Duncan, S.C., Chaumeton, N.R., Duncan, T.E., Toobert, D.J. (2007) Reliability of pedometer data in samples of youth and older women, International Journal of Behavioural Nutrition and Physical Activity, 4: pp 4-8
The Expert Committee on the Diagnosis and Classification of Diabetes Mellitus. (2003) Report of the Expert Committee on the Diagnosis and Classification of Diabetes Mellitus, Diabetes Care, 26: pp S5-20
Togo, F., Watanabe, E., Park, H., Yasunaga, A.P., Park, S., Shephard, R.J., Aoyagi, Y. (2008) How many days of pedometer use predict the annual activity of the elderly reliably?
Medicine and Science in Sports and Exercise, 40: pp1058-64
Tudor-Locke, C.E., Bell, R.C., Myers, A.M., Harris, S.B., Lauzon, N., Rodger, N.W. (2002) Pedometer-determined ambulatory activity in individuals with type 2 diabetes, Diabetes Research and Clinical Practice, 55: pp 191-99
Van Sluijs, E.M., van Poppel, M.N., Twisk, J.W., Mechelen, W.V. (2006) Physical activity measurements affected participants’ behaviour in a randomized controlled trial, Journal of Clinical Epidemiology, 59: pp 404-11
Ward, D.S., Evenson, K.R., Vaughn, A., Rodgers, A.B., Troiano, R.P. (2005) Accelerometer use in physical activity: best practices and research recommendations, Medicine and Science in Sports and Exercise, 37: pp 582-588
Wickstrom, G., Bendix, T. (2000) The ‘Hawthorne effect’ – what did the original Hawthorne studies actually show? Scandinavian Journal of Work, Environment and Health, 26: pp 363-67
a) 0 50000 100000 150000 200000 250000 300000 350000 400000
1 2 3 4 5 6 7
Day M ea n a cc el er o m et er c o u n t
Baseline 6 months 12 months
b) 0 2000 4000 6000 8000 10000 12000
1 2 3 4 5 6 7
Day M ea n s te p c o u n t
Baseline 6 months 12 months
Cause of data loss Baseline 6 months 12 months
Stopped working 1 1 1
Battery stopped 1 -
-Non-compliant 2 8 3
Incorrect position - 1
-Fell off, dropped 1 1
-Forgot to wear 5 4 6
Illness - 3 2
Did not want to wear 1 1
-*Over 3 days of missing data
Table 1. Loss of accelerometer data at baseline, 6 and 12 months
participants (n=)
Age
>61 yrs 66
≤61 yrs 68
BMI
≥30kg/m2 87
<30kg/m2 47
DEPCAT
1 24
2 24
3 27
4 8
5 13
6 25
7 13
Employment status
Employed 58
Unemployed 12
Retired 64