Volume 2010, Article ID 987691,15pages doi:10.1155/2010/987691
Research Article
COMAS: A Cooperative Multiagent Architecture for
Spectrum Sharing
Usama Mir, Leila Merghem-Boulahia, and Dominique Ga¨ıti
ICD/ERA, UMR 6279, Universit´e de Technologie de Troyes, 12 rue Marie Curie, 10010 Troyes Cedex, France
Correspondence should be addressed to Usama Mir,usama.mir@utt.fr
Received 19 April 2010; Revised 1 November 2010; Accepted 10 December 2010
Academic Editor: Petar M. Djuric
Copyright © 2010 Usama Mir et al. This is an open access article distributed under the Creative Commons Attribution License, which permits unrestricted use, distribution, and reproduction in any medium, provided the original work is properly cited.
Static spectrum allocation is a major problem in recent wireless network domains. Generally, these allocations lead to inefficient
usage creating empty spectrum holes or white spaces. Thus, some alternatives must be ensured in order to mitigate the current
spectrum scarcity. An effective technology to ensure dynamic spectrum usage is cognitive radio, which seeks the unutilized
spectrum portions opportunistically and shares them with the neighboring devices. However, since users generally have a limited knowledge about their environment, we claim that cooperative behavior can provide them with the necessary information to solve the global issues. Therefore, in this paper, we develop a novel approach for spectrum allocation using a multiagent system that enables cognitive radio devices to work cooperatively with their neighboring licensed (or primary user) devices in order to utilize the available spectrum dynamically. The fundamental aspect of our approach is the deployment of an agent on each device which cooperates with its neighboring agents in order to have a better spectrum sharing. Considering the concurrent, distributed, and autonomous nature of the proposed approach, Petri nets are adopted to model the cooperative behaviors of primary and cognitive radio users. Our simulation results show that the proposed solution achieves good performance in terms of spectrum access, sustaining lower communication overhead.
1. Introduction
The deployment of modern day wireless devices follows the static spectrum usage, where spectrum is assigned to a licensed user for longer durations. This static spectrum assignment is considered to be extremely favorable in order to avoid the device-level collisions; however, it leads to radio spectrum shortage problem creating empty spectrumholes. According to [1], in both rural and urban areas, spectrum usage can go as low as 10–15%, resulting in huge amount of spectrum to be wasted. As a result, the newly arriving unlicensed devices are forced to use unlicensed bands leading to inefficient and crowded spectrum utilizations.
Cognitive radio (CR), firstly coined by Mitola [2], is considered to be an efficient technology to enable dynamic and opportunistic spectrum sharing. Generally, a CR (or secondary) user senses the nearby empty spectrum portions and is capable of sharing them with the neighboring devices, without interrupting the working of licensed (or primary) users. It continuously monitors the environmental radio
frequency (RF) signals and alters its transmission and reception parameters in order to better perform its functions. However, one of the key issues in CR networks is to avoid device level collisions and interferences while maintaining efficient spectrum usage. We argue that a noncooperative node can cause harmful interference to its neighbors and hence can reduce the overall spectrum usage.
is particularly attractive and equally important to create spectrum sharing solutions that can work in dynamic, distributed, and open wireless networks domains.
Therefore, in this paper, an MAS-based approach is pro-posed, where the primary and secondary users are equipped with agents. The secondary user (SU) agents coexist and cooperate with the legacy PU agents using the message-passing and decision-making mechanisms of contract net protocol (CNP) [5]. The whole environment is ad hoc with the frequent changes in the neighborhoods of primary and secondary users. Moreover, in order to capture the agents’ interactions under mobile conditions, Petri net (PN) modeling is used [6]. The graphical and analytical nature of PN allows us to visualize the detailed feasibility analysis of agents’ internal behaviors when they have to make spectrum sharing deals/agreements. While passing through several cooperative stages, we study the interagent message exchange in order to make cooperative decisions. In this context, our previous works [7, 8] have focused on proposing a cooperative spectrum sharing framework and analyzing its behavior. Unlike our previous contributions, in this paper we deploy our primary and secondary users according to Poisson distributions [9] and monitor their arrivals and departures under ad hoc conditions. These distributions help us in identifying the exponential time periods (or holding times) for which the users utilize the available spectrum.
The rest of the paper is organized as follows. Prior works related to dynamic spectrum sharing are summarized in Section 2. Section 3 formulates the problem statement. InSection 4, we propose our cooperative framework. Petri net model along with some important properties of our design is presented inSection 5.Section 6depicts simulation results. Finally,Section 7concludes our paper with the future perspectives.
2. Related Work
In the recent past, several dynamic spectrum sharing approaches have been proposed using different techniques such as game theory and auctions and medium access control protocols. In fact, some researchers have also drawn their focus towards multiagent-based approaches for spectrum sharing. In [10], an MAS is used for managing spectrum resources across several wireless LANs (WLANs), collocated in a geographical area. Each access point (AP) located in a WLAN contains an agent which interacts with the neighboring AP agents (located in other WLANs) to form an MAS. The internal architecture of an agent consists of two parts: predictive parameter estimation,which generates parameter estimates using the signal characteristics received from WLAN environments, andresource management opti-mization, which decides the suitable spectrum bands to be selected. The proposed approach is explained conceptually, but none of the analysis and experiments are shown. On the contrary, the works proposed in [11, 12] consider market-based auctions for dynamic spectrum sharing. The SUs working as consumer agents submit their bids to the PUs (or auctioneer agents) which shows their willingness
for spectrum sharing. Theauctioneer agentsthen share the spectrum based on the received bids. The ultimate aim of using auctions is to provide an incentive for SUs to maximize their spectrum usage (and hence the utility), while allowing network to achieveNash Equilibrium. However, considering the competitive nature of market-based approaches, it is hard to develop agents with unselfish behaviors.
According to Weib and sen [13], agents should have the ability to learn from their past states in order to better perform their following actions/moves. This MAS learning can provide significant contribution to spectrum allocation in CR networks, if the devices have the knowledge of their past sharing patterns and neighborhood movements. In vicinity, the solutions based on MAS learning are presented in [14,15]. Basically, the SUs periodically share the relative traffic information on the sensed channels (they are likely to be used in near future), with the neighboring devices. Based on this information exchange, multiagent learning (i.e., delay sensitive and Q-learning) algorithms are proposed which allow the CR users to dynamically and autonomously opti-mize their transmission power on a selected channel and to avoid the inter-device interferences. Conversely, sometimes these learning algorithms can create a situation, where the agents have weak assumptions about other agents’ spectrum usage making the task of getting accurate information more difficult.
A different cooperative approach named DSAP (dynamic spectrum access protocol) is presented in [16]. This approach is based on the concept of centralized server which is responsible for leasing spectrum to the requesting users in a small geographical region. The server also maintains a global view of the network’s channel conditions through a series of frequent information exchanges with its clients. However, centralized server can become a huge bottleneck in diverse network conditions.
Game-theoretical solutions are considered to be a perfect match of nature for dynamic spectrum allocations. Mostly, in these approaches [17,18], to efficiently utilize the scarce spectrum resource, PUs adopt the roles of the leaders, by selecting a subset of neighboring SUs and granting them spectrum access. In return, SUs work as the followers, by paying PUs the relative price for spectrum utilization and maximizing their utilities in terms of spectrum access for a specific time period. Yet, each user focuses on maximizing its individual usage without taking into account the others, showing selfish behaviors. As a result, in order to allow players to work interdependently, cooperative games are pro-posed [19,20]. In cooperative games, the SUs’ transmission powers and spectrum usage are common knowledge, and their utility functions are chosen in order to maximize the global utility. At the same time, cooperative approaches require a feedback from each player to be sent to the centralized server about its utility function, increasing the overall algorithmic complexity.
acknowledge the request, and the bargaining group is formed ensuring minimum spectrum allocation to each group mem-ber. The experimental results prove that local bargaining performs similar to greedy approach [22] incurring less communication overhead.
Aside from local bargaining and game-theoretical approaches, some authors suggest that the spectrum sharing problems are similar to MAC issues [23], where several users try to access the same channel and their access should be coordinated with the neighboring users to avoid interferences. In MAC-based spectrum sharing [24, 25], when an SU is using a specific channel, both the transmitter and the receiver synchronize themselves by sending a busy tone signal through the associated control channel, such that the signal interferences should be avoided. Nevertheless, sending frequent busy tones can interrupt the neighboring devices, because each time they have to stop their normal working flow in order to listen to the busy tone on the control channel.
Our proposed approach is different from the above as we consider a framework where PU agents are working together with the SUs in order to enable dynamic spectrum allocations. The agents’ internal behaviors are cooperative and unselfish, which allow them to help maximizing each others’ utility functions. To the best of our knowledge, the idea of deploying a cooperative MAS over CR networks under ad hoc conditions along with the modeling of users’ spectrum sharing process using Petri nets and detailing their internal message structures has not been previously addressed. Therefore, we think that our work will provide a novel contribution to the current dynamic spectrum access literature.
3. Problem Description
Before formulizing our problem statement, let us consider an ad hoc network scenario in Figure 1(a scenario of two PUs and one SU is shown just as an example for depicting the deployment of cooperative agents under ad hoc network setting). The figure depicts an emergency situation during an accident in a very remote area, where the user is in a noncovered zone (i.e., the radio resources at this moment are not available) or the radio access technology requires an energy that the terminal (a mobile, a laptop, or a PDA) does not own. In this case, an SU should observe the nearby PUs (PU1 and PU2) and sense their transmission signals to
identify the available spectrum bands. Then, its agent can cooperate with the conforming primary user agents to make dynamic spectrum sharing agreements.
We now formulize our problem. LetG = (N, A) be a directed network consisting of a set of mobile nodesNsuch that (SU∪PU) ∈ N and a set of directed arcs A. Each directed arc (i, j) ∈ A connects a secondary user SUi to
a primary user PUj. Similarly, we can denote the directed
arc (j, i) ∈Ato connect PUj toSUi. The secondary users
are cooperating with the neighboring primary users to have a spectrum sharing agreement. We assume that si j is the
amount of spectrum that a secondary user“i”is desiring to
An SU involved in multiple spectrum sharing agreements
PU agent 1
SU agent
PU agent 2 - Observe
- Sense - Cooperate
Figure1: Spectrum sharing under an ad hoc network.
get from a primary user“j”. Similarly,ti j is the amount of
time for which“i”wants to utilize the spectrum, andpi j is
the price it is willing to pay to“j”. On the other hand, for a primary user“j”,sjiis the amount of spectrum it is willing
to share with “i”,tji is the respected time limit, andpji is
the price it is expecting to get after sharing its spectrum. We can formulate the above model for each secondary user “i” as follows:
Maximize
(i,j)∈A
si jti j (1)
subject to
Minimize
(i,j)∈A
pi j ∀SU∈N. (2)
Similarly, for primary users,
Maximize
(j,i)∈A
pji (3)
subject to
Minimize
(j,i)∈A
sjitji ∀PU∈N, (4)
lji≤sji≤uji, (5)
whereljiandujiare the lower and upper bounds of available spectrum of “j”. This means that “i” cannot ask for an amount of spectrum above this limit.
4. Cooperative Spectrum Allocation Framework
working of our cooperative approach:
(i) dynamic spectrum sensor, (ii) spectrum characterizer, (iii) secondary user interface,
(iv) agent’s knowledge module, and (v) agent’s cooperation module.
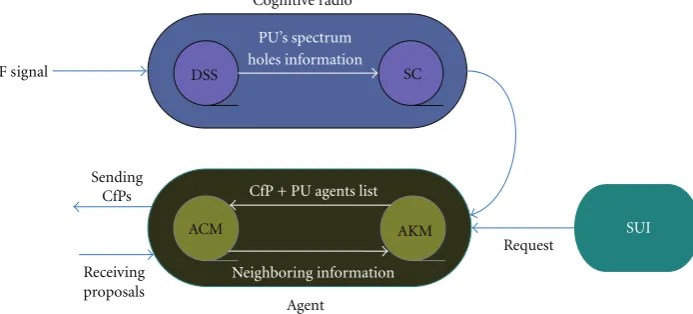
The working of these modules is described, in the following. Obviously, the primary user does not contain the cognitive radio module, while the agent module is common in both the primary and secondary users. Note that, in essence, spectrum sensing and characterizing is beyond the scope of our work; thus, our focus will be on agent module which is the key functionary to enable cooperation between primary and secondary users.
4.1. Dynamic Spectrum Sensor. The function of dynamic
spectrum sensor (DSS) is the sensing of radio spectrumholes by continuously monitoring the neighboring PU signals. Several techniques such as PU’s weak signal and its energy detection [26] and cooperative detection [27] can be used to perform spectrum sensing. For DSS, it is also necessary that the sensing is performed by considering a real-time dynamic environment, because it is not obvious at what time a spectrum band is occupied or when it is free. Thus, all the factors such as PU’s signal power with the respected noise, spectrum traffic (by calculating the number of current users and taking into account the application type), sampling time, and intervals must be kept in consideration.
4.2. Spectrum Characterizer. Spectrum characterizing can be
considered as a subfunction of spectrum sensing. Basically, our spectrum characterizer (SC) module functions as to arrange/divide the spectrum holes information (received through DSS) according to capacity. In a simple way, to create a capacity-based descending ordered list of neighboring PUs, SC uses the Shannon Theorem:
C=Blog2(1 + SNR), (6)
whereCis the capacity inbits per second,Bis the bandwidth measured inhertz and SNR is the respected signal-to-noise ratio inwatts. For more details, the complete derivation and formulation of the above equation is found in [28].
4.3. Secondary User Interface. The third part, secondary user
interface (SUI) sends arequestmessage to the agent module, whenever a user wants to have a portion of spectrum (for internet surfing, watching high quality videos, etc.). The message is of the form req (s,t), wheresis the amount of spectrum needed by the SU depending upon its application in use, for a time duration t. In reality, the user’s request depends upon the application to be used. For example, if a user runs a Skype-based multimedia application on its PDA or cell phone on daily bases, then each time this application is executed, its request for spectrum utilization will remain the same.
4.4. Agent’s Knowledge Module. Agent’s knowledge module
(AKM) gets PUs’ characterization information from SC module which serves as a motivation for agents that sub-sets of neighbors having unutilized spectrum portions are available. This list is not permanent, rather it is updated and maintained on regular time intervals. Secondary user’s AKM (or SU-AKM) also gets thereqmessage from SUI module, and, based on the inputs from both the modules, it prepares acall for proposal (CfP)message:
CfP(SUID,s,t,d), (7)
where SUID is the secondary user’s ID (or its agent’s identification) and it is used to help PU to reply back to the corresponding SU,sis the amount of spectrum needed by the SU,t is the desired time limit (or holding time) for the spectrum utilization, anddis the deadline to receive the PUs’ responses (proposals). Parallel toCfPcreation, SU-AKM maintains the neighboring PUs’ information that is received via frequent interactions between the agents, along with a list of previously receivedproposals(if there exist any). This information includes the leaving and joining of neighboring nodes in a network and their current spectrum status, and it helps an SU to create a more preciseCfP. Uniformly, the PU-AKM module functions almost in the same manner by maintaining the neighboring SUs’ arrivals and departures information and a list of their previous spectrum demands.
4.5. Agent’s Cooperation Module. Agent’s cooperation
mod-ule (ACM) manages the cooperation between primary and secondary users. After the reception of a CfP message
from SU-AKM, the SU-ACM sends the received CfP to
the neighboring and currently available PU agents. The PUs are considered to be available if they still exist in the corresponding SU’s neighborhood with their spectrum portions. Besides, SU-ACM also performs the main decision for an SU by selecting the appropriateproposal. In much the same way, PU-ACM chooses the most suitableCfPfor a PU and sends theproposalin response. Finally, the appropriate agreement for both the primary and secondary users is the one which is profitable and maximizes their utility values.
On average, the utility for a PU is the price paid by SU agents for their spectrum utilization divided by the amount of spectrum it has shared for the respected time period. An SU agent’s utility is represented as its spectrum usage for the required time divided by the corresponding price paid to the PUs.
Accordingly, Figures 3 and 4 delineate the behavioral working of secondary and primary users, respectively. Both the behaviors show the same characterizing, analyzing, sending, receiving, and deciding steps mentioned before. The spectrum sharing process for an SU starts by getting the characterization results and the user requirements and continues until the sending of CfPs and receiving of the proposals. The process ends either by having an agreement or disagreement. For a PU, the process follows the same pattern by first analyzing the receivedCfPs, sending theproposalsas responses, and finally ending the process either by receiving
RF signal DSS SC Cognitive radio
PU’s spectrum holes information
ACM AKM
Agent
SUI
Neighboring information CfP + PU agents list
Sending CfPs
Request
proposals Receiving
Figure2: Various functioning modules for primary and secondary users.
5. Petri Net Model for the Cooperative Approach
Petri Net (PN) [6] is a graphical tool for the formal description of the flow of activities in complex systems. Generally, PNs are used to represent the logical interactions among nodes, devices, and parts of a system. Their discrete and distributed nature makes them highly suitable to model interagent interactions and capture the dynamics of decentralized environments. A simple PN model is shown in Figure 5. Basically, it contains two types of nodes, namely, a set of placesP = {p1,p2,. . .,pn}and a set of transitions
T = {t1,t2,. . .,tm}. A place is represented by a circle, and a transition can be shown by a bar (or a box). Further, a PN consists of a set of inputsI, outputsO, and the markingsM (assignment oftokensto the places). The marking of a PN is a vector, the components of which are positive integer values. The dimension of this vector is equal to the number of places.
Atoken(represented by a small filled circle) is moved from
one place to another when a transition is fired. For example, inFigure 5, firing of transitionst1,t2,t3, andt4can allocate
several resources from one agent to another, and these firings can be represented by removal oftokens from input places and their addition to the output places.
5.1. Modeling Spectrum Sharing Agreement/Disagreement
Using PN. A cooperative spectrum sharing model between
a primary and a secondary user is a five-tuple N =
{P,T,I,O,M}, wherePis the finite set of places,Tis a finite set of transitions,IandOare the input and output functions which specify the input and output places of transitions, and
M = {Mo,Mf}is the set of markings such thatMoandMf
denote the sets of initial and final markings, after firing all the transitions. We also denote by
(i) ∗tthe set of input placespof a transitiont: (p,t)∈I; (ii)t∗the set of output placespof a transitiont: (t,p)∈
O;
(iii) ∗pthe set of input transitionstof a placep: (t,p)∈ I;
(iv)p∗the set of output transitionstof a placep: (p,t)∈ O.
Places represent several states of primary and secondary users during a spectrum sharing agreement/disagreement. A transition t ∈ T is enabled when an event is about to occur (e.g., aCfPis ready to be sent), and it is fired when the event occurs (i.e., a CfP has been successfully sent). Firing a transition will remove token(s) from each ∗t and will add them tot∗. Formally, firing transitions consists of transforming themo∈Mointomf ∈Mf as follows [29]:
mf
p=
⎧ ⎪ ⎪ ⎪ ⎪ ⎨ ⎪ ⎪ ⎪ ⎪ ⎩
mop−firedtoken(s), if p∈ ∗t,
mop+ firedtoken(s), if p∈t∗,
mop, otherwise.
(8)
The cooperation process of an SU with two neighboring PUs to make a spectrum sharing agreement is shown in Figure 6, while the description of various states and transitions is summarized in Tables1and2. The spectrum sharing process starts with placesp1,p4, andp5, where SUi
is ready to sendCfPsand PU1and PU2are ready to receive
them. Firing transition t1 removes a token from place p1
and adds it to p2, p3, and p6. Thus, when transition t1 is
fired, theCfPsare sent from SUi to PU1 and PU2. Both the
tokens fromp2andp3enable transitionst2andt3, and firing
of these two transitions adds one token each top7 andp8,
showing the reception of CfPsby PU1 and PU2. Similarly,
the remainder of the message passing process follows the same pattern (oftokens removal and addition), where SUi
accepts PU1for spectrum sharing and it rejects PU2due to its
unsatisfactory proposal. The states and transitions involved in these message exchanges are
proposals= p9,p10,p11,p12,t4,t5,t6,
accept= p4,p13,p15,p16,p20,t7,t9, (t12ort13), reject= p1,p14,p5,p17,p18,t8,t10, (t14ort15).
(9)
Start
Wait until a proposal is received
Send accept to selected
PU Send reject to others
Further
Figure3: Secondary user’s behavior.
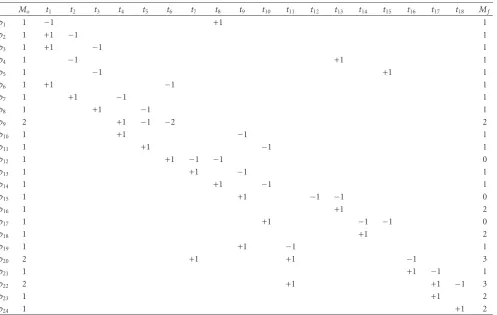
until the spectrum is completely utilized and the respected price is paid. A successful spectrum sharing contains the rest of the states and transitions ofFigure 6. The primary users will behave in the same manner when they have to deal with multipleCfPsat a time. Moreover, if a secondary user receives more than one proposalwhich is equally satisfactory, then the decision will be made on the FIFO bases. Finally,Table 3 depicts the initial and final markings oftokensafter firing all the transitions. It is clear that the value ofMf becomes “3”
only when a spectrum portion is shared or the price is paid.
5.2. Some Definitions. By analyzing our proposed model
along with Tables1and2, we can conclude the following few definitions.
Figure4: Primary user’s behavior.
1
Definition 1. For a secondary user SUi ∈ SU, the Petri net
Ni= {Pi,Ti,Ii,Oi,Mi}, for an empty part of the spectrumsi
for timeti, is a working model if and only if the movement
from initial markingMosito final markingMf si, after firing
all transitions, results in the maximization of its utility function Usui such that Usui = (si×ti)/ci, where ci is the
corresponding price SUithat is asked to pay for its spectrum
utilization. Similarly, for a primary user PUj ∈ PU, a
Petri netNj = {Pj,Tj,Ij,Oj,Mj}, for an empty spectrum
portion sj with the associated price cj, the movement
from initial marking Mop j to final marking Mf p j, results
p6 t1
t14 p1
t8
p7.2
t12 p10.1
p10.5 p10.4
p5.2
t7.2
p14
p2.2
t13 t6
p6
p9.1
t3.1
p7.1
p11
p15 t15 t4
t9 t7.1
p3.2
p8
p13 p12
p9.1
t10
p10.2
p10.3 t11
t5
t3.2 t2.2 p5.1
p2.1 t2.1 p3.1
Figure6: Spectrum sharing process between an SU and two PUs.
Upu j = cj/(sj × tj). Both the primary and secondary users work cooperatively to maximize each other’s utility functions. Especially, the primary users send the proposals which are in their own profit as well as of the requesting secondary users.
Definition 2. A Petri net Ns = {Ps,Ts,Is,Os,Ms}, for an empty part of the spectrums, is said to be unsuccessful if moving fromMos toMf s results in no change in the utility
functions of both the participating secondary and primary users such that
Usui=0, Upu j=0, ∀SUi, PUj∈ {SU, PU},
whereUsui,Upu j∈R.
(10)
In our proposed model, the PN between SUi and PU2
proved to be unsuccessful, because, after performing all the cooperation steps, the utility functions of both of the users remain unchanged, resulting in spectrum sharing disagreement.
5.3. Behavioral Properties. To verify the efficiency of our
approach, we provide the behavioral properties of the proposed PN model. These properties, when interpreted in the context of the modeled system, allow the system designer to understand the working of the considered network. By behavioral properties we mean the properties which are dependent on all the markings of a PN; that is, the initial and final markings are interlinked. Thus, we provide here the most important behavioral properties such as reachability, boundness, and liveness [30].
Reachability. In order to find out the reachability of the
Table1: Spectrum sharing states.
p1 SUi: ready to sendCfP
p2 PU1: PU agent’s cache (CfParrives)
p3 PU2: PU agent’s cache (CfParrives)
p4 PU1: ready to receiveCfP
p5 PU2: ready to receiveCfP
p6 SUi:CfPsent and wait forproposals
p7 PU1:CfPreceived
p8 PU2:CfPreceived
p9 SUi: SU agent’s cache (proposalsarrive)
p10 PU1:proposalsent and wait for the final response
p11 PU2:proposalsent and wait for the final response
p12 SUi:proposalreceived
p13 PU1: PU agent’s cache (acceptarrives)
p14 PU2: PU agent’s cache (rejectarrives)
p15 PU1: temporarywaitingphase
p16 PU1: furtherCfPreceiving stopped
p17 PU2:rejectreceived and temporary waiting phase
p18 PU2: furtherCfPreceiving stopped
p19 PU1: ready tosharethe acquired spectrum
p20 SUi: ready toutilizespectrum
p21 SUi: spectrum utilized and ready topayprice
p22 PU1: spectrum shared and ready toreceiveprice
p23 SUi: pricepaid
p24 PU1: pricereceived
Table2: Various transitional phases.
t1 SUi: sendCfP
t2 PU1: receiveCfP
t3 PU2: receiveCfP
t4 PU1: sendproposal
t5 PU2: sendproposal
t6 SUi: receiveproposal
t7 SUi: sendaccept
t8 SUi: sendreject
t9 PU1: receive response (accept)
t10 PU2: receive response (reject)
t11 PU1: startsharingthe spectrum
t12 PU1: continue receiving furtherCfPs
t13 PU1: stop receiving furtherCfPs
t14 PU2: stop receiving furtherCfPs
t15 PU2: continue receiving furtherCfPs
t16 SUi: startutilizingthe acquired spectrum
t17 SUi:payprice
t18 PU1:receiveprice
then the final markingmf reachable frommocan be written
as
mf =mo+v, (11)
wherevis the vector containing the firings related top.vcan be denoted as
v= t∈∗p
ϕ(t,p)− t∈p∗
σ(t,p). (12)
Here, ϕt,p and σp,t are the number of tokens added and
consumed fromp.For allp∈P, (11) can be written as
Mf =Mo+V, (13)
whereMoandMf are the initial and final marking sets for all p∈PandVis a vector containing allvrelated to allp.
Reachability is very important for our proposed model as it helps us in calculating the final markings reachable from initial markings and shows the flow of tokens from place to place. To prove this property from our proposed PN let us give an example. As mentioned before,Table 3shows all the initial and final markings with the addition and subtraction of tokens forFigure 6. From this table, we can calculateVand Moas follows:
VT=(0 0 0 0 0 0 0 0 0 0 0 −1 0 0 −1 1 −1 1 0 1 0 1 1 1),
MT
o =(1 1 1 1 1 1 1 1 2 1 1 1 1 1 1 1 1 1 1 2 1 2 1 1).
(14)
Using (14), equation (13) becomes
MTf =(1 1 1 1 1 1 1 1 2 1 1 0 1 1 0 2 0 2 1 3 1 3 2 2).
(15)
Thus, in our PN, the addition of vector V with initial marking setMoenables us to reach the final marking setMf.
Boundness. A placepiof a PN model is said to bek-bounded
if the number of tokens inpialways remain less than or equal
tok; that is,x(pi)≤kfor allp∈P, wherekan integer value
>0 andx(pi) are the number of tokens in placepi.piis always
bounded when it isk-bounded. Boundness is an important property in order to check the design errors in a PN model. For instance, some tokens may permanently stay in places and create serious bottlenecks for the whole PN. InFigure 6, boundness holds for all the places as the number of tokens in each place is within 0 < x(p) ≤ kfor allp ∈ P,where
k= {1, 2}.
In contrast to reachability which is verified using marking sets, boundness can be easily verified using coverability graph [29]. Coverability graph represents all the possible markings of a PN model in the form of a simple tree where Mo
represents the root node, all the markings reachable fromMo
are the nodes, and the arcs represent the firing of transitions. Therefore, for simplicity, we construct a coverability graph inFigure 7for the initial part ofFigure 6that is, for states (p1,p2,p3,p4,p5,p6,p7,p8,p9,p10,p11,p12) and transitions (t1,t2,t3,t4,t5,t6,t8). From the graph, we notice that states (p1,p2,p3,p4,p5,p6,p7,p8,p10,p11,p12) are 1-bounded and statep9 is 2-bounded. Thus, the graph remainsk-bounded
Table3: Initial and final markings.
Mo t1 t2 t3 t4 t5 t6 t7 t8 t9 t10 t11 t12 t13 t14 t15 t16 t17 t18 Mf
p1 1 −1 +1 1
p2 1 +1 −1 1
p3 1 +1 −1 1
p4 1 −1 +1 1
p5 1 −1 +1 1
p6 1 +1 −1 1
p7 1 +1 −1 1
p8 1 +1 −1 1
p9 2 +1 −1 −2 2
p10 1 +1 −1 1
p11 1 +1 −1 1
p12 1 +1 −1 −1 0
p13 1 +1 −1 1
p14 1 +1 −1 1
p15 1 +1 −1 −1 0
p16 1 +1 2
p17 1 +1 −1 −1 0
p18 1 +1 2
p19 1 +1 −1 1
p20 2 +1 +1 −1 3
p21 1 +1 −1 1
p22 2 +1 +1 −1 3
p23 1 +1 2
p24 1 +1 2
Liveness
Definition A. In wireless networks, different tasks are
per-formed at several time instances and similar is the case with Petri net models, where many transitions are ready to fire at distinct times. Generally, a PN is live when there exists at least one transitiont∈Twhich is ready to be fired at a particular time instance. Formally,
t∈T
e¸t(Γ)≥1, (16)
whereΓis the time instance ande¸tis the function indicating
either a transition t is ready to fire or not [31]. Our PN remains live during a spectrum sharing process because at least onet∈Talways remains ready to be fired. For example, when PU1and PU2receive theCfPs, the transitionst4andt5
are in their ready states and they are fired when PU1and PU2
send their proposals to SUi. Then, at the next time instance,
transitiont6 is ready to fire and is fired when SUisends its
responses to PU1 and PU2 and similar is the case with the
other transitions. Thus, the PN remains live for the whole process of spectrum sharing.
Definition B. A PN is said to be live if and only if, from
any node in its reachability graph, it is possible to find a directed path having this node as origin. In other words, the PN is live when each node of its directed graph is the origin of at least one arc. If we consider the coverability graph of
Figure 7, we notice that each node contains at least one arc as origin; thus, this coverability graph is live. Likewise, for the proposed PN model ofFigure 6, we can clearly see that each transition contains at least one arc to reach its next state until the spectrum sharing process arrives to its end. Therefore, we can conclude that the proposed PN is live.
6. Experimental Results
6.1. Setup. In this section, we present various numerical
results to evaluate the working of the proposed cooperative approach, based on the following simulation setup. Multiple sets of primary and secondary users are randomly placed according to Poisson distribution [9] in a noiseless and mobile ad hoc network with the continuous change in their neighborhoods. The SUs cooperate with the PUs in order to make spectrum sharing deals/agreements. According to the studies presented in [17,32], we set the elapsed simulation time TE to 90 minutes. All the simulations are conducted
in Java Application Development Environment (JADE) [33], over a PC with 2.4 GHZ dual processor and 4 GB memory.
t7
Figure 7: Coverability graph for some states and transitions of Figure 6.
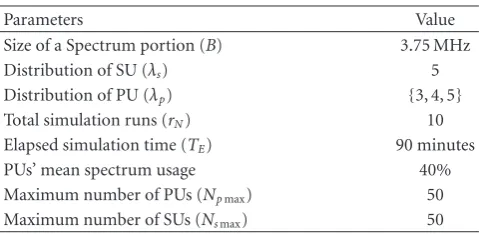
Table4: Fixed values of parameters.
Parameters Value
Size of a Spectrum portion (B) 3.75 MHz
Distribution of SU (λs) 5
Distribution of PU (λp) {3, 4, 5}
Total simulation runs (rN) 10
Elapsed simulation time (TE) 90 minutes
PUs’ mean spectrum usage 40%
Maximum number of PUs (Npmax) 50
Maximum number of SUs (Nsmax) 50
for plotting the graphs. According to [35], the fractional percentage of the time for which the spectrum is being used by the PUs (or holding time) in an urban environment follows the exponential distribution with mean μp and is measured as approximately 40 to 45%; thus, we set the mean spectrum usage of PUs to 40%. Considering the capacity of a single machine, the maximum number of primary and secondary users is 100 in total. Moreover, the ratesλpandλs
denote the Poisson distributions of primary and secondary users. For simplicity, we fix the value ofλsto 5 and compare our parameters at various values ofλp(i.e.,λp=3, 4, and 5). This variation factor helps us in understanding the behaviors of SUs when they have to deal with different numbers of PUs. Additionally, during a simulation run of 90 minutes, we also observe distinct values of our parameters over five different time intervals of 18 minutes each, ensuring that the parameters can be compared across several time instants. We calculate a primary user’s utility as the price paid by SUs for spectrum utilization divided by the amount of spectrum it has shared for the respected time period. Likewise, a secondary user’s utility is represented as its spectrum usage for the required time divided by the price paid by the PUs. Finally, the number of nonallocated spectrum portions measures the overall percentage of spectrum deficit (Ldef).
6.2. Obtained Results. Firstly, we show the histograms of PUs’
spectrum usage at several values ofλpinFigure 8. All three
histograms depict the spectrum usage probability of PUs at different instances of time. At early stages, this probability is high, but, later, the spectrum is mostly unutilized, and, thus, the SUs can have a higher percentage of successful spectrum sharing agreements during these periods.
Successful Agreements. We now plot the average number of
successful spectrum sharing agreements between primary and secondary users. By a successful agreement, we mean that an SU has utilized the assigned spectrum according to its requirement. Formally for an agreementk,
k=
And, if we denote a successful agreement byksuccess, we can
write the summation as
A(s)=ksuccess, (18) whereA(s) represents the number of successful agreements and tsu
utilized and trequestedsu are the time values for which
spectrum is being utilized and requested by the secondary user. Of course, due to the cooperative nature of agents, the secondary user pays the agreed price (for its spectrum utilization) to the respected primary user.
Figures 9(a)and 9(b) show three curves of As plotted
using several numbers of SUs (Ns) at various time values.
From the figures, the differences in As at λp = 3, 4, and
5 are clearly observable. For small Ns, the values ofAsare
marginally the same, because most of the PUs are busy during the early time periods and it is difficult for SUs to find the required PUs with the available spectrum portions. WhenNsreaches higher values with simulation time greater
than 50 minutes, the distinction betweenAsis much clearer.
This distinction also shows that fewer successful agreements are made whenλp =3, because the number of available PUs are less. But, when we increaseλpto 4 and 5, the values ofAs
almost reach their maximum positions. Furthermore, we can observe that for bigger values ofλp, the cooperation between the primary and secondary users is still very effective, as more SUs have made successful spectrum sharing agreements.
Percentage Utility. Figure 10compares the average percent-age utility of SUs at different time values. Particularly, the utilities are within 20 to 55% when λp = 3, while they
can reach 70% (80% resp.) when λp = 4 (λp = 5
0 20 40 60 80
Figure8: Primary users’ spectrum utilization.
10 15 20 25 30 35 40 45 50
Number of SUs (Ns)
N
Elapsed simulation time TE (minutes)
(b)
Figure9: Successful agreements with (a) number of SUs and (b) elapsed simulation time.
three values ofλp, since the PUs are always less (or equal) in number compared to SUs and there is relatively a higher chance that they can easily find SUs to share their unutilized spectrum.
We now compare the average percentage utility values of primary and secondary users achieved through simulations to the optimal value. Optimal value can be achieved when the average percentage utilities of primary and secondary users are fully satisfied (i.e., 100%). Figure 12 summarizes the results. We observe that the values achieved through experiments are very close to the optimal value and they can reach almost 90% showing good utility-based performance of our approach.
Another way of showing above results is to compare the number of SUs with spectrum demands and those which are served in the end. For this depiction, we fix the maximum number of SUs to 50 and observe the results for different
20
0
Figure11: Percentage utility of PUs.
Experimental value
Number of secondary and primary users
U
tilit
y
(%)
Figure12: Comparison to the optimal value.
values of PUs, in Figure 13. Served SUs are those which have completely obtained the required spectrum. In all the three comparisons, even though a large amount of SUs have been completely served, still a percentage of them remains unsuccessful. Thus, under ad hoc situations, despite the fact that the primary and secondary users are equal in numbers, the results are not fully achieved.
Communication Cost. The number of cooperation messages
for successful spectrum sharing agreements determines the average communication cost (Mcost). Formally,
Mcost=
A(s) h=1mh
A(s) , (19)
wheremhis the number of messages sent and received for a
successful agreementhsuch that 1≤h≤A(s).
Different values of Mcost along with several numbers of successful agreements are plotted in Figure 14. In the figure, the value of Mcost is initially 4, but it climbs to an average of 8 messages per agreement. This increasing pattern in Mcost is directly relational to number of PUs (Np); that
is, when the available PUs in an SU’s neighborhood are less in number, the message exchange between the users is not high. Similarly, when Np increases, the SUs can find
more PUs in their neighborhood causingMcost to increase.
0
Number of primary users (Np)
Number of SUs with spectrum demands Number of served SUs in the end
λp=3
Figure13: SUs with spectrum demands versus number of served SUs.
Number of successful agreements (As) 0
Figure14: Communication cost.
However, the values ofMcostare not very high, showing the communication efficiency of our approach.
Explicitly Awarded Spectrum Sharing Agreements. Another
important novelty of our approach is the ability of PUs to make explicit agreements with the neighboring SUs. The necessity of explicit agreements arrives in situations, where the corresponding PU’s spectrum portion is in utilization at the time ofCfPreception and therefore its current spectrum status is set to “busy.” In our approach, the PUs can still send their explicit proposals to SUs when they get unoccupied. Each PU maintains a list of recentCfPs(stored in its cache), and, accordingly, it sends theproposalto the most suitable one whose deadline is not yet expired. In relation,Figure 15 delineates the percentage of explicitly awarded spectrum sharing agreements. It is clearly envisaged that almost 10 to 20% of the agreements have been explicitly awarded by the PUs.
Explicitly
Number of successful agreements 0
Figure15: Explicit spectrum sharing agreements.
0
Elapsed simulation time TE (minutes)
λs=5
Figure16: Spectrum deficit.
of agents. This observation also shows the performance degradation of the whole system with an increased amount of traffic. In the corresponding figure, initially the values ofSdef
are within 60–80%, because at these stages most of the PUs are occupied. Later, the values ofSdefcontinue to decrease on a steady pace, as more PUs become available. Still, there is not a rapid degradation in overall system performance, showing the efficiency of our proposed solution.
Comparison with Other Approaches. Finally, we compare
our solution to greedy algorithm [22], cooperative local bargaining [21], and dynamic spectrum access protocol (DSAP) [16]. In greedy algorithm, most of the PUs are self-interested, and they are hesitant to share the available spectrum, until they get the highest offer maximizing their individual utility. Local bargaining is cooperative, where the users exchange messages and they self-organize into bar-gaining groups for spectrum sharing. DSAP is based on the concept of centralized licensed server which is responsible for leasing spectrum to the requesting users. Thus, we compare our approach to three different solutions showing greedy, cooperative, and centralized behaviors, respectively. All the solutions are implemented under our ad hoc scenario, and the users are deployed according to Poisson processes with
λp=5 andλs=5.
Figure17: Comparison with greedy, local bargaining, and DSAP approaches.
7. Conclusion and Future Perspectives
In this paper, a cooperative approach to enable dynamic spectrum sharing is presented. The solution is based on multiagent cooperation, where the primary and secondary users exchange bilateral messages to make spectrum sharing agreements in an ad hoc manner. The behavioral modeling of our approach based on Petri nets proves its efficiency for dynamic and distributed environments. Experimental results show that, compared to greedy, bargaining, and centralized solutions, our cooperative solution works very effectively without having higher communication cost.
One important area of our future research corresponds to unlicensed spectrum sharing, where the spectrum can be viewed as an open “pool,” and all the devices are of equal rights and priorities, that is, none of the devices have exclusive license for spectrum usage. The unlicensed devices (using multiagent system) can form necessary coalitions in order to maximize spectrum usage and minimize interfer-ences. We are also planning to develop mathematical models for our approach to analyze its working with large numbers of agents.
Acknowledgment
This effort is partly sponsored by the technologies for termi-nals in opportunistic radio applications (TEROPP) Project of French National Research Agency (ANR) under Grant no. ER502-505E and is also partly supported by the Higher Education Commission (HEC), Pakistan.
References
[1] M. Mchenry, “Spectrum white space measurements,” New America Foundation Broadband Forum, June 2003.
[2] J. Mitola,Cognitive radio: an integrated agent architecture for
software defined radio, Ph.D. thesis, KTH Royal Institute of Technology, Stockholm, Sweden, 2000.
[3] K. P. Sycara, “Multiagent systems,”AI Magazine, vol. 19, no. 2,
pp. 79–92, 1998.
[4] E. H. Durfee and V. Lesser, “Negotiating task decomposition
and allocation using partial global planning,” Distributed
Artificial Intelligence Journal, vol. 2, pp. 229–244, 1989. [5] R. G. Smith, “The contract net protocol: high-level
commu-nication and control in a distributed problem solver,”IEEE
Transactions on Computers, vol. 29, no. 12, pp. 1104–1113, 1980.
[6] F. S. Hsieh, “Developing cooperation mechanism for
multi-agent systems with Petri nets,” Engineering Applications of
Artificial Intelligence, vol. 22, no. 4-5, pp. 616–627, 2009. [7] U. Mir, L. Merghem-Boulahia, and D. Ga¨ıti, “A cooperative
multiagent based spectrum sharing,” in Proceedings of the
6th Advanced International Conference on Telecommunications (AICT ’10), pp. 124–130, Barcelona, Spain, May 2010. [8] U. Mir, L. Merghem-Boulahia, and D. Ga¨ıti, “Multiagent based
spectrum sharing using Petri nets,” in Proceedings of
Inter-national Workshop on Artificial Intelligence and Distributed Systems (PAAMS ’10), Salamanca, Spain, 2010.
[9] J. F. C. Kingman,Poisson Processes, Clarendon Press, England,
UK, 1993.
[10] X. Jiang, I. Howitt, and A. Raja, “Cognitive radio resource
management using multi-agent systems,” inProceedings of the
4th Annual IEEE Consumer Communications and Networking Conference (CCNC ’07), pp. 1121–1127, Las Vegas, Nev, USA, January 2007.
[11] A. Tonmukayakul and M. B. H. Weiss, “An agent-based
model for secondary use of radio spectrum,” inProceedings
of the 1st IEEE International Symposium on New Frontiers in Dynamic Spectrum Access Networks (DySPAN ’05), pp. 467– 475, Baltimore, Md, USA, November 2005.
[12] C. Kloeck, H. Jaekel, and F. Jondral, “Multi-agent radio
resource allocation,”Mobile Networks and Applications, vol. 11,
no. 6, pp. 813–824, 2006.
[13] G. Weib and S. Sen,Adaptation and Learning in Multiagent
Systems, Springer, Berlin, Germany, 1996.
[14] H. Li, “Multi-agent Q-learning of channel selection in
multi-user cognitive radio systems: a two by two case,” inProceedings
of IEEE International Conference on Systems, Man, and Cyber-netics, pp. 1395–1422, San Antonio, Tex, USA, 2009.
[15] H. P. Shiang and M. van der Schaar, “Delay-sensitive resource management in multi-hop cognitive radio networks,” in Proceedings of the 3rd IEEE Symposium on New Frontiers in Dynamic Spectrum Access Networks (DySPAN ’08), pp. 120– 131, Chicago, Ill, USA, October 2008.
[16] V. Brik, E. Rozner, S. Banerjee, and P. Bahl, “DSAP: a
protocol for coordinated spectrum access,” inProceedings of
the 1st IEEE International Symposium on New Frontiers in Dynamic Spectrum Access Networks (DySPAN ’05), pp. 611– 614, Baltimore, Md, USA, November 2005.
[17] D. Niyato and E. Hossain, “Competitive pricing for spectrum
sharing in cognitive radio networks: dynamic game, ineffi
-ciency of nash equilibrium, and collusion,”IEEE Journal on
Selected Areas in Communications, vol. 26, no. 1, pp. 192–202, 2008.
[18] M. Liu, S. H. A. Ahmad, and Y. Wu, “Congestion games with resource reuse and applications in spectrum sharing,” inProceedings of International Conference on Game Theory for Networks (GameNets ’09), pp. 171–179, Istanbul, Turkey, May 2009.
[19] C. Ghosh, D. P. Agrawal, and M. B. Rao, “Channel capacity maximization in cooperative cognitive radio networks using
game theory,”ACM Mobile Computing and Communications,
vol. 13, pp. 2–13, 2009.
[20] K. Hamdi and K. B. Letaief, “Cooperative communications
for cognitive radio networks,” inProceedings of the 8th Annual
Postgraduate Symposium. Convergence of Telecommunications, Networking and Broadcasting, pp. 878–893, Liverpool, UK, 2007.
[21] L. Cao and H. Zheng, “Distributed spectrum allocation via
local bargaining,” in Proceedings of the 2nd Annual IEEE
Communications Society Conference on Sensor and AdHoc Communications and Networks (SECON ’05), pp. 475–486, Santa Clara, Calif, USA, September 2005.
[22] H. Zheng and C. Peng, “Collaboration and fairness in
oppor-tunistic spectrum access,” inProceedings of IEEE International
Conference on Communications (ICC ’05), pp. 3132–3136, Seoul, Korea, May 2005.
[23] S. Kumar, V. S. Raghavan, and J. Deng, “Medium access
control protocols for ad hoc wireless networks: a survey,”Ad
Hoc Networks, vol. 4, no. 3, pp. 326–358, 2006.
and Software Engineering (CSSE ’08), pp. 214–218, December 2008.
[25] S. Sengupta, M. Chatterjee, and K. Mainak, “Dynamic spec-trum access in cognitive radio based tactical networks,” in Proceedings of IEEE Wireless Communications and Networking Conference (WCNC ’09), pp. 1343–1348, Budapest, Hungary, April 2009.
[26] W. Zhang, R. K. Mallik, and K. ben Letaief, “Optimization of cooperative spectrum sensing with energy detection in
cognitive radio networks,” IEEE Transactions on Wireless
Communications, vol. 8, no. 12, pp. 5761–5766, 2009. [27] C. Qi, J. Wang, and S. Li, “Weighted-clustering cooperative
spectrum sensing In cognitive radio context,” inProceedings
of the WRI International Conference on Communications and Mobile Computing (CMC ’09), pp. 102–106, January 2009.
[28] T. C. Clancy, Dynamic spectrum access in cognitive radio
networks, Ph. D. dissertation, University of Maryland, College Park, Md, USA, 2006.
[29] J.-M. Proth and X. Xie, Petri Nets: A Tool for Design and
Management of Manufacturing Systems, John Wiley & Sons, West Sussex, UK, 1996.
[30] T. Murata, “Petri nets: properties, analysis and applications,” Proceedings of the IEEE, vol. 77, no. 4, pp. 541–580, 1989. [31] Z. Liu, “Performance analysis of stochastic timed petri nets
using linear programming approach,”IEEE Transactions on
Software Engineering, vol. 24, no. 11, pp. 1014–1030, 1998.
[32] Y. Xing,Cognitive radio networks: learning, games and
opti-mization, Ph.D. thesis, Stevens Institute of Technology, Hobo-ken, NJ, USA, 2006.
[33] http://jade.tilab.com/.
[34] D. Kim, L. Le, and E. Hossain, “Joint rate and power allocation for cognitive radios in dynamic spectrum access
environment,”IEEE Transactions on Wireless Communications,
vol. 7, no. 12, pp. 5517–5527, 2008.