R E S E A R C H
Open Access
Joint multiband signal detection and cyclic
spectrum estimation from compressive samples
Lebing Pan
1,2*, Shiliang Xiao
1,2, Xiaobing Yuan
1and Baoqing Li
1Abstract
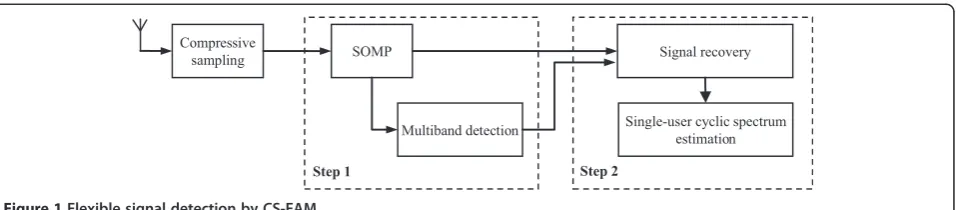
This paper focuses on wide-sense stationary signal processing within a compressive sensing framework, proposing a new method of compressive sampling fast Fourier transform (FFT) accumulation method (CS-FAM). Depending on how it is applied, CS-FAM has one or two steps, allowing for versatility in multiband signal detection and parameter extraction. In the first step, the active sub-bands are detected using multiple measurement vectors (MMVs) and multiuser detection is achieved using a bandwidth constraint. In applications where it is required, such as in estimations of carrier frequency, symbol rate, or modulation format identification, the second step can be used to reconstruct the cyclic spectrums of each user individually. Based on the results of first step, parameter extraction is performed by searching for peaks in the cyclic spectrum rather than by the usual method of setting a threshold. Compared to other cyclic feature detection methods based on sub-Nyquist sampling, CS-FAM is low in complexity, allowing for practical implementation. Based on the results of the first step, parameter extraction from the cyclic spectrum is performed by searching for peaks rather than by setting a threshold. Although CS-FAM can only be employed for multiband signal detection, compared to other cyclic feature detection methods based on sub-Nyquist sampling, it is low in complexity, which makes practical implementation possible. Numerical simulations are presented to demonstrate the robustness of CS-FAM's multiband signal detection and the effectiveness of its cyclic spectrum estimation against both sampling rate reduction and noise uncertainty.
Keywords:Multiband signal detection; Parameter extraction; Cyclic spectrum estimation; Compressive sampling
1 Introduction
Signal detection and parameter estimation of wideband radio signals are increasingly important aspects of commu-nication systems such as electronic countermeasures [1], carrier tracking [2], and spectrum sensing [3]. However, conventional detection techniques using standard analog-to-digital converters (ADCs) have been primarily designed to capture narrowband signals [4]. Wideband sensing based on Nyquist sampling is similarly unsuitable in such applica-tions, often yielding either an insupportable sampling bur-den or an unacceptable sampling complexity. Additionally, because of this, wideband receivers require a high sampling rate, which typically results in high power consumption. In contrast, analog front-ends have often been used to capture sparse signals in scenarios such as cognitive radio networks
and radar detection systems. Consequently, compressive sampling (also known as compressive sensing [5]), conducted using low rate ADCs, has been extensively employed to detect wideband signals. With the under-lying assumption of signal sparsity, this technology is capable of complete signal recovery from a small number of linear measurements [6].
A number of methods for radio signal detection using compressive sampling have been presented in the litera-ture. Several studies have focused on use of blind multi-band signal reconstruction [7] and power spectrum sensing [8-11]. These works aim to detect active sub-bands distributed over a wide frequency spectrum, which is a crucial step in dynamic spectrum access [12,13]. Other literature has proposed methods for cyclic spectrum esti-mation using sub-Nyquist sampling. Also known as cyclic feature detection, these methods pertain not only to spectrum sensing but also to symbol rate estimation, car-rier frequency estimation, and modulation identification [14-17]. In [18], the spectrum correlation function (SCF) * Correspondence:[email protected]
1
Key Laboratory of Wireless Sensor Networks, Shanghai Institute of Microsystem and Information Technology, Chinese Academy of Sciences, 865 Changning Road, Shanghai 200050, China
2University of Chinese Academy of Sciences, No.19A Yuquan Road, Beijing
100049, China
(also known as cyclic spectrum.) of each narrowband nal was analyzed individually. This scheme recovered sig-nals in the time domain using compressive sampling and then computed the SCF at the Nyquist rate. The linear re-lationship between the SCF and the time-varying covari-ance function was first derived in [19] and [20]. This operation makes the sparse approximation algorithms generated by compressive sensing available for cyclic feature detection. The scheme in [21] used the sym-metry property of the cyclic autocorrelation function for blind spectrum sensing. On another side, the time smoothed algorithm known as the fast Fourier trans-form (FFT) accumulation method (FAM) was presented in [22] for effective cyclic spectrum estimation based on the Nyquist sampling. A practical implementation of this algorithm for spectrum sensing, presented in [23], showcased its high efficiency and low complexity. In this paper, a two-step compressive sampling FAM (CS-FAM) scheme that employs multiple measurement vectors (MMVs) is presented. Multiband detection is accomplished in the first step by means of a modified version of the periodogram method using sub-Nyquist samples, while cyclic spectrum estimation is performed in the second step.
The main characteristics of CS-FAM are as follows: (i) based on the FAM framework, this scheme has low complexity, which is important because cyclic spectrum analysis can lead to high complexity due to the use of two-dimensional spectrum correlation computations, es-pecially from compressive samples. For example, the methods in [20] required matrices proportional to N4. However, in implementations such as high-resolution cyclic spectrum estimation by the order of N×N, the memory requirements are quite large, making cyclic spectrum analysis especially difficult. (ii) Conventional cyclic spectrum estimation methods require front-end components capable of high rate sampling. In contrast, in this work, the detection problem is addressed by using a low rate sampling device to capture sub-Nyquist samples. Another advantage of CS-FAM is that perform-ing multiuser detection in the first step eliminates the effect of signal superposition in the multiuser cyclic spectrum, whereas conventional methods require an additional signal separation process. (iii) Due to the use of power spectrum estimation, the multiband signal de-tection process is robust, compared to other methods based on signal recovery from compressive sampling, which are sensitive typically to noise. For example, the power spectrum blind sampling (PSBS) method used in [9] and [10] demonstrated poor estimation performance in inactive bands, which also led to high complexity in matrix operations. (iv) The process of CS-FAM is flexible in regards to practical application. Multiuser detection is achieved in only one step and, based on the results of the
first step, parameter estimation is accomplished in the sec-ond step by searching for the peaks in the cyclic spectrum rather than by setting a threshold.
The rest of the paper is organized as follows: Section 2 provides the system model along with the FAM algo-rithm and compressive sampling framework. CS- FAM is then developed within the framework of FAM. Signal detection is addressed in Section 3. A simple signal re-covery algorithm, simultaneous orthogonal matching pursuit (SOMP) is employed for multiband detection. A vector indicating the power distribution of the analog input is then computed from the iteration of SOMP. Following this, active sub-bands are identified using a constant false-alarm detector, and multiuser detection is achieved using a bandwidth constraint. If the signal is reconstructed, the second step of CS-FAM, cyclic fea-ture detection, can be performed. Simulations are pre-sented in Section 4 to demonstrate the detection performance of this scheme, followed by a summary in Section 5.
2 System model
Modulated signals have a built-in periodicity, which is characterized as cyclostationary [24]. The auto-correlation function Rx(t,τ) =E{x(t)∗x(t+τ)} (* is the complex
conju-gate operator), which is periodic in the time domain with a periodT0, is given by
RxðtþT0;τÞ ¼Rxðt;τÞ: ð1Þ
The cyclic auto-correlation function (CAF) is repre-sented in terms of Fourier coefficients as
Rαxð Þ ¼τ 1 T0
Z T0=2
−T0=2
Rxðt;τÞe−j2παtdt; ð2Þ
where α≜{k/T0}k∈ℤrepresents the cyclic frequencies. The SCF is defined by
Sαxð Þ ¼f
Z∞
−∞
Rαxð Þτ e−i2πfτdτ: ð3Þ
Wide-sense stationary signals can be detected from stationary interference because general stationary signals do not possess cyclic stationary characteristics. The ad-vantage of cyclostationary feature detection lies in its ability to separate the signal of interest (SOI) from noise and interference in the spectral correlation plane, mak-ing it well suited for modulation recognition and param-eter estimation.
sampling, we will introduce the FAM algorithm and com-pressive sampling framework first.
2.1 The FAM algorithm
Compared to other methods used to estimate SCF, time smoothed algorithm is computationally efficient for general cyclic spectral analysis [22]. Based on the time smoothed cyclic periodogram, the parameter estimation is calculated with a data tapering window of the lengthTsliding over the data for a time span ofΔtandΔt=N′Ts(N′is the length
with the discrete Fourier transform (DFT). The cyclic peri-odogram [25] is defined as
Sαxðn;fÞ ¼XTðn;f1ÞX
Tðn;f2Þ; ð4Þ where f= (f1+f2)/2 and α=f2−f1. XT(n, f) denotes a
complex demodulator, which is expressed as
XTðn;fÞ ¼ complished by using a Hamming window. The limited cyclic spectrum with the discrete-time span of N' is de-fined in terms of the time smoothed cyclic periodogram as
Sαxðn;fÞN0¼ implementation based on time smoothed cyclic periodo-gram is illustrated in Figure 2. As shown in [25] and [26], if the time windowsw(n) andg(n) are properly nor-malized, the time smoothed cyclic periodogram con-verges to the cyclic spectrum in the limit as follows:
lim
Δf→0Nlim0→∞S
α
xðn;fÞN0 ¼Sαxð Þf : ð7Þ
In order to obtain a substantial reduction in random ef-fects using a time-smoothed approach, the time-spectrum resolution product must significantly exceed unity
ΔtΔf >>1: ð8Þ
Thus, substantial observation time is needed to obtain a reliable SCF estimate, where a smaller spectral reso-lution is required to resolve the individual features of the SCF. The output filterg(n) is not as crucial as the in-put filterw(n). Therefore, for simplicity, g(n) is taken to be a rectangular window, as is commonly done in FAM algorithms. The computational efficiency of (6) can be improved by decimating the outputs of the filter w(n). With a decimating factorD, (6) is modified to
SαxðDn;fÞN0 ¼ place afterD-decimation [27-29]. Since the outputs of chan-nelization are oversampled by a factor of N, the sampling rate can be reduced to fs/D, D≤N before aliasing occurs
[22,28]. The effects of these parameters on the FAM algo-rithm are analyzed in [22], which discusses resolution, reli-ability, and computation reduction. In this paper, we have selected D=N to satisfy the compressive sampling frame-work expressed by (12). However, the filter is always not ideal. Then, the leakage will influence the estimation per-formance. While the selection D=N leads to a slight in-crease in cycle leakage, it significantly reduces complexity. Considering the frequency shifting of the production se-quence fromαtoα+qΔα, whereqis an integer, (9) becomes
Here, fl and fkare the frequency values in correlating
two spectral components. The FAM estimate computed in (10) corresponds to α= (fl−fk) and fj= (fl+fk)/2. The
dimensionαdescribes the cyclic frequency and the reso-lution Δα=fs/N'. The FAM is a computationally efficient
algorithm by adoptingN-point FFT operation to (5) after decimating andL-point FFT to (10), respectively.
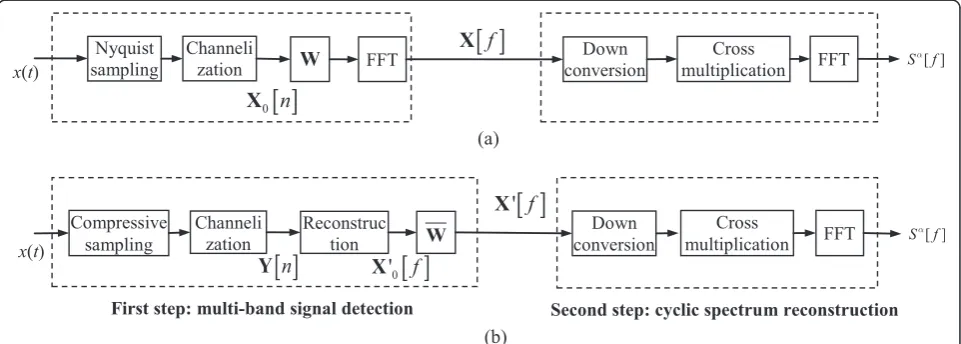
Figure 3a presents a block diagram of the FAM algo-rithm. The first step includes channelization using data tapering and theN-point FFT operation. Data channeli-zation divides the input x[n] into L segments where the size of each segment isN. The complex demodulator of (5) after decimating is computed by theN-point FFT op-eration in the first step of Figure 3, which is derived as
X½ f NL¼FWX0½ n
¼ FW F −1FX0½ n
¼WX 0½ f ;
ð11Þ
wherenandfdenotes the data is expressed in the time domain and in the frequency domain, respectively. F is theN-points of the DFT matrix andF(i,j)= [e−j2πij/N].X0 [f] =FX0[n].W ¼FWF−1 andF−1is theN-points of the IDFT matrix.Wis a diagonal matrix whose diagonal
ele-ments are determined from the N-point Hamming
win-dow. X0[n] is the data matrix of size N×L, which is
generated from x[n] using channelization. x[n] is the digital signal from the Nyquist sampling.
There are three operations in the second step of FAM as shown in Figures 2 and 3. The complex demodulators are downshifted in frequency to baseband by down conversion. The SCD function is then estimated by multiplying its com-plex conjugate. The second FFT is a smoothing operation, which is executed by L-point FFT. More details on this process are given in [22,24-26]. In this paper, the proposed method is based on the framework of FAM from sub-Nyquist samples as presented in Figure 3b. The process of obtainingX0[f] from compressive samples in the first step of CS-FAM is discussed in following section, while the merits of CS-FAM's second step are presented in Section 3.2.
2.2 Compressive sampling
According to compressive sampling theory, a small amount of signal data obtained through inner-product operations can be used to reconstruct the original signal with overwhelming accuracy [5,6]. The holy grail of compressed sampling is an acquisition device that ex-ploits signal structure in order to reduce the sampling
rate. An example of this is the analog-to-information converter (AIC) [30], which is used in place of the ADC in the front-end of a sampling device. As illustrated in Figure 3b, using an AIC, the output from compressive sampling is expressed as
Y½ ¼n AX0½ n; ð12Þ
where A is a measurement matrix of the size M×N
(M<N), the elements of which are randomly selected. A measurement matrix obeying the restricted isometry prop-erty (RIP) in [6] can be used for CS-FAM (e.g., Gaussian random matrix or ±1 distribution matrix obeys the RIP with high probability). In this paper, the elements are se-lected from {−1, 1}, which facilitates hardware implemen-tation by using integrate-and-dump processes [31]. The average sampling rate is equal to the Nyquist rate multi-plied byM/N.Fis invertible. Therefore, we can have
Y½ ¼n AF−1FX0½ n
¼ΦX0½ f ;
ð13Þ
where Φ=AF−1. The output of the first step in CS-FAM is derived by X0½ ¼f WX 00½ f from (11) as illus-trated in Figure 3b. X0′[f] is the sparse approximate matrix of X0[f], which is recovered from compressive samples Y[n] and only contains the signal in active bands.X0′[f] is computed in Section 3.2.
3 Joint signal processing from compressive samples In this article, multiband detection and parameter extraction are performed in the frequency domain. The process of signal reconstruction using the MMV model will be introduced first. Due to the sparsity of
wideband signals, only a few rows of X0[f] contain
large values, denoted as signals with additive noise. In the other rows, where only noise is present, the
values are very small. In this study, we let K be the
number of rows where the signal is present in X0[f],
and the value of K is small because there are only a
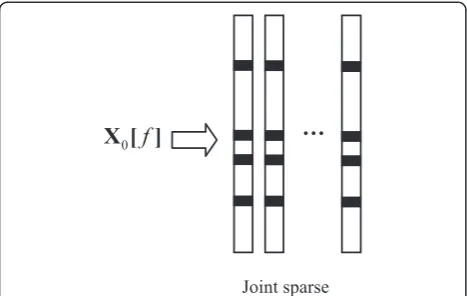
few active sub-bands in the whole frequency range. This has given rise to the problem of sparse signal recovery using the MMV model [31] to analyze joint row sparsity, as shown in Figure 4 and which will be addressed below. However, it has been shown that signal recovery rate is greatly increased by using the MMV rather than the single measurement vector (SMV) model. The results in [32-34] reveal the ad-vantages of the MMV model, including the key assumption that the support (i.e., the indexes of the signal entries) is identical in every column of X0[f].
The literature also endorses increasing L for better
recovery performance.
Many effective algorithms have been proposed for solving the MMV problem, such as convex relax-ation methods using mixed norms, greedy search mechanisms, and sparse Bayesian learning. Com-pared to other methods, the algorithms based on greedy search mechanisms have the advantageous
characteristic of low complexity. Therefore, we
selected the simple algorithm SOMP [35], which has proven that under certain conditions, the OMP algorithm can find the sparsest representations from the MMV model with computational efficiency. The
SOMP algorithm is modified in this paper as
follows:
where (.)T denotes the matrix (or vector) transpose and Φk is the k-th row of Φ. X is used to obtain the sparse approximate matrixX0′[f] in Section 3.2. The it-eration timeslshould be larger thanK. IfKis unknown,
l should be chosen such that it is sufficiently large. To distinguish between signal and noise measurements, in this paper, the thresholdλkis computed by (23).
in Φ is found in step 2 of SOMP, ΦT kRi−1
indicates
the value of ‖Xk‖, where ‖Xk‖ is the k-th row in X.
Therefore, it is possible to use d to identify the active sub-bands using a technique that is similar to the peri-odogram method, as shown in Figure 5b.
3.1 Multiband signal detection from compressive samples IfMis large enough (M> 2Kis an empirical condition for
SOMP), X is accurately recovered by SOMP with high
signal-to-noise ratio (SNR). Constant false-alarm rate en-ergy detection is employed for multiband detection using the periodogram method [36]. The decision statistic for energy detection in thek-th row ofXis
~
d k½ ¼1 L
XL−1
l¼0 Xð Þk;l
2
k¼1;2;…;N
ð Þ; ð14Þ
whereX(k,l)is the (k,l)-th element inX. In the follow-ing, the detection model is represented by
H0: d~0¼n0 signal absent
H1: d~1¼sþn0 signal present;
ð15Þ
wheresis signal sample, andn0is circular complex zero-mean Gaussian independent and identically distributed
(i.i.d.) noise with a variance ofσ2. With this model, d~0 is the sum of the squares ofL independent identically dis-tributed zero-mean Gaussian random variables. Therefore, the model produces a random variable using a chi-squared distribution that has L degrees of freedom. To achieve predefined sensing performance, the sample frame numberLis always large. Therefore, we can use the cen-tral limit theorem to approximate d~0 as the Gaussian function
~
d0∼CN σ2;
2σ4 L
: ð16Þ
A binary hypothesis test is then formulated using a de-cision rule, resulting in
H0: d k~½ <λ
H1: d k~½ ≥λ:
ð17Þ
The thresholdλ is chosen according to a target false-alarm probability PFAwherePFA¼Pr d~>λjH0g
and is given by
λ¼ 1þ
whereQ(.) stands for the tail probability of the Gaussian distribution
However, it must be noted that the recovery perform-ance of compressive sensing is sensitive to the number of sampling branches and to the SNR [37]. When M < 2Kor the noise level is large,Xcannot be accurately re-covered by SOMP and errors may be introduced intod~ , as illustrated in Figure 5a. Performance is even worse if the SNR < 0 dB. Therefore, in our scheme, we employ
the vector d from SOMP as the input to ensure testing
accuracy. The approximate value of the residualRiis
ob-tained using steps 4 to 6 of SOMP.
Ri¼BX; ð20Þ
Bis a submatrix ofΦ by removing the columns same
withS(Sis derived from SOMP algorithm). Then,
d k½ ¼ΦTkBX2; ð21Þ
where Φkis the k-th column ofΦ. The correlation be-tween two different columns of the sampling matrix is weak, i.e., ΦTkΦk≫ΦkTΦk′ (k′≠k), which satisfies the basic RIP condition for compressive sampling [6]. The element inAis selected from {1,−1}, so the sign of the
el-ements in Φ is usually random and ΦT
kΦk′ is close to
. The threshold of decision statisticd[k] is
λk¼ 1þ
Taking this into account, the binary hypothesis test (16) is rewritten as
H0: d k½ <λk
H1: d k½ ≥λk: ð24Þ In a multiuser network, a single user signal usually oc-cupies successive frequency bands in high-resolution spectrums. Therefore, d can be divided into Ng groups
where the length ofi-th group isbi, the number of users
is Ng, and thei-th user occupies bandwidthBi. To
elim-inate false spurs in the decision results with the thresh-old (23), a multiband signal bandwidth constraint is given by
wherebmw is minimum frequency bin andbmiis
mini-mum interval frequency bin. bmw
N fs is minimum
band-width of a user andbmi
Nfsis minimum bandwidth interval
between two adjacent users.
3.2 Cyclic spectrum estimation
Another objective of the SOMP algorithm is to recon-struct X0[f], which involves signal recovery from com-pressive samples in the frequency domain. However, using CS-FAM for signal detection differs from using the SOMP algorithm. SOMP directly assigns X0[f] = X,
where X is the output of SOMP. In contrast, according
to the first step of CS-FAM, the row index ofX0[f] indi-cating only the presence of signal is known. The sparse approximate matrixX0' [f] is computed by
X00½ ¼f argminXkY−XΦ0k
s:t: Xk¼01L; k∈V:
ð26Þ
Xkis thek-th row ofX, the elements of which are set to
zero, as it indicates only the presence of noise.Φ' is the submatrix ofΦwith removing the columns whose indexk
supports k∈V. The element of set Vare defined by (24) as the row index of k, s.t. d[k] <λk. Equation (26) is
then solved using the least square (LS) method assuming
M>K. It is obvious that if the iteration of SOMP algo-rithm is ended by the termination condition of d[k] <λk,
we can haveX0' [f] =X, whereX is the output of SOMP.
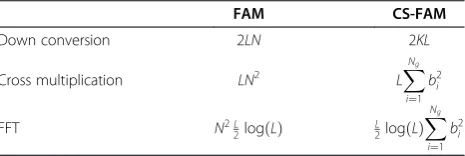
Table 1 Operation complexity of the second step
FAM CS-FAM
Down conversion 2LN 2KL
Cross multiplication LN2 LX
If the approximate matrix X0' [f] is obtained, cyclic spectrum estimation is processed in the second step. Cyc-lic feature detection in CS-FAM aims to extract parame-ters rather than to merely detect whether a signal is present or not.
The complexity of the second step is greatly reduced be-cause onlyKrows are nonzero following (26). Compared
to FAM, which is used to estimate the whole span of the spectrum, CS-FAM computes solely the occupied fre-quency regions of each user. The operation complexity of cyclic spectrum estimation in the second step is illustrated
in Table 1. Due to X
Ng
i¼1
bi¼K≪N, this complexity of the
second step is substantially reduced.
Different modulation formats result in different type of spectral peaks. The pairs of the peaks exhibited by for some common digital modulations [38] are summarized in Table 2, where fc is carrier frequency and 1/Tb is
symbol rate. If the occupied frequency areas have been identified in the first step, the peaks can be detected in the second by searching within the support range rather than by setting a threshold with the allowable false-alarm rate. For example, if a user with band of (fc−fa,fc
Table 2 Peak pairs of digital modulation
Modulation Peak pairs (f,α)
BPSK fc;1T
, (0, 2fc), 0;2fc1T
MSK fc;1T
, 0;2fc1T
AM (0, 2fc)
QAM fc;T1
+fa) is detected from the first step of CS-FAM, the
sup-port range of its cyclic spectrum [24] is given by
Sαzð Þ ¼f
(0 jj jf −jα=2jj≤f
c−fa or
f
j j þjα=2j
j j≤fcþfa Sαxð Þf otherwise
:
ð27Þ
Once the peaks are obtained, modulation classifica-tion is performed. Some literature on the subject of automatic modulation classification based on cyclic spectrum analysis is summarized in [39]. The symbol rate and carrier frequency are obtained after the modulation format is identified. Because CS-FAM separates multi-signals in the first step, the multiuser cyclic spectrum reconstruction problem of conventional
methods becomes simply multiple operations of a single user problem, avoiding signal separation from the whole cyclic spectrum. Performing multiuser detection in the first step of CS-FAM also avoids cyclic spectrum super-position of different users, which may lead to false peaks.
4 Detection performance and simulation results In this section, we demonstrate the performance cap-acity of the proposed method with performance test re-sults. In Section 4.1, we examine multiband signal detection performance from compressive samples, as-suming that the received signals contain only zero-mean Gaussian i.i.d. noise. Section 4.2 is dedicated to examin-ing cyclic spectrum estimation performance.
4.1 Multiband signal detection performance
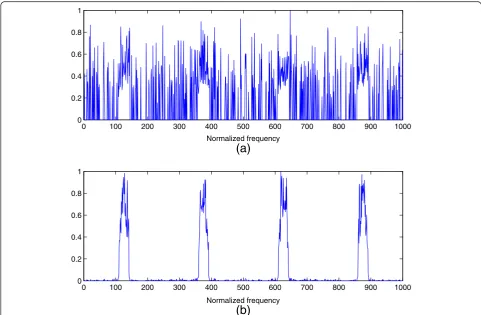
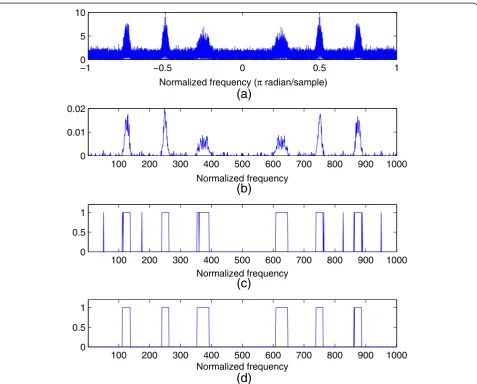
The process of multiband detection using CS-FAM is il-lustrated in Figure 6. The analog input content was pro-vided by three binary phase shift keying (BPSK) modulated signals,N= 1,000,M= 400, andL= 50, shaped by a raised-cosine filter. Figure 6a shows the spectrum of the received signals, which were transmitted through the additive Gaussian white noise (AWGN) channel. The SNR was 0 dB. The normalized frequency in Figure 6b, c, d is presented with the resolution offs/N, wherefsis the
sam-pling frequency. The result ofd, computed by the SOMP algorithm, is presented in Figure 6b. We then applied the constant false-alarm detector with PFA= 0.05. The signal detection results are shown in Figure 6c, where it can be seen that the false-alarm detector identified a number of false spurs. Figure 6d presents the final detection results following elimination of false spurs using a bandwidth constraint of bmw=bmi= 2. All of the active sub-bands
were detected and all three users identified.
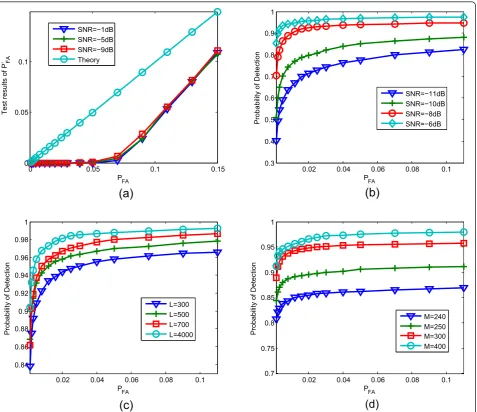
An evaluation of the performance of the CS-FAM test is shown in Figure 7. The reference line ofTheoryin Fig-ure 7a was set by P'FA=PFA, so it presents as a diagonal line. Because using the bandwidth constraint eliminated some of the false spurs, the probability of false-alarm occurrence was lower in the test than in the theoretical
value computed by (23). In addition, the rate of false-alarm occurrence using CS-FAM was identical under various noise levels.
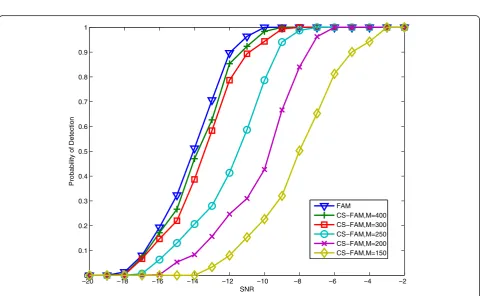
Detection performance of the test is presented in Figure 7c, d. The multiband signal contained two BPSK modulated signals. The main lobe of each signal occu-pied the spectrum from−0.032πto 0.032πin the base-band. The threshold was set by (23) according to the target false-alarm rate. Figure 7b shows the detection performance under different noise levels, illustrating that the detector demonstrates better performance in higher SNR scenarios. The quality of detection is improved by increasing sensing time, as shown in Figure 7c. However, the results also show that this effect is limited when Lis very large. Detection performance with various compres-sion ratios is shown in Figure 7d, which indicates that the ratios are improved by increasing the number of sampling branches.
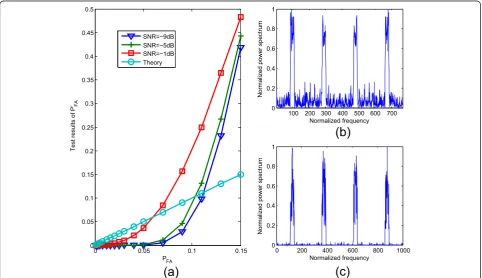
As mentioned before, the CS-FAM multiband detec-tion method is based on power spectrum estimadetec-tion. Therefore, a comparison between CS-FAM and PSBS [9,10] is presented in Figure 8. As illustrated in Figure 8a, the probability of false alarms in the test was higher when using PSBS than when using CS-FAM, meaning that the PSBS method has poor estimation performance
Figure 9Cyclic feature detection by CS-FAM. (a)Cyclic spectrum estimation based on FAM from the Nyquist samples.(b)The whole cyclic spectrum estimation by CS-FAM without multiuser detection.(c-d)Two different BPSK signals are separated by CS-FAM with multiuser detection.
in the inactive bands where there is no signal. This shortcoming is clearly shown in Figure 8b. Compared to the PSBS method, CS-FAM identifies a wide dispar-ity between signals and noise, as shown in Figure 8c, which is advantageous for signal detection using a threshold. Another drawback of PSBS is that the size of the matrix used in this method is proportional to 3M2× 3N, so the values of M and N chosen for PSBS were much smaller than those selected for CS-FAM, as
shown in Figure 8. When using PSBS, a largeM value
leads to high complexity, which further demonstrates that the PSBS method is not suitable for high spectral resolution sensing.
4.2 Cyclic spectrum estimation performance
Cyclic spectrum estimation is performed in the second step of CS-FAM, assuming that the active sub-bands have been detected in the first step. Here, we discuss the application of cyclic spectrum estimation from compressive samples. In the following tests, BPSK signals that exhibited spectral peaks at several (f,α) pairs in the cyclic spectrum were se-lected for analysis. The results showed that three distinct peaks are present at (fc, 1/Tb), (0, 2fc), and (0, 2fc± 1/Tb).
From these spectral peaks, the carrier frequency, symbol rate, and modulation format can be obtained.
The results of cyclic spectrum estimation using com-pressive samples are presented in Figure 8. In this test, the analog input contains two BPSK signals and the
power of the weaker signal was one quarter that of the larger one. The carrier frequencies of the weaker and stronger signals were f1= 3 kHz and f2= 7.1 kHz,
re-spectively, where N= 660 and M= 160. Contour graphs
of the estimation results are given in Figure 9. As Figure 9a shows, the cyclic spectrum of the two BPSK signals exhibits special peaks when using the FAM method with the Nyquist sampling. A similar estimation result is obtained using CS-FAM (from compressive samples without multiuser detection in the first step) is shown in Figure 9b. The number of the areas with a large magnitude was 16, including eight false areas yielded by the superposition of the two signals. Figure 9c, d presents the cyclic spectrum estimation results of each signal using CS-FAM with multiuser detection. The signal was correctly identified by the CS-FAM method, as shown in Figure 9c, d, whereas the FAM method failed to identify the peaks of the weaker signal, as shown in Figure 9a. Using FAM, a complex separating operation was required to identify the weaker signal correctly. In contrast, using the CS-FAM scheme, the smaller signal is separated during the first step and is not masked by the larger one.
In the next experiment, we examined the cyclic feature de-tection performance of CS-FAM using different compressive ratios. Three BPSK signals with different carrier frequen-cies were selected as analog inputs. A simple binary hy-pothesis test statistic was employed by
H0 : U0≠U format is not identified
H1 : U0¼U format is identified; ð28Þ
where U is the reference set of a modulated signal
from Table 2, i.e., U= {(fc, 1/Tb), (0, 2fc), (0, 2fc± 1/Tb)} if
the input is a BPSK signal.U' is the set composed of the detected peaks. This matching decision method is stric-ter than the approaches used in [39] because the goal is to demonstrate cyclic spectrum estimation performance rather than signal classification. The resulting U' set contained four detected peaks for the BPSK signals. Figure 10 shows the symbol rates of the three BPSK sig-nals, which were 5fs/N, N= 500, and L= 48. To
recon-struct the cyclic spectrum with an order similar to N×
N, the methods in [20] require matrices proportional to (500)4, which is unacceptable for common devices. It is clear that, when using CS-FAM, estimation quality improves with compressive ratio and that it converges towards the Nyquist rate obtained using FAM.
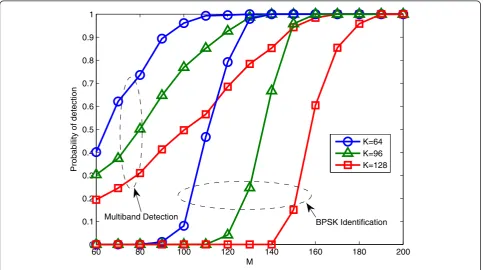
In Figure 11, a BPSK signal is selected with different bandwidth, indicated byK. SNR = 0 dB andN= 500. The process of cyclic spectrum estimation requires more sampling branches than multiband detection does. Therefore, if the second step is operated effectively, the assumption of the active bands been detected is stated for (26). In addition, the results indicate that both of the steps require more sampling branches to maintain high performance when the wideband signal is less sparse.
5 Conclusions
This paper has introduced a joint scheme for low complex-ity cyclic spectrum estimation and robust multiband signal detection method based on compressive sampling. The process is divided into two steps. First, active sub-bands are identified from MMVs using joint sparse recovery and multiuser detection is performed using a bandwidth con-straint. The proposed multiband detection method demon-strates striking robustness with sampling rate reduction and noise uncertainty. In the second step, the cyclic spec-trums of each user are individually reconstructed. We also examine signal identification performance under different sampling rates and noise levels. The flexible nature of this scheme, accomplishing multiband and multiuser detection in its first step and parameter extractions in its second, al-lows for implementation in many practical applications.
Competing interests
The authors declare that they have no competing interests.
Acknowledgements
This work was supported by the Shanghai Provincial Natural Science Foundation of China under Grant No. 14ZR1447200, and the National Defense Foundation of China under Grant No. 9140C18010211Zxxx01 and No.9140C1801021xxx18. The authors also thank the anonymous reviewers and the editor for their valuable comments.
Received: 6 October 2014 Accepted: 17 November 2014 Published: 10 December 2014
References
1. L Neng-Jing, Z Yi-Ting, A survey of radar ECM and ECCM. IEEE Trans. Aero Electron Syst.31(3), 1110–1120 (1995)
2. JA Lopez-Salcedo, JAD Peral-Rosado, G Seco-Granados, Survey on robust carrier tracking techniques. Commun. Surv. Tutor. IEEE16(2), 670–688 (2014) 3. E Axell, G Leus, EG Larsson, HV Poor, Spectrum sensing for cognitive radio:
state-of-the-art and recent advances. IEEE Signal Process. Mag.29(3), 101–116 (2012) 4. H Sun, A Nallanathan, C-X Wang, Y Chen, Wideband spectrum sensing for
cognitive radio networks: a survey. IEEE Wirel. Comm. Mag.20(2), 74–81 (2013) 5. RG Baraniuk, Compressive sensing [lecture notes]. IEEE Signal Process. Mag.
24(4), 118–121 (2007)
6. S Foucart, H Rauhut,A Mathematical Introduction to Compressive Sensing
(Springer, Boston, 2013)
7. M Mishali, YC Eldar, Blind multiband signal reconstruction: compressed sensing for analog signals. IEEE Trans. Signal Process.57(3), 993–1009 (2009) 8. O Mehanna, ND Sidiropoulos, Frugal sensing: wideband power spectrum
sensing from few bits. IEEE Trans. Signal Process.61(10), 2693–2703 (2013) 9. G Leus, DD Ariananda, Power spectrum blind sampling. IEEE Signal Process
Lett.18(8), 443–446 (2011)
10. DD Ariananda, G Leus, Compressive wideband power spectrum estimation. IEEE Trans. Signal Process.60(9), 4775–4789 (2012)
11. Y Miar, C D'Amours, T Aboulnasr, A novel reduced power compressive sensing technique for wideband cognitive radio. EURASIP J. Wirel. Commun. Netw.2012(1), 281 (2012)
12. J Unnikrishnan, VV Veeravalli, Algorithms for dynamic spectrum access with learning for cognitive radio. IEEE Trans. Signal Process.58(2), 750–760 (2010) 13. A Bourdoux, D Cabric, G Ferrari, F Horlin, Z Tian, Dynamic spectrum access:
from the concept to the implementation. EURASIP J. Wirel. Commun. Netw. 2010(1), 654395 (2010)
14. D Noguet, L Biard, M Laugeois, Cyclostationarity detectors for cognitive radio: architectural tradeoffs. EURASIP J. Wirel. Commun. Netw.2010(1), 526429 (2010)
15. OA Dobre, A Abdi, Y Bar-Ness, W Su, Survey of automatic modulation classification techniques: classical approaches and new trends. Commun. IET1(2), 137–156 (2007)
16. Z Sun, R Liu, W Wang, Joint time-frequency domain cyclostationarity-based approach to blind estimation of OFDM transmission parameters. EURASIP J. Wirel. Commun. Netw.2013(1), 117 (2013)
17. H Bolcskei, Blind estimation of symbol timing and carrier frequency offset in wireless OFDM systems. IEEE Trans. Commun.49(6), 988–999 (2001) 18. D Cohen, E Rebeiz, V Jain, YC Eldar, D Cabric, Cyclostationary feature
detection from sub-nyquist samples, in4th IEEE International Workshop (2011)(IEEE, New York, USA, 2011), pp. 333–336
19. E Rebeiz, V Jain, D Cabric, Cyclostationary-based low complexity wideband spectrum sensing using compressive sampling, inCommunications (ICC)
(IEEE International Conference, IEEE, Ottawa, Canada, 2012), pp. 619–1623 20. Z Tian, Y Tafesse, BM Sadler, Cyclic feature detection with sub-Nyquist
sampling for wideband spectrum sensing. IEEE J Sel Top Signal Process 6(1), 58–69 (2012)
21. L Safatly, B Aziz, A Nafkha, Y Louet, Y Nasser, A El-Hajj, K Kabalan, L Safatly, B Aziz, A Nafkha, Y Louet, Y Nasser, A El-Hajj, K Kabalan, Blind spectrum sensing using symmetry property of cyclic autocorrelation function: from theory to practice. EURASIP J. Wirel. Commun. Netw.2014(1), 26 (2014) 22. RS Roberts, WA Brown, HH Loomis, Computationally efficient algorithms for
cyclic spectral analysis. IEEE Signal Process. Mag.8(2), 38–49 (1991) 23. AB MacKenzie, JH Reed, P Athanas, CW Bostian, RM Buehrer, LA DaSilva, SW
Ellingson, YT Hou, M Hsiao, J-M Park, C Patterson, S Raman, C da Silva, Cognitive radio and networking research at Virginia Tech. Proc. IEEE 97(4), 660–688 (2009)
24. WA Gardner, Exploitation of spectral redundancy in cyclostationary signals. IEEE Signal Process. Mag.8(2), 14–36 (1991)
25. WA Gardner,Statistical Spectral Analysis: A Nonprobabilistic Theory(Prentice-Hall, Englewood Cliffs, NJ, 1987)
26. RS Roberts, WA Brown Jr, HH Loomis,Cyclostationarity in Communications and Signal Processing(IEEE Press, Boston, 1994), pp. 455–479
28. L Izzo, A Napolitano, Multirate processing of time series exhibiting higher order cyclostationarity. IEEE Trans. Signal Process.46(2), 429–439 (1998) 29. A Sony, PP Vaidyanathan, Bifrequency and bispectrum maps: a new look
at multirate systems with stochastic inputs. IEEE Trans. Signal Process. 48(3), 723–736 (2000)
30. S Kirolos, J Laska, M Wakin, M Duarte, D Baron, T Ragheb, Y Massoud, R Baraniuk, Analog-to-information conversion via random demodulation, in
Design, Applications, Integration and Software, 2006 IEEE(CAS Workshop, Dallas, 2006), pp. 71–74
31. M Mishali, YC Eldar, Wideband spectrum sensing at sub-Nyquist rates [applications corner]. IEEE Signal Process. Mag.28(4), 102–135 (2011) 32. SF Cotter, BD Rao, K Engan, K Kreutz-Delgado, Sparse solutions to linear
inverse problems with multiple measurement vectors. IEEE Trans. Signal Process.53(7), 2477–2488 (2005)
33. YC Eldar, M Mishali, Robust recovery of signals from a structured union of subspaces. IEEE Trans. Inform. Theor.55(11), 5302–5316 (2009)
34. J Chen, X Huo, Theoretical results on sparse representations of multiple-measurement vectors. IEEE Trans. Signal Process.54(12), (2006) 35. JA Tropp, AC Gilbert, MJ Strauss, Algorithms for simultaneous sparse
approximation. Part I: greedy pursuit. Signal Process.86(3), 572–588 (2006) 36. H Urkowitz, Energy detection of unknown deterministic signals. Proc. IEEE
55(4), 523–531 (1967)
37. S Oymak, MA Khajehnejad, B Hassibi, Recovery threshold for optimal weight l1 minimization, inInformation Theory Proceedings (ISIT), 2012 IEEE International Symposium(IEEE, Cambridge, USA), pp. 2032–2036
38. WA Gardner, W Brown, C-K Chen, Spectral correlation of modulated signals: part II-digital modulation. IEEE Trans. Comm.35(6), 595–601 (1987) 39. B Ramkumar, Automatic modulation classification for cognitive radios using
cyclic feature detection. IEEE Circ. Syst. Mag.9(2), 27–45 (2009)
doi:10.1186/1687-1499-2014-218
Cite this article as:Panet al.:Joint multiband signal detection and cyclic spectrum estimation from compressive samples.EURASIP Journal on Wireless Communications and Networking20142014:218.
Submit your manuscript to a
journal and benefi t from:
7 Convenient online submission
7 Rigorous peer review
7 Immediate publication on acceptance
7 Open access: articles freely available online
7 High visibility within the fi eld
7 Retaining the copyright to your article