R E S E A R C H
Open Access
Energy efficiency of compressed spectrum
sensing in wideband cognitive radio
networks
Qi Zhao
1*, Zhijie Wu
2and Xiaochun Li
1Abstract
In cognitive radio networks, wideband spectrum sensing (WSS) has been advocated as an effective approach to increase the spectrum access opportunity of the secondary users. On the other hand, because of the increase of sampling rate and sensing time duration cost by the analog-to-digital converter (ADC), energy saving has been a significant problem for WSS. In this paper, taking advantage of the frequency-domain sparsity of the wideband spectrum, a WSS scheme combining compressed sensing and multi-band joint detection technique is proposed to reduce the energy consumption. Based on extensive analysis and simulation, we identify the sparsity order of the wideband spectrum, the received signal-to-noise ratio (SNR) of the primary signal, and the compression rate employed in sampling as three key factors that affect the sensing performance. In particular, we derive a closed-form analytical model of the scheme. Based on these observations, the energy efficiency, defined as the ratio of the spectrum access opportunity to the energy consumption, is maximized through the optimization process of the compression rate under the sensing performance constraints. We also indicate the uniqueness of the optimal compression rate for maximizing the energy efficiency. Numerical and simulation results show that our proposed scheme is more energy efficient if the wideband spectrum is sparser in the frequency domain.
Keywords:Cognitive radio network, Distributed cooperation, Spectrum allocation, Random broadcast
1 Introduction
In cognitive radio networks (CRNs), the secondary users (SUs) can opportunistically access the spectrum bands unoccupied by the primary users (PUs). As a key tech-nology in CRNs, spectrum sensing is widely used by SUs to periodically detect the spectrum bands. It is well known that the greater the bandwidth of the spectrum being detected, the more opportunity for SUs to access. Therefore, wideband spectrum sensing (WSS) [1, 2] is attracting attention as an effective approach for detect-ing continuous multiple bands simultaneously. Since WSS can be easily performed in local sensing, i.e., it can be implemented by any SU independently, the commu-nication overhead for network coordination can be greatly reduced. Hence, WSS is suitable for large-scale CRNs with quite a lot of SUs.
On the other hand, the increasing energy consumption has been a significant problem for WSS [1, 3]. The en-ergy consumption in the spectrum sensing is mainly caused by the analog-to-digital converter (ADC), which is proportional to the sensing time duration and the sampling rate [1]. However, because of the wide range of the spectrum bandwidth for WSS, long sensing time duration and high sampling rate are always needed by the ADC. There are two kinds of the traditional WSS schemes, the sequential sensing scheme [1, 3] and the parallel multi-band detection scheme [4]. Originally, constrained by the low sampling rate of ADCs, SU di-vides the wideband spectrum into multiple sub-bands and then detects them successively, namely the sequen-tial sensing scheme. As the high-speed sampling tech-nique develops, SU can directly sample the wideband spectrum using a high-speed ADC and then detect all the sub-bands simultaneously, namely the parallel multi-band detection scheme. Compared with the sequential sensing scheme, the structure of the parallel multi-band * Correspondence:[email protected]
1School of Electronic Information Engineering, Beihang University, Beijing 100191, China
Full list of author information is available at the end of the article
detection scheme is more convenient for WSS. Further-more, the parallel multi-band detection scheme is more energy efficient by improving the sampling rate to shorten the sensing time duration.
In practice, the wideband spectrum is divided into sev-eral non-overlapping narrowband channels assigned to different PUs, and the emergence of different PUs’signal is entirely independent. Therefore, only a minority of channels are occupied by PUs at the same time, namely that the wideband spectrum is sparser in the frequency range. Taking advantage of such sparsity of wideband spectrum, compressed sensing (CS) has recently been proposed to reduce the sampling rate below the Nyquist rate [5–11]. For this reason, the CS-based spectrum sensing methods have been proposed as an efficient ap-proach for energy saving in WSS.
Tian and Giannakis introduced two kinds of com-pressed sensing methods (called multi-step and one-step) to recover the signal by wavelet approach [5] and then developed the signal recovery idea and performed the distributed compressive spectrum sensing in the co-operative multi-hop CRNs [6]. However, for spectrum sensing and detection, accurately reconstructing the original signal is unnecessary. Following this idea, Polo et al. presented a compressive wideband spectrum sensing scheme by sampling the analog signal using analog-to-information convert and then focused on the performance of edge spectrum and power spectrum density recovery [7]. The authors in [8, 9] also suggested to only reconstruct the signal’s power spectrum, in order to optimize the sensing performance at the expected probabilities of detection and false alarm. As well known, the final purpose of spectrum sensing is to find the spectrum access opportunities for SUs [1, 5]. Based on this point, all the aforementioned methods, aiming at the signal reconstruction performance in [5, 6] or the sensing performance in [7–9], give no considerations to the optimization problem of the spectrum access oppor-tunity. In this paper, we have a further study on this problem, combining the challenge of energy consump-tion in WSS. We propose a reconstrucconsump-tion structure aiming at optimizing the energy efficiency, which is de-fined as the ratio of SU’s spectrum access opportunity to the energy consumption.
The proposed design includes (i) a sensing scheme combining the compressed sensing and the multi-band joint detection, (ii) the establishment of an analytical model of the scheme, and (iii) the optimization of the compression rate for energy efficiency maximization under the sensing performance constraints. The contri-butions of this paper can be generalized as follows.
In comparison with the traditional WSS schemes, the proposed scheme reduces the sampling rate at the sub-Nyquist rate and takes a shorter sensing time duration,
both of which are greatly favorable to energy saving. Nu-merical and simulation results show that the perform-ance of energy saving is better if the wideband spectrum is sparser in the frequency domain.
Although the compressed sensing has been suggested to reduce the sampling rate in WSS, the energy effi-ciency and the optimization of compression rate have never been considered. However, our study indicates the uniqueness of the optimal compression rate for maxi-mizing the energy efficiency.
Furthermore, lots of relevant studies are developed under the ideal conditions. As in [10, 11], the authors deduced the minimum required number of measure-ments for sparsity estimation and signal reconstruction, respectively, but in the noise-free case. Based on exten-sive analysis and simulation, we identify the sparsity order, the received signal-to-noise ratio (SNR), and the compression rate as three key factors when performing our proposed scheme and then quantify these contribu-tions by mathematical approximation to support the the-oretical derivation.
In addition, a joint SNR and sparsity order estimation, and the conditions for implementing the compressed sensing, are suggested to give consideration to the prac-tical application of the proposed scheme.
The remainder of this paper is organized as follows. Section 2 describes the signal and network model. Sec-tion 3 presents the composiSec-tion of the proposed scheme, formulates the energy efficiency maximization problem, and derives the optimal compression rate. Section 4 shows the performance analysis and simulations. Finally, Section 5 concludes the paper.
2 Network mode
Consider a wideband spectrum that is divided into K
non-overlapping sub-bands. During a constant sensing time duration, we model the detection problem on the sub-band kas one choosing between a hypothesis H0;k,
which represents the absence of the primary signals, and an alternative hypothesis H1;k, which represents the
presence of the primary signals, k∈{1, 2,…,K}. More-the probability of occurrence. Without loss of generality, we assume that Pr H0;k
the coefficient of the sub-band k at any given time t, respectively. Then, define X(t) = {X1(t),X2(t),⋯,XK(t)},
where Xk(t) =Hk(t)Sk(t). Thus, the received signals at
SUs can be represented as R(t) =X(t)⋅1(k,t) +V(t), where V(t) is the additive white Gaussian noise and 1(k,t) is aK× 1 column vector in which thekth element is equal to 1 in the hypothesisH1;k and is equal to 0 in the
on the sub-bandkas γk=pk/p0, wherepkis the received
power of the primary signals andp0the noise power.
3 Proposed wideband spectrum sensing scheme
3.1 Scheme description
Figure 1 illustrates our proposed scheme, which is tai-lored to the WSS. The scheme includes five modules: the compressed sensing module (A1), the multi-band joint detection module (A2), the energy efficiency maximization module (A3), the sparsity order and SNR estimation module (B1), and the compressed sampling decision module (C1). The work flow of Fig. 1 can be described as follows.
If C1 is satisfied, i.e., the spectrum is sparse and all the elements of γ= {γk, ∀k} are above the lower limit
γ, in A1, R(t) is compressed sampled at the optimal sub-Nyquist sampling rate, given by A3, for the en-ergy efficiency maximization, and then reconstructed through the orthogonal matching pursuit (OMP) method [4] as R^ ¼R n^ð Þ, n= {1, 2,…,N}. Otherwise,
a⋅exp(b⋅δ) +c⋅exp(d⋅δ) is sampled at the Nyquist rate as R= {R(n)}, n= {1, 2,…,N}. Next, R^ (or R) is used by A2 for the parallel multi-band detection. Meanwhile, the summary statistic of each sub-band k,
^
Tk (or Tk), is used by B1 to estimate the sparsity
order and γ.
As an example of normal ADC chips, the energy con-sumption of AD9257 can be described as [12]
E fð s;τsÞ ¼ð2:33fsþ151:67Þ⋅τs; ð1Þ
wherefsis the sampling rate andτsis the sampling time
duration; the units ofE,fs, andτsare mW, Mbps, and s,
respectively. It can be observed that whenfsis in a
rela-tively low regime, i.e.,fs≤65MHz,Eis mainly dependent
on τs. This indicates that for a givenN, where N=fsτs,
increasing fs(as a means of shortening τs) is efficient to
save energy. Compared with the sequential sensing scheme, the parallel detection structure of A2 is more suitable for sampling the wideband spectrum at a highfs.
However, when fs> 65 MHz, the energy consumption
caused by the increase of fs is apparent. To overcome
this,A1is applied to reducefsto a level of less than the
Nyquist rate for further energy saving.
3.2 Compressed sensing (A1)
In most cases, since X(t) does not occupy all theK sub-bands, it may be sparse in the frequency domain. Ac-cording to the compressed sensing theory [13], ifX(t) is truly sparse, it can be sampled at the sub-Nyquist rate and then reconstructed with slight errors. Denote the sparsity order of X(t) as ρ¼the number of occupied sub‐bandsK and the compression rate for sampling as δ=fcs/fN,
δ∈(0, 1), wherefcs is the compressed sampling rate and
fN is the Nyquist rate. It is well known that δ must be
larger than ρ in order to reconstruct the sparse signals. Moreover, the reconstruction performance is improved with the increase ofδ.
Module A1 consists of two sequential sub-modules,
the compressed sampling and the signal reconstruc-tion. It has been shown that samples acquired from Gaussian and Bernoulli random sampling matrices have a better chance to perfectly recover sparse signals than other types of sampling matrices [6]. There are several options for hardware implementations of com-pressed sampling. An exemplary sampler is called an analog-to-information converter (AIC). It has a serial concatenated structure with three main components: a wideband modulator made of a pseudo-random chip-ping sequence, a low-pass filter, and a low-rate con-ventional ADC [10, 11]. In this paper, for a given 1 ×N
vector R, we simulate the process of compressed sam-pling as follows:
Choose anN×Ndiscrete Fourier transform (DFT) matrix as the sparse representation basisΨ, then mapRinto the sparse domain asΘ=ΨTRT.
Choose aV×Nuniform Gaussian random sampling matrixΦ, whereV=⌈δN⌉(⌈x⌉is the smallest
integer not less thanx), then calculate the
measurement matrix asW=ΦΨTRT.
Next, we represent ΦΨT as Λ and feed Λ and W into the OMP method to calculate R^, i.e., the recon-struction of R. OMP is a kind of greedy iterative al-gorithm for reconstruction. In each iteration, the column of Λ having the highest correlation with the error vector is selected and is used to update the ap-proximate solution of R. The iterative process will not be stopped until the error is small enough or the number of iterations is equal to V. In detail, the process of signal reconstruction through OMP method can be described as follows:
Initialization. Denote the iteration index asi= 0, the error vector asr(0)=W, and the expected non-negative error vector asr. LetR^ð Þ0 ¼0,Ω(0)
= Ø, where 0 is a 1 ×Nvector consisting of zero elements.
Step 1: Calculate the inner products of the error vector and the columns ofΛ,g(i)=ΛTr(i−1). represents all the elements of thejth column ofΛ.
Step 4: Calculate the approximate solution ofR
through the least square method,R^ð Þi ¼ Otherwise, go to step 1.
So far, the compressed sampling and the signal re-construction sub-modules have been present, and the simulation model of the compressed sensing can be established as a result.
3.3 Multi-band joint detection (A2)
To facilitate the description, we introduce the multi-band joint detection module when sampling at fN. The
module implements the WSS in three steps:
Calculate the discrete frequency response ofR (denoted asY= {Y(n)},n= {1, 2,…,N}) through an
N-point fast Fourier transform (FFT).
For each sub-bandk, calculate summary statisticTk as the sum of the received signal energy over an interval ofMsamples, i.e.,Tk¼ decision whether the primary signal is present or not.
According to [4], for a large M, the probability dis-tribution functions (PDFs) of Tk are close to normal
distributions and can be represented as N μi;k;σ2
3.4 Impact of sparsity order, compression rate, and SNR
Now, we consider the multi-band joint detection when the compressed sensing moduleA1is valid. The spectrum
can be reconstructed through the OMP method but at the expense of causing recovery errors. The perform-ance of signal reconstruction depends on the sparsity order and the compression rate. Thus, it is foreseeable that the two factors should also affect the detection ac-curacy. On the other hand, since the energy detector used at each branch of A2 cannot extract the primary
signal from the noise, the received SNR is the most im-portant factor for signal detection. In what follows, we thus investigate the impact of sparsity order, compres-sion rate, and SNR on the sensing performance of the proposed scheme.
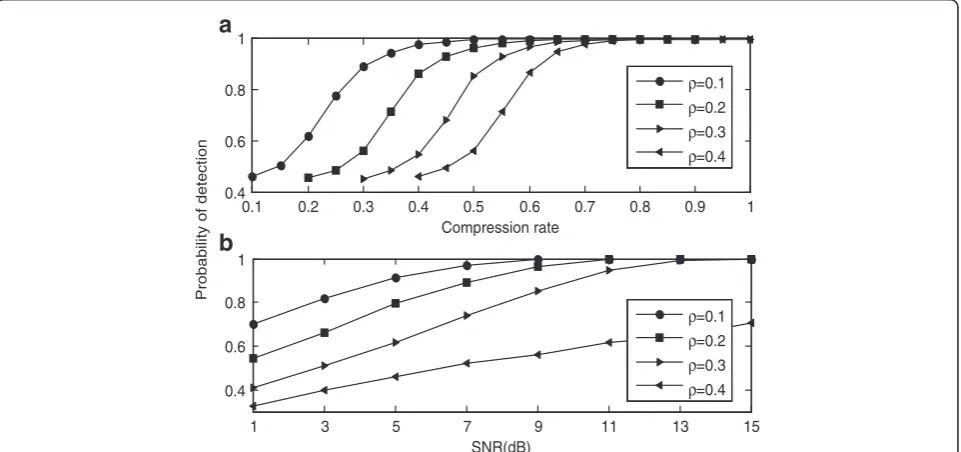
demonstrate that the probability of false alarm and the probability of detection rapidly drop to 0 and raise to 1, respectively, for ∀ρ∈{0.1, 02, 0.3, 0.4} as the increase of
δ. This proves the feasibility of the scheme, i.e., the structure of the combinedA1andA2is the ability to
ac-complish the task of WSS if the spectrum is truly sparse. In addition, for the same sensing performance, the needed compression rate becomes lower as the sparsity
order decreases. Figures 2b and 3b show the probabil-ity of false alarm and the probabilprobabil-ity of detection, re-spectively, for different pairs of (ρ,γk) as δ= 0.5. We
can see that for any sub-band in the wideband spectrum, the detection accuracy of the status (occupied or not) is proportional to the received SNR of the primary signal. This indicates when the sparsity order and compression rate have been determined
0.1 0.2 0.3 0.4 0.5 0.6 0.7 0.8 0.9 1 0.2
0.4 0.6 0.8 1
Compression rate
P
robabi
lit
y
of
f
al
s
e al
ar
m
1 3 5 7 9 11 13 15
0.2 0.4 0.6 0.8 1
SNR (dB)
ρ=0.1
ρ=0.2
ρ=0.3
ρ=0.4
ρ=0.1
ρ=0.2
ρ=0.3
ρ=0.4
a
b
Fig. 2Impact of sparsity order, compression rate, and SNR.aThe probability of false alarm versusδ, whenγk= 9 dB.bThe probability of false alarm for different pairs of (ρ,γk) asδ= 0.5
0.1 0.2 0.3 0.4 0.5 0.6 0.7 0.8 0.9 1 0.4
0.6 0.8 1
Compression rate
Probability of detection
1 3 5 7 9 11 13 15
0.4 0.6 0.8 1
SNR(dB)
ρ=0.1
ρ=0.2
ρ=0.3
ρ=0.4
ρ=0.1
ρ=0.2
ρ=0.3
ρ=0.4
a
b
that the higher the received SNR, the better the sens-ing performance.
3.5 Analysis model
Denote that the primary signal does not occupy channel
kas hypothesis H0;k, otherwise as H1;k. Using the
Cen-of the received primary signal, i∈{0, 1}, respectively. Thus,
can be used to unify the expressions of the probabil-ity of false alarm Pð Þfk (when i= 0) and the
probabil-analysis and simulation above, we identify ρ, γk, and
δ as three key factors that affect the sensing per-formance of the proposed scheme. Therefore, to establish a relationship between T^k and Tk, we
denote
Eqs. (2) and (4) into Eq. (3). For a target probability of detection Pd, the probability of false alarm can be
calculated by
On the other hand, for a target probability of false alarmPf, the probability of detection is
Pð Þdk ¼Q
the following sections. The analytical expressions of the coefficients αi and βi can be obtained from simulation
results through the curve-fitting method. Since there are similar fitting results for different pairs of (ρ,γk), we
chooseρ= 0.2 andγk= 9dB for demonstrations. Table 1
gives the experimental data of the coefficients. It can be found that α1 converges to 1 rapidly as δ increases. Then, α0 andβi can be accurately fitted into functions
ofδas
a⋅expðb⋅δÞ þc⋅expðd⋅δÞ ð7Þ
Furthermore, as shown in Table 2,ais always positive while b is negative. As forcand d, at least one of them is close to zero.
3.6 Energy efficiency maximization (A3)
SU’s final goal is to access the spectrum and transmit its own data [1, 5]. There are two different spectrum access schemes, namely the underlay and overlay approaches [1, 4, 14]. Under the underlay approach, SUs are allowed to transmit on occupied sub-bands but suffer to severe transmitting power limit for avoiding interference with the primary signals. On the contrary, although only the unoccupied sub-bands can be utilized when the overlay approach is selected, SUs can greatly increase their transmitting powers to improve the quality of service (QoS). Generally speaking, the overlay approach is more suitable for the communication of CRN; thus, it is con-sidered in this paper and the spectrum access opportun-ity of SU can be represented as
~
where Pr(⋅) is the occurrence probability of the hypoth-esis, H0 is that the channel is unoccupied by PUs, and
Table 1Experimental data of the coefficients,ρ= 0.2,γk= 9 dB
δ 0.2 0.3 0.4 0.5 0.6 0.7 0.8 0.9
α1 0.96 1.02 1.03 1.02 1.01 1.01 1.01 1.00
H1 is not. In practice, ζ~˜ can be approximated by the
first part of Eq. (8), since the second part is generally
much smaller. Based on this, we defineζ asζ~˜=PrðH0Þ
and the energy efficiency as η=ζ/(energy consumed). When the compressed sensing module A1 is valid, to enhance the spectrum access opportunity, we formu-late the problem of energy efficiency maximization as follows.
The constraint (10) ensures that the primary transmis-sion is not interrupted by the maximization process. The constraints (11) and (12) give an exact range of the compression rate.
To solve the above problem, we firstly focus on the sub-problem as
Substitute Eqs. (1) and (5) into Eq. (13). Then, the derivation ofηkagainstδis
η′
From Table 2, we see that there are small differences between any twobvalues. Whenδ∈(0, 1), we have
thus, υ′> 0, then υ is monotonically increasing as δ increases. Given the fact thatQ(x) is a decreasing func-tion and upper bounded by 1, we find that both part A and B of Eq. (14) have non-negative values. Moreover, A and B are monotonically decreasing and increasing as
Tk¼ T^ð Þk0;T^kð Þ−1;…−T^ðk−Sþ1Þ
n o
increases, respectively, so
η′
k is monotonically decreasing asδincreases. In the limit,
whenδ→ρandρ→0,
then we have lim
δ→ρ;ρ→0ηk′>0 . On the other hand, when sult, there is a zero point of η′k within the interval of
δ∈(0, 1), so the convexity of ηk is proved. Considering
all theKindependent sub-bands, the maximumηmust also be unique within the range of δ, and it can be easily found through the one-dimensional exhaustive search. In practical application, we can replace the module A3 by an optimal compression rate matrix
indexed by the sparsity order ρ and the SNR vector γ, which can be stored in the computer’s memory. When the estimation of ρ and γ is finished, the compression rate δ can be chosen by searching through the matrix. This makes the energy consumed by A3 be neglected
compared with that of ADC. Table 2Fitting results of the coefficients,ρ= 0.2,γk= 9 dB
a b c d
α0 89.04 −10.59 0.461 0.277
β1 63.67 −9.23 1.73 −0.12
3.7 SNR and sparsity order estimation (B1)
To take into account the applicability of the scheme, we give a possible solution of joint SNR and sparsity order estimation in this section. It employs the SNR classification through the multiple-hypothesis-testing-based type-I testing method (see the details in Section V in [14]). In our applications, the received SNR is par-titioned into a noise level plus k signal levels with the strength of each level equal to (l−1)dB, l= {1, 2,…,L}. Denote the confidence level as ε and the probability matrix asp= [pk,l]K×L, wherepk,lis the probability that
the hypothesis Hk;l is accepted, i.e., γkshould be
classi-fied into signal level l. To improve the exactness of SNR classification, pk,l is calculated by using the
sum-mary statistic sequence Tk¼ T^ð Þk0;T^
obtained from the past S tests before the current mo-ment. The process of SNR classification is as follows:
Initialization: Let l= 1 and the set of accepted
Hk;l for sub-band k as Hk¼Hk;1;Hk;2;⋯;Hk;L.
Step 1: At the signal levell, sortp(:,l) in ascending order ofpvalues,p(1)≤p(2)≤⋯≤p(K), wherep(:,l)
represents all the elements of thelth column ofp.
Step 2: Find the maximum index ofp(j)satisfying the condition thatpð Þj≤Ljε,j∈{1, 2,⋯,K}, and denote it asJ.
Step 3: Reject all theHk;lifk∈[1, J], then eliminate them fromHk.
Step 4: Ifl=L, break the loop. Otherwise,l=l+ 1, then go to step 1.
Step 5: IfHk≠Ø, choose the maximumlfromHkas the SNR level of sub-bandk. Otherwise, classify it into the noise level.
Considering all theKsub-bands, the estimation ofγcan be obtained. Furthermore, after the SNR classification, ρ can be estimated bythe number of SNR classified into signal levelsK .
3.8 Compressed sampling decision (C1)
Since there is no uniform criterion for judging the sparsity [10], in our application, we say the spectrum is truly sparse if ρ< 0.5. Finally, by canceling out the threshold variable λk of Eq. (3) when i= 0 and i= 1,
we evaluate the lower limit of the received SNR γ with the solution of
M¼2⋅ β0 Q minimum number of required samples to achieve the pair of target probabilities Pd;Pf
.
4 Performance analysis and simulations
In this section, the performance of energy efficiency maximization and energy saving is demonstrated by simulations. We consider a sparse wideband spectrum contains 10 TV bands each with 6-MHz bandwidth. Assume the occurrence probabilities as PrðH1Þ ¼q, Pr
H0
ð Þ ¼1−q, andq∈(0, 1), the number of signal levels as
L= 10, and the received SNRs of the primary signal on each sub-band as γ= {0, 1,…,L−1} (dB). Moreover, assume thatPd¼0:9, Pf ¼0:1,N= 512,ε= 0.95,S= 20,
andp0=−95.2 dBm.
From Fig. 4, we observe that there is a maximum en-ergy efficiency in each case of (ρ,κ), whereκis the set of occupied bands. As the number of occupied sub-bands decreases, the optimal compression rate can be reduced, which means a lower sampling ratio is needed. As a result, the maximum energy efficiency can also be substantially improved. For instance, when κ= {3}, the maximum energy efficiency is 728 at the optimal com-pression rate δ= 0.55, then drops to 607 atδ= 0.8 when κ= {3, 5, 7, 9}. In addition, all the simulated results match to the numerical results very well, which confirms that the analytical model of the proposed scheme and the process of energy efficiency maximization are valid.
For thorough analysis of energy efficiency maximization, Fig. 5a, b illustrates the maximum energy efficiency and the optimal compression rate, respectively, versus the re-ceived SNR and the sparsity order. When focusing on the sparsity orders,∀ρ∈{0.1, 02, 0.3, 0.4}, we observe that the higher the received SNR, the larger the maximum energy efficiency can be achieved, and a lower optimal compres-sion rate is needed. Moreover, the positive effect of spars-ity order on the energy efficiency can be clearly seen, i.e., the sparser the spectrum, the more energy efficient the proposed scheme.
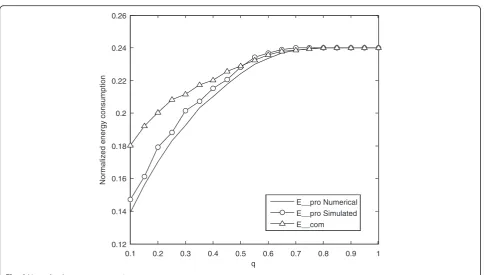
Finally, to highlight the energy efficiency of our pro-posed scheme, we compare the energy consumption of the proposal with those of the two sensing schemes mentioned in the introduction, (i) the sequential sensing scheme sampling at the Nyquist rate [3] and (ii) the one-step compressed sensing scheme sampling at the sub-Nyquist rate but aiming at signal reconstruction [5]. Sequentially, denote the energy consumption of the three schemes asE_pro,E_seq, andE_com. In order to facilitate the analysis, under the same sensing perform-ance constraints (Pd≥0:9,Pf≤0:1), we normalizedE_pro
and E_com by E_seq, respectively, i.e., Ẽ_pro =E_pro/
E_seq,Ẽ_com =E_com/E_seq. In Fig. 6, we assume that the SNR vector and sparsity order are a priori infor-mation and calculate the optimal compression rate through A3. Then, we can obtain the numerical result
1 3 5 7 9 0
200 400 600 800 1000 1200
SNR(dB)
Maximum energy efficiency
1 3 5 7 9
0.2 0.3 0.4 0.5 0.6 0.7 0.8 0.9 1
SNR(dB)
Optimal compression rate
ρ=40%
ρ=30%
ρ=20%
ρ=10%
ρ=40%
ρ=30%
ρ=20%
ρ=10%
a
b
Fig. 5The maximum energy efficiency and the optimal compression rate versus the received SNR
0.1 0.2 0.3 0.4 0.5 0.6 0.7 0.8 0.9 1.0
100 200 300 400 500 600 700
Compression rate
Energy efficiency
ρ=0.1, κ={3} ρ=0.2, κ={3,5} ρ=0.3, κ={3,5,7} ρ=0.4, κ={3,5,7,9}
to improve the performance of parameter estimation, the signal is sampled at the Nyquist rate in the first 20 sensing time durations) and use them to choose the optimal com-pression rate from the stored comcom-pression rate matrix mentioned above, to obtain the simulated result ofẼ_pro. In addition, when performing the one-step compressed sensing scheme as comparison, we use the OMP algo-rithm to solve theℓ1-optimization problem (see the details in formula (11) in [5]). We can see from this figure, the energy consumption of our proposal, Ẽ_com, is always smaller than that of the one-step compressed sensing scheme, Ẽ_com. Furthermore, the energy saving is more obvious if q is smaller, which means the wideband spectrum is sparser. However, when q≥0.7, although C1 cannot be satisfied in most cases and the sampling rate is chosen to be the Nyquist rate, the energy consumption of the proposal is only about 24 % of that of the sequential sensing scheme, which can be attributed to the parallel multi-band detection scheme used in A2 shortening the sampling time.
5 Conclusions
Taking advantage of the frequency-domain sparsity of the wideband spectrum, a new wideband spectrum sens-ing scheme has been proposed to save energy through reducing both the sampling rate and sensing time dur-ation. The sparsity order, the received signal-to-noise
ratio, and the compression rate are identified as three key factors that affect the sensing performance. More-over, under the sensing performance constraints, the uniqueness of the maximum energy efficiency within the range of the compression rate has been proved. It is indicated that the sparser the wideband spectrum, the higher the energy efficiency and the lower the energy consumption. All these advantages have been corrobo-rated by simulations.
Competing interests
The authors declare that they have no competing interests.
Author details
1School of Electronic Information Engineering, Beihang University, Beijing 100191, China.2Beijing Institute of Remote Sensing Equipment, Beijing 100039, China.
Received: 16 April 2015 Accepted: 3 March 2016
References
1. YY Pei, YC Liang, KC Teh, KH Li, Energy-efficient design of sequential channel sensing in cognitive radio networks: optimal sensing strategy, power allocation, and sensing order. IEEE J. Sel. Areas Commun.29(8), 1648–1659 (2011)
2. J Meng, W Yin, HH Li, E Hossain, Z Han, Collaborative spectrum sensing from sparse observations in cognitive radio networks. IEEE J. Sel. Areas Commun.29(2), 327–337 (2011)
3. M Xu, H Li, XY Gan, Energy efficient sequential sensing for wideband multi-channel cognitive network, in Proc. IEEE ICC (2011)
4. Z Quan, SG Cui, AH Sayed, HV Poor, Optimal multiband joint detection for spectrum sensing in cognitive radio network. IEEE Trans. Signal Process. 57(3), 1128–1140 (2009)
0.1 0.2 0.3 0.4 0.5 0.6 0.7 0.8 0.9 1 0.12
0.14 0.16 0.18 0.2 0.22 0.24 0.26
q
Normalized energy consumption
E__pro Numerical E__pro Simulated E__com
5. Z Tian, GB Giannakis, Compressed wideband sensing in cooperative cognitive radio network, inProc. IEEE GLOBECOM, 2008, pp. 1–5 6. FZ Zeng, C Li, Z Tian, Distributed compressive spectrum sensing in
cooperative multihop cognitive networks. IEEE J. Sel. Topics Signal Process. 5(1), 37–48 (2011)
7. YL Polo, Y Wang, A Pandharipande, G Leus, Compressive wideband spectrum sensing, inProc. IEEE ICASSP, 2009, pp. 2337–2340
8. DD Ariananda, G Leus, Compressive wideband power spectrum estimation. IEEE Trans. Signal Process.60, 4755–4789 (2012)
9. D Cohen, YC Eldar, Sub-Nyquist sampling for power spectrum sensing in cognitive radios: a unified approach. IEEE Trans. Signal Process.62(15), 3897–3910 (2014)
10. Y Wang, Z Tian, CY Feng, A tow-step compressed spectrum sensing scheme for wideband cognitive radios, inProc. IEEE Globecom, 2010
11. Y Wang, Z Tian, CY Feng, Sparsity order estimation and its application in compressive spectrum sensing for cognitive radios. IEEE Trans. Wireless Commun.11(6), 2116–2125 (2012)
12. AD9257 datasheet, [Online], Available. http://www.analog.com/media/en/ technical-documentation/data-sheets/AD9257.pdf.
13. EJ Candes, MB Wakin, An introduction to compressive sampling. IEEE Personal Commun.6(4), 12–18 (2008)
14. SH Wu, CY Yang, DHT Huang, Cooperative sensing of wideband cognitive radio: a multiple-hypothesis-testing approach. IEEE Trans. Veh. Technol. 59(4), 1835–1846 (2009)
Submit your manuscript to a
journal and benefi t from:
7Convenient online submission 7Rigorous peer review
7Immediate publication on acceptance 7Open access: articles freely available online 7High visibility within the fi eld
7Retaining the copyright to your article