METHOD DEVELOPMENT AND VALIDATION FOR SIMULTANEOUS ESTIMATION OF
LEVOSULPIRIDE AND RABEPRAZOLE SODIUM: A NEW ANALYTICAL Q-ABSORBANCE RATIO
APPROACH
BHARAT JHANWAR, BHUPENDRA SINGH*, GEETANJALI SAINI, SURAJPAL VERMA
Department of Quality Assurance, Lovely Institute of Technology, Lovely Professional University, Phagwara Jalandhar - 140 001, Punjab, India. Email: [email protected]
Received 14 July 2017, Revised and Accepted 25 July 2017 ABSTRACT
Objective: The aim of the study was to develop a precise, accurate, and rapid ultraviolet spectrophotometric method for simultaneous estimation of levosulpiride (LEVO) and rabeprazole sodium (RBS) in the binary mixture and to validate the method as per ICH guidelines.
Method: Estimation of LEVO and RBS was performed by Q-absorbance method. Analysis was performed using the ratio of absorbance at two selected wavelengths, one at iso-absorptive point and other is the absorbance maxima of any one of the components. Single scan spectrum and the overlain spectrum conclude that absorbance maxima of LEVO and RBS are 228 and 291.8 nm, respectively, with a coinciding iso-absorptive point at 255 nm. Method uses a
ratio of absorbance for assay at 255 and the second wavelength is 291.8 nm, λmax for RBS. It is also applicable at 228 nm, as the second wavelength.
Results: Linearity of LEVO and RBS was found to be 25-125 and 4-36 μg/ml, respectively. The accuracy of the LEVO and RBS was found 99.26% and 99.51%, respectively and Sandell’s sensitivity ranged between 0.0238 and 0.594 µg/cm2. Assay of LEVO (75 mg) and RBS (20 mg) in capsule dosage form was found 99.5% and 98.69% w/w, respectively.
Conclusions: The developed method for the estimation of LEVO and RBS in binary mixture were found to be simple, accurate, robust, and reproducible. No interference of excipients and the degraded product was found during the estimation. Therefore, the method can be successfully applied for routine quality control analysis.
Keywords: Levosulpiride, Rabeprazole sodium, Q-absorbance, ICH, Validation.
INTRODUCTION
Levosulpiride (LEVO) is substituted benzamide antipsychotics. LEVO is an atypical antipsychotic agent that blocks the presynaptic dopaminergic D2 receptors. Like its parent compound, LEVO shows antagonism at D3
and D2 receptors. LEVO is used in the treatment of the psychosis, anxiety
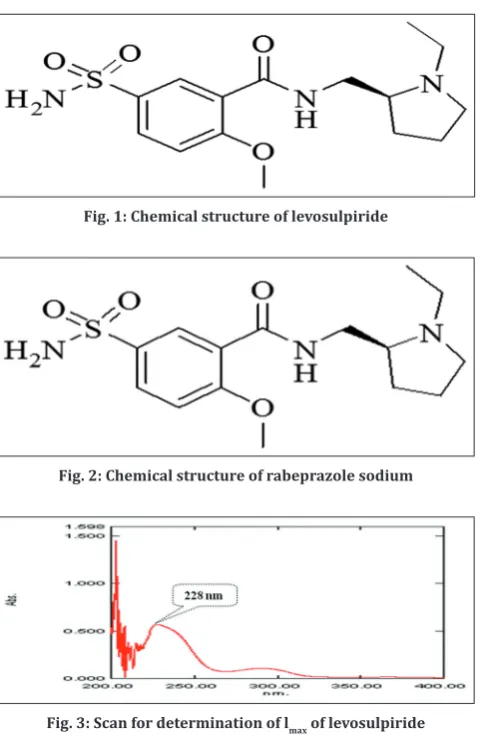
disorder, premature ejaculation (not recommended in some countries), vertigo and irritable bowel syndrome. It is chemically known as-[[(2S )-1-ethylpyrrolidin-2-yl] methyl]-2-methoxy-5-sulfamoyl benzamide (Fig. 1). It is soluble in methanol, ethanol, and DMSO.
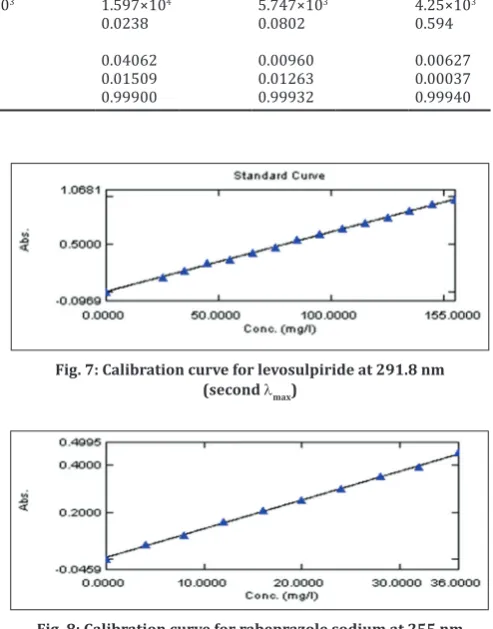
Rabeprazole sodium (RBS) is a proton pump inhibitor. It is widely used as an antiulcer drug. It falls into the category of proton pump inhibitor. It is used in the treatment of gastric ulcer, peptic ulcer, ulcerative gastroesophageal reflux disease, duodenal ulcer Zollinger-Ellison syndrome, and Helicobacter pylori eradication in combination with amoxicillin. Chemically, it is 2-([4-(3-methoxypropoxy)-3-methylpyridin-2-yl] methylsulfinyl)-1H-benzo[d]imidazole (Fig. 2). It is freely soluble in water; soluble in methanol, ethanol and ethyl acetate [1-3].
RBS can be estimated by liquid chromatography method which is
official in Indian Pharmacopoeia (2007) [4]. There is no official method
reported for the estimation in combination for both the selected drugs. There is some chromatographic method for estimation of single and both combination of rabeprazole and LEVO [5-7]. Some of the methods are available on combinations with itopride and mosapride but not with suggested drug combinations[8,9]. There is no method for selected combination has been developed by Q absorbance ratio. Hence, there is scope for the absorption ratio method is best suited for simultaneous estimation of RBS and LEVO in combined capsule dosage
form by ultraviolet (UV) spectrometry. Q absorbance ratio method using UV-visible spectrophotometry depends on the property that
for a substance, which obeys beer’s law at all wavelength, the ratio of
absorbance at any two wavelengths is a constant value independent of concentration or path length. The ratio of the two different wavelengths
absorbance is known as Q value [10,11].
METHODS Instruments
The spectrophotometric estimation was performed on Shimadzu
UV-visible double beam spectrophotometer (Model-1800). Weighing of the
chemicals was done on electronic analytical balance.
Chemical and reagents
The drug samples of LEVO and rabeprazole were obtained from Mankind Pharma, Baddi H.P. Marketed formulation, Rabekind Plus (Capsules) was procured from the market. All the other chemicals and reagents were of analytical grades.
Preparation of standard stock solution of LEVO (1000 µg/ml)
Accurately weighed LEVO 100 mg was dissolved in sodium hydroxide (0.1 M) up to 100 ml in a volumetric flask to produce 1000 µmg/ml of
LEVO.
Preparation of standard stock solution of RBS (100 µg/ml)
Accurately weighed RBS 25 mg was dissolved sodium hydroxide (0.1 M) up to 25 ml in a volumetric flask. Aliquots of 10 ml of the stock solution were diluted up to 100 ml from the same to produce 100 µmg/ml of RBS.
Research Article
Selection of wavelength
Aliquots of any one concentration of LEVO and RBS were scanned
between 200 and 400 nm against 0.1 M sodium hydroxide as blank.
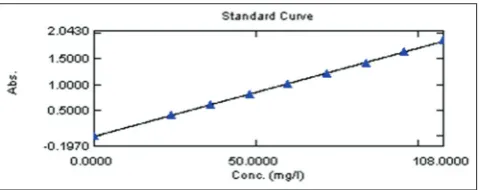
The absorbance maxima of LEVO and RBS were found to be 228 and 291.8 nm, respectivelyv (Figs. 3 and 4). The overlain spectrum was obtained by combining both the scan. The isosbestic point was obtained at 255 nm (Fig. 5).
llPreparation of calibration curves Calibration curve of LEVO
Aliquots of LEVO in the concentration range of 25-125 µmg/ml were obtained by transferring 50 ml of LEVO stock solution (1000 ppm) to the 100 ml volumetric flasks and volume were made up of the solvent 0.1 M sodium hydroxide. They were further diluted up to in series up to 10 ml in volumetric using the same solvent. The absorbance of the
solutions was measured at 255 (isobestic) and 291.8 nm (second lmax) against the solvent system as blank and calibration curves were plotted (Figs. 6 and 7).
Calibration curve of RBS
Aliquots of RBS in the concentration range of 4-36 µg/ml were obtained by transferring required volume of standard stock of RBS (100 ppm) to the series of 10 ml volumetric flasks, and then volumes in each volumetric flask were made up with solvent 0.1 M sodium hydroxide.
The absorbance of the solutions was measured at 255 (isobestic) and 291.8 nm (self) against the solvent system as blank and calibration curves were plotted (Figs. 8 and 9).
Preparation of synthetic mixtures of rabeprazole and LEVO The synthetic mixture of LEVO and RBS was prepared in a ratio of
15:4. They are accurately weighed 25 mg and 6.6 mg, respectively,
and were transferred to 25 ml volumetric flask, and 15 ml of the same
solvent system was added. Common excipients, such as 8% starch, 7% magnesium stearate and 84% lactose, 1% talc, cellulose acetate phthalate (for 1000 µg/ml) which were used in the formulation, were added to this mixture and sonicated for 20 minutes. Drug sample
was prepared using basic knowledge of excipients available in text
books [12]. This solution was filtered through the Whatman filter
paper and residues were washed with the solvent system. The filtrate and washings were combined, and volume was made up to the 25 ml with the solvent system. Then, 2.5 ml of the solution was diluted to
10 ml with the solvent system. The decision of this ratio of drugs in
the synthetic mixture was based on the dosage strength of combination, which is available in the market. This combination has been approved by CDSCO, India, as capsule dosage form. It is marketed under the brand
name “Rabekind,” containing LEVO (75 mg) with rabeprazole (20 mg).
Calibration curves of LEVO and rabeprazole in synthetic mixture
The synthetic mixture (1.2, 1.8, 2.4, 3.0, 3.6, 4.2, 4.8, 5.4 ml) was transferred to a series of 10 ml volumetric flasks separately, and volume
was made up to the mark with the solvent system. The absorbance of these solutions was measured at 255 and 291.8 nm and calibration
curves were plotted (Figs. 10 and 11).
Introduction to Q-absorbance ratio method
In absorption ratio method, the absorbance of both the drugs was
calculated at two selected wavelengths among which λ1 is the wavelength of isosbestic point (where both drugs show the same absorbance) and
λ2 is the λ max of either drug among the drugs to be analyzed. From the overlain spectra, wavelength 255 nm (λ1, i.e., an isosbestic point) and
291.8 nm (λ2, i.e., absorbance maxima of rabeprazole) were selected
for analysis. The concentration of the individual drug is determined by
equations (1 and 2) written below [10,11].
−
Cx: Concentration of RBS.
−
Cy: Concentration of LEVO.
Where, m= 2
The ratio of absorbance of calibration curves at different two wavelengths was calculated as below. These ratio values are used in equations to calculate the Qm values to determine the assay values. The
values are given in Tables 1 and 2.
Calculation of Q ratio equation values
Absorptivities from the standard curve data are used to determine the absorptivities, as well as the ratio, are used for determination of Qm
values. The calculation is given in Tables 3 and 4.
Table 1: Ratio of absorbance of LEVO S.No. Concentration (ppm) Absorbance
in nm Ratio of absorbance
255 291.8
1. 25 0.291 0.188 1.547 2. 35 0.452 0.289 1.564 3. 45 0.489 0.310 1.577 4. 55 0.616 0.390 1.579 5. 65 0.743 0.465 1.598 6. 75 0.862 0.541 1.593 7. 85 0.938 0.590 1.589 8. 95 1.093 0.695 1.572 9. 105 1.303 0.822 1.585
10. 115 1.487 0.949 1.567
11 125 1.539 0.979 1.571
LEVO: Levosulpiride
Table 2: Ratio of absorbance of RBS S.No. Concentration (ppm) Absorbance
in nm Ratio of absorbance
255 291.8
1. 4 0.021 0.096 0.218
2. 8 0.070 0.238 0.293
3. 12 0.111 0.392 0.285
4. 16 0.124 0.442 0.259
5. 20 0.189 0.667 0.283
6. 24 0.243 0.825 0.294
7. 28 0.290 0.935 0.305
RBS: Rabeprazole sodium
Table 3: Value of absorptivities
a×1 a×2 ay1 ay2
12.896 41.887 9.776 6.252
Table 4: Values of Q ratio
Qx Qy Qm
Validation of the developed method according to ICH guidelines Following parameters were taken into consideration for validation of proposed methods [13-15].
1. Linearity: Linearity range is actually made of series of dilutions which are abiding the Beer Lambert’s law. The intercept must be
close to zero for the better linear following of dilution at selected wavelength. The result for linearity with respective R2 values and
slope parameters for the active pharmaceutical ingredients (API) are given in Table 5.
2. Range:
a. Working range: It begins from limit of quantification to the
maximum concentration used for the development of the
analytical method. In this case, it is found to be 13.15-155 mg/ml and 3.17-36 mg/ml for LEVO and RBS, respectively.
b. Linearity range: It is the interval in which the response is
directly proportional to the concentration between the upper
and lower levels including the level (which is generally ±5%
of the intercept having a slope equal to zero). In this case, it is equal to 25-155 mg/ml and 4-36 mg/ml for LEVO and RBS
respectively.
c. Target range: It is that concentration which is 80%, 100%, and 120% of the target concentration. In this case, these are equal to 72.0, 90.0, and 108.0 µg/ml for LEVO and 16.0, 20.0, and 24.0 µg/ml for RBS.
d. Target concentration: It is defined as the concentration,
which is equal to the midpoint of linearity range. It is equal
[(70+5)/2]=37.5 mg/ml. The results for range studies are shown
in Table 6.
3. Accuracy: The results of analysis are obtained in three group
containing three replicate experiments with API and capsule dosage
form, had good agreement with the labeled amount of the drug.
a. Method: In nine different 10 ml volumetric flasks, 1 ml of the pre-analyzed mixture solution (100 µg/ml) was taken and added ml of standard solution of bulk (API) mixture (100 µg/ml), and the volume was 0.12, 0.16, 1.9 ml added up to 10 ml with solvent system. The
results are shown in Table 7.
4. Precision:
a. Repeatability: Repeatability was assessed using: Six-time repetition of target concentration 100% that is (20+90 µg/ml/2=55 µg/ml)
b. Intra-day precision: In the study of the intraday which was
conducted at three different times such as 9 am, 12 pm, 3 pm
on the solution having the concentration value 80%, 100% and 120% of the target concentration (n=3)
c. Interday precision: In the study of the interday which was conducted on the solution having concentration value 80%, 100%, and 120% of the target concentration (n=3), on three
different days. The results of precision are shown in Table 6.
5. Limit of detection (LOD): The LOD was determined from the set of 6
calibration curves used to determine method linearity. The detection
limit (LOD) may be expressed as: LOD=3.3(SD/S)
6. Limit of quantitation (LOQ): The LOQ was determined from the
set of 6 calibration curves used to determine method linearity. The
detection limit (LOQ) may be expressed as: LOQ=10(SD/S)
Where SD=Standard deviation of the response. It is actually the intercept of the calibration curve, S=Slope of the calibration curve.
The results are shown in Table 6. Fig. 1: Chemical structure of levosulpiride
Fig. 2: Chemical structure of rabeprazole sodium
Fig. 3: Scan for determination of lmax of levosulpiride
Fig. 4: Scan for determination of lmax of rabeprazole sodium
Fig. 5: Overlain spectra of levosulpiride and rabeprazole sodium
7. Specificity:
a. Method: For specificity determination, a few excipients such as 8% starch, 7% magnesium stearate and 84% lactose, 1% talc, cellulose acetate phthalate (for 1000 µmg/ml) were added, then after filtration, any change in absorbance are observed. The
results are shown in Table 8.
8. Assay procedure in capsule dosage form: 20 capsules were taken
and the IP method was followed to determine the average weight.
a. Method: Above weighed capsule were finally weighed and
contents were triturated well. Quantity of powder equivalent to
25 mg of LEVO and 6.66 mg of RBS (ratio is 15:4) was transferred to 25 ml volumetric flask volume was made up to 25 ml with previously sonicated solvent. The solution was filtered and the filtrate, 5 ml was transferred to 25 ml volumetric flask and
volume was made up to 25 ml with the solvent system. Then, 3.6,
4.5, 5.4 ml of aliquots were transferred to three 10 ml volumetric flasks and volume were made up to 10 ml with the same solvent.
The absorbance was measured at 255 nm and 291.8 nm. Percent capsule claim for LEVO and RBS was determined by above-discussed equation 1 and 2. The results are shown in Table 9.
EXPERIMENTAL RESULTS
Tables 5-9 summarizes the experimental results.
DISCUSSIONS
A UV spectrophotometry method was developed and validated for the determination of LEVO and rabeprazole in the binary mixture as per the ICH guidelines. The analytical method showed linearity in the
concentration range of 25-155 µg/ml and 4-36 µg/ml for LEVO and RBS, respectively. The developed method showed good precision by % relative standard deviation of 0.255% and 0.177% for LEVO and RBS,
respectively. Specificity of the developed analytical method was shown
the negligible interference of the excipients. The % interference was 0.209% and 0.145% for LEVO and RBS, respectively. The accuracy of
the method was validated by mean percentage recovery which was found to be in the acceptable range of above 99% for both the drugs in
combination.
CONCLUSIONS
The proposed method was linear, accurate, precise, and specific as per validation parameters (Table 9) discussed above as per ICH guidelines. Table 5: Optical and regression parameters
Parameters RBS LEVO
255 nm 291.8 nm 255 nm 291.8 nm
Beer’s law limit (µg/ml) 4-36 25-155
Molar absorptivity (L mole−1 cm−1) 4.916×10³ 1.597×10⁴ 5.747×10³ 4.25×10³
Sandell’s sensitivity (mg/cm2/0.001 absorbance unit) 0.0771 0.0238 0.0802 0.594
Regression equation
Slope (b) 0.01231 0.04062 0.00960 0.00627
Intercept (a) 0.00586 0.01509 0.01263 0.00037
Correlation coefficient 0.99901 0.99900 0.99932 0.99940
RBS: Rabeprazole sodium, LEVO: Levosulpiride
Table 6: Summary of validation parameters
Validation parameters LEVO RBS
Specificity (% interference) 0.209 0.145 Linearity (µg/ml) 25-155 4-36
Range (µg/ml) 13.15-155 3.17-36
Precision** (% RSD)
Repeatability (n=6) 0.91 0.825 Intraday (n=3) 0.255 0.177 Interday (n=3 0.92 0.720 Accuracy* (% recovery) 99.28 99.51
LOD (µg/ml)* 4.34 1.2
LOQ (µg/ml) * 13.15 3.17 *Acceptance criteria 99-101%, **acceptance criteria: RSD≤2. LOD: Limit of detection, LOQ: Limit of quantitation, RSD: Relative standard deviation, RBS: Rabeprazole sodium, LEVO: Levosulpiride
Fig. 7: Calibration curve for levosulpiride at 291.8 nm (second lmax)
Fig. 8: Calibration curve for rabeprazole sodium at 255 nm (isobestic point)
Fig. 9: Calibration curve for rabeprazole sodium at 291.8 nm (second lmax)
The developed method was evaluated successfully for the content determination of marketed formulation of a combination of LEVO
(75 mg) and RBS (20 mg) in capsule dosage form as well self-made
synthetic mixture. It can also be used for any other solid dosage form for the same combination.
REFERENCES
1. O’Neil MJ. The Merck Index: An Encyclopedia of Chemicals, Drugs and Biologicals. 14th ed. Whitehouse Station, NJ: Merck Research
Laboratories; 2011. p. 1041-3.
2. Rang HP, Dale MM, Ritter JM, Flower RJ. Rang and Dale’s
Fig. 11: Calibration curve for synthetic mixture at 291.8 nm
Pharmacology. 6th ed. Edinburgh, New York: Churchill Livingstone,
Elsevier Science Ltd.; 2007.
3. Brunton LL, Parker KL. Goodman and Gilman’s Manual of Pharmacology and Therapeutics. 11th ed. New Delhi: The Mc Graw Hill
Companies Inc.; 2005.
4. Ministry of Health and Family Welfare. Indian Pharmacopoeia. Vol. 3. Ghaziabad: Government of India, Ministry of Health and Family Welfare, The Indian Pharmacopoeia Commission; 2007. p. 1034-5.
5. Manjunath S, Chouhan V, Sandeep S. Spectrophotometric estimation of levosulpiride in bulk drug and formulations. Int J Pharm Pharm Sci 2011;3(2):135-7.
6. Battu R, Prasanna A. Development and validation of RP-HPLC for the rabeprazole sodium in pharmaceutical formulations and human plasma. Asian J Res Chem 2009;2(1):49-51.
7. Surve S, Patwari A, Patel J, Rathod I, Chhabria M. HPTLC and HPLC method development and validation for simultaneous estimation of rabeprazole sodium and levosulpiride in bulk and its pharmaceutical dosage form. Int J Pharm Pharm Sci 2013;5(3):65-9.
8. Pattanayak P, Sharma R, Chaturvedi SC. Simultaneous spectrophotometric estimation of rabeprazole sodium and itopride HCl. Anal Lett 2007;40(12):2288-94.
9. Saravanan G, Padmaja M, Geethanjali J, Visagaperumal D. Stability indicating RP-HPLC method for estimation of rabeprazole sodium and mosapride citrate in bulk and formulation. Int J Pharm Pharm Sci 2014;6(11):265-9.
Table 8: Specificity study for the synthetic mixture (LEVO: RBS=15:4) Mix Concentrated
(µg/ml) LEVO: RBS
λmax (nm) Before addition of excipients After addition of excipients % Interference
Absorbance Concentrated (µg/ml) Absorbance Concentrated (µg/ml)
1 30:8 255 0.5946 29.19 0.5935 29.06 −0.445
291.8 0.7019 7.41 0.7123 7.43 0.269
2 45:12 255 0.7611 44.1 0.7632 44.3 0.453
291.8 0.9251 11.5 0.9239 11.3 −1.739
3 60:16 255 0.9020 59.3 0.9053 59.5 0.337
291.8 1.1120 15.3 1.1153 15.6 1.96
4 75:20 255 1.0445 74.2 1.0491 74.5 0.404
291.8 1.3025 19.4 1.2785 19.6 1.03
5 90:24 255 1.1656 88.89 1.1695 89.2 0.348
291.8 1.5092 23.78 1.5391 23.8 0.0841
6 105:28 255 1.3377 104.2 1.3564 104.5 0.287
291.8 1.7069 27.6 1.6992 27.7 0.362
7 120:32 255 1.5162 119.2 1.5234 119.3 0.083
291.8 1.9479 31.7 1.9325 31.4 −0.946
Mean LEVO 0.209
RBS 0.145
RBS: Rabeprazole sodium, LEVO: Levosulpiride
Table 9: Assay of rabeprazole and LEVO
Formulation Label claim (milligrams) Amount
found (milligrams) Percentage assay±SD (n=3)
RBS LEVO RBS LEVO RBS LEVO
Synthetic mixture 20 75 19.76 74.4 98.25±0.2102 99.2±0.4031
Rabikind plus 20 75 19.76 74.66 98.69±0.1934 99.50±0.3093
RBS: Rabeprazole sodium, LEVO: Levosulpiride, SD: Standard deviation
Table 7: Recovery study (accuracy) in synthetic mixture S.No. WL (nm) Concentration of
solution (ppm) Standard added (ppm) Absorbance Amount found (mg) % Recovery Mean recovery±SD % RSD
1* 255 90 4.86 1.18 94.2 99.36 LEVO
291.8 24 1.28 1.59 25.1 99.41 99.28±0.1497 0.99
2* 255 90 4.86 1.17 94.1 99.58
291.8 24 1.28 1.58 25.0 99.33
3* 255 90 4.86 1.19 94.3 99.6 RBS
291.8 24 1.28 1.59 24.9 99.12 99.51±0.1331 1.00
10. Skoog DA, Holler FJ, Crouch SR. Introduction to UV Spectroscopy Principle of Instrumental Analysis. 7th ed. Bostan, USA: Cenage
Learnings; 2007. p. 301.
11. Beckett AH, Stenlake JB. UV-Visible Spectrophotometry: Practical Pharmaceutical Chemistry. 4th ed., Vol. 2. New Delhi: C.B.S. Publishers;
2001. p. 285-97.
12. Nadia DE. Preparation of drug sample for analysis. Handbook of
Pharmaceutical Analysis. New York: Marcel Dekker Inc.; 2002. p. 80-3. 13. Michael ES, Ira SK. Analytical Method Development and Validation.
New York: Marcel Dekker Inc.; 1997. p. 25-9.
14. Text on Validation of Analytical Procedure, Q2A in ICH Harmonized Triplicate Guidelines, October; 1994.