The Brimbank Spatial Map
of Physical and Social
The Australian Health Policy Collaboration sincerely thanks the members of the Project Management Group who contributed to the development of this report – The Brimbank Spatial Map of Physical and Social Infrastructure. The members are:
Prof Lyndal Bond, Population Health and Evaluation, Victoria University/Australian Health Policy Collaboration.
Prof Rosemary Calder, Director, Australian Health Policy Collaboration
Prof Max de Courten, Director, Centre of Chronic Disease, Victoria University
Prof James Dunbar, Director, Greater Green Triangle University, Department of Rural Health, Flinders University and Deakin University
Prof Kay Gibbons, Food, Nutrition and Dietetics, College Of Health and Biomedicine, Victoria University
Ms Deborah Law, Manager, Brimbank
Collaboration Development, Australian Health Policy Collaboration
Dr Andrew Mathieson, Lecturer - Public Health, Office of the Dean (College Of Health and Biomedicine), Victoria University
Mr Glenn Menner Coordinator Policy Advocacy and Research | Community Planning, Culture & Development, Brimbank City Council
Dr Samuel Muchoki. Health and Wellbeing Policy Officer | Community Planning, Culture & Development, Brimbank City Council
Mr Nathan Villiers, A/ Coordinator Policy Advocacy and Research | Community Planning, Culture & Development, Brimbank City Council
Dr Sarah Taylor, Data Scientist, RMIT University
About the author
Dr Sarah Taylor was commissioned to undertake the collection, processing, geovisualisation and analysis of different geographic data sets for the Brimbank Spatial Map of Physical and Social Infrastructure. She specialises in geographic information systems and its associated work with handling complex data sets and contributing to cross-disciplinary projects. She has previously worked as a Boundaries and Spatial Technology Officer at the Victorian Electoral Commission and as a Data Scientist for The Conversation. She currently works at RMIT Studios as a Data Scientist.
Suggested Citation
When referencing this report please cite as: AHPC. (2017). Brimbank Spatial Map of Physical and Social Infrastructure. Melbourne: Australian Health Policy Collaboration.
Cover Photo
J Medallada Photography (2013)
The AHPC is an independent health policy think tank. AHPC’s mandate is to translate the evidence of ‘what works’ to improve health outcomes in Australia and help reduce the impacts of socioeconomic disadvantage on health and chronic diseases in the population.
The AHPC works to improve the connection between research and policy through programs that bring together health experts, academics, researchers and policymakers and practitioners.
The AHPC has two major programs of work: • a national health and public policy strategy
to prevent and reduce the impact of chronic diseases in the Australian population; and, • Growing Brimbank, a long term, place
based program translating best evidence to interventions to lift the health and education outcomes and wellbeing in the Brimbank community, in western metropolitan Melbourne.
Diseases such as cancer, mental illness, cardiovascular disease, respiratory disorders and diabetes, have major long-term impacts on individuals, their families and their communities. The burden of chronic disease in Australia threatens to overwhelm the health budget, the capacity of health services and the health workforce. Much of that burden is preventable or capable of reduction through effective, evidence-based changes to policy. Yet Australia’s health policy priorities continue to focus on treating illness rather than preventing it, with investment in the prevention of chronic diseases significantly lower than the OECD average.
Preventive actions can reduce the disease burden for at-risk populations through driving healthy
Public policy can and should ensure that everyone has access to the opportunities that good health and a good start in life can provide and include: • Policy initiatives that promote a
population-wide approach to preventing chronic disease • Measuring health and education outcomes for
people and communities
• New models for health-funding, services and workforce
The case for investment in prevention and early intervention is well established in international and national evidence – and that is, that identified health and education risks in communities,
and in early years of the lifecycle, contribute to preventable and costly conditions in later life and can be prevented or ameliorated by early intervention both in childhood and across the life course. The return on investment outcomes include reductions over time in the social and economic impacts of preventable chronic disease on individuals, communities and the national economy. These are through both improved social participation and financial benefits in the lifetime of the Australian adult population (2008) estimated to be savings of $1.5 billion through reducing health sector costs and $0.8 billion through reducing workforce productivity losses and costs to households.
A critical component of the Growing Brimbank work is the development of fit-for-purpose resources and strategies to develop local capability: to enable better measurement and increased understanding of the risk factors for poor health and education outcomes within communities; and to develop, implement and sustain effective and efficient prevention and early intervention policy approaches and services
The Brimbank Spatial Map of Physical and Social Infrastructure forms part of a suite of foundation data in a trio of reports, which underpin the Growing Brimbank program. Uniquely, and in combination, these data now provide a comprehensive description of :
• a community’s priority health and development risk factors;
• the impacts in later life on social inclusion, productivity and wellbeing ; and
• the underlying factors driving poor outcomes – socio-economic inequities, low capacity and capability to make healthy choices; and poor access to physical and social infrastructure that promote good health and wellbeing.
Together the reports provide the resources and ‘tool kit’ for understanding the evidence of risk factors affecting the foundations for well-being and prosperity; for identifying the best evidence of ‘what works’ to redress or reduce the impact of those risk factors and the leverage points; for determining best value investments and for informing policy frameworks and service models to implement and sustain change both locally and for other communities.
This report quite clearly describes how the health and wellbeing of a community is dependent on effective and linked planning of: roads, infrastructure and transport; natural and built environment; regional equity and development; and community, sustainability and resilience.
This illuminates and adds critical value to the policy and long term planning roles of local governments, state and national governments in addressing the risk factors that particularly affect health and education outcomes in communities of socioeconomic disadvantage within Australia.
We intend that this report and the suite of tools that AHPC has developed will promote debate on where and how to invest in policy directions, based on evidence, and encourage real and timely local systems change to address socio-economic inequity associated with poor health and education outcomes.
Rosemary Calder AM
Executive summary . . . 7
Section 1: Context and purpose . . . 15
1.1 Purpose . . . 15
1.2 Background: The Brimbank Atlas of Health and Education . . . 17
1.3 Geographic Information Systems (GIS) and its relevance to health research . . . 20
1.4 Comparable studies . . . 22
1.5 More on the importance of the overlay of infrastructure . . . 23
Section 2: Brimbank in context . . . 25
Section 3: Method . . . 33
3.1 Method in brief . . . 34
3.2 How to read correlation outputs . . . 36
Section 4: Analysing selected Brimbank indicators using additional spatial datasets . . . 38
4.1 Self-assessed health status reported as ‘fair’ or ‘poor’ . . . 39
4.1.1 Summary box . . . 39
4.1.2 Self-assessed health status . . . 40
4.1.3 Correlations at Brimbank Population Health Area level . . . 41
4.1.4 Summary of correlations . . . 42
4.1.5 Maps . . . 43
4.1.6 Discussion . . . 51
4.2 Obesity . . . 54
4.2.1 Summary box . . . 54
4.2.2 Obesity . . . 55
4.2.3 Correlations at Brimbank Population Health Area level . . . 56
4.2.4 Summary of the correlations . . . 59
4.2.5 Maps . . . 60
4.2.6 Discussion . . . 74
4.3 Diabetes. . . 77
4.3.1 Summary box . . . 77
4.3.2 Diabetes . . . 78
4.3.3 Correlations at Brimbank Population Health Area level . . . 79
4.4.4 Summary of the correlations . . . 88
4.4.5 Maps . . . 89
4.4.6 Discussion . . . 97
4.5 Hospitalisations for ambulatory care-sensitive conditions . . . 99
4.5.1 Summary box . . . 99
4.5.2 Ambulatory care-sensitive conditions . . . 100
4.5.3 Correlations at Brimbank Population Health Area level . . . 101
4.5.4 Summary of the correlations . . . 103
4.5.5 Maps . . . 104
4.5.6 Discussion . . . 113
4.6 Children developmentally vulnerable on one or more domain . . . 116
4.6.1 Summary box . . . 116
4.6.2 Children developmentally vulnerable in one or more domain . . . 117
4.6.3 Correlations at Brimbank Population Health Area level . . . 118
4.6.4 Summary of the correlations . . . 120
4.6.5 Maps . . . 121
4.6.6 Discussion . . . 133
Section 5: Discussion . . . 136
5.1 Assets to work with . . . 136
5.2 Gaps and limitations . . . 137
5.3 Areas to focus on . . . 137
5.4 Concluding comments . . . 137
References . . . 139
Glossary . . . 144
Appendix A . . . 145
Method . . . 145
Relevant concepts in spatial data . . . 146
Different geographical areas . . . 146
Modifiable Aerial Unit Problem . . . 148
Combining features for correlation . . . 149
List of datasets . . . 150
How to read correlation outputs . . . 151
Appendix B: Correlation matrix of priority indicators . . . 153
This report –The Brimbank Spatial Map of Physical and Social Infrastructure – ‘The Spatial Map’ (2017) – is the third in a suite of reports that provides foundation data for the Growing Brimbank Program.
The Australian Health Policy Collaboration, in partnership with the Brimbank City Council, commissioned The Brimbank Spatial Map of Physical and Social Infrastructure (the Spatial Map) to profile the physical and social assets within the City of Brimbank (a municipality in the west of Melbourne) and identify the relationships between these and health and wellbeing status in the community.
A summary of the key findings is presented at the end of this Executive Summary.
Background
Physical and social assets within communities across Australia – such as health and community services, green canopy, recreation areas, childcare centres, food and alcohol outlets, sporting facilities and public transport – are significant influences on local individual and population health, development and wellbeing.
The Brimbank Atlas of Health and Education 2014 and The Physical Activity, Sport and Health in the City of Brimbank 20141 brought together
a comprehensive picture of the risk factors for health and education and indicators of social disadvantage in the City of Brimbank. They were critical in identifying foci for addressing the risks and system failure points for delivering change.
This new report, the Brimbank Spatial Map of Physical and Social Infrastructure, adds to previous reports by specifically and purposefully recognising
extent, and the fundamental role of community assets in reducing inequity.
The combination of these three reports provides the foundation data for the development of a long-term, place-based program to lift health and education in a disadvantaged community – Growing Brimbank – a joint enterprise of the Australian Health Policy Collaboration (AHPC) at Victoria University and the City of Brimbank. Growing Brimbank is based on a capability concept for the life course. This approach2 starts
from the premise that individuals have inherent capability to attain full social and economic participation and that these capabilities can be reduced by external factors such as economic, environmental and social risk factors, as well as familial and individual risk factors.
Pathways to good health and learning outcomes are interdependent and fundamental to both individual wellbeing and society-wide prosperity. The capacity of individuals to achieve optimal health, wellbeing and prosperity is an outcome of: • the availability of, and access to, basic goods,
services and public health assets; and • individual capabilities to make healthy
choices and achieve the best possible level of functioning.3
Combining our understanding of the risks and indicators with the community’s social and physical infrastructure is a key step forward in effectively addressing what are often seen as intractable problems.
An evaluation of the impact of evidence-based interventions in Brimbank, starting at the
commencement of initiatives, will use the baseline data from the three reports and measure progress
Why is it important to understand
the correlations between health
and wellbeing risk factors and the
location of infrastructure?
Health and wellbeing are dependent on the match of resources and services to individual and community capabilities and needs. Any mismatch in where we invest our finite resources hinders the achievement of good outcomes. More often than not the investment follows tradition and assumptions rather than evidence. Without detailed information and analysis, traditions and assumptions can drive inefficiencies and ineffectiveness.
This report contributes to an understanding of how community infrastructure can support improved capacity and capability to prevent or ameliorate risks for some Brimbank residents, but not others.
The Spatial Map clearly identifies that many of the risks and indicators for reduced capability to attain good health and wellbeing have similar patterns and interrelationships and mostly correlate with disadvantage measured by the Index of Relative Socio-economic Disadvantage (IRSD). Health and education outcomes tend to be correlated and have a tendency to be “wicked problems” (Kreuter et al. 2004) – that is, hard to untangle quickly, with no single solution apparent. Policy and services therefore need to recognise the multiplicity of economic, environmental and social risk factors and their combined influence on physical and mental health and wellbeing.
The Spatial Map contains an assessment of the relationship (correlations) between health and education risk factors and the locations of infrastructure in order to identify population groups at greatest risk of low or poor access and to identify others within the community with more capacity to access such assets. These correlations and locations help establish the intervention points, community strengths and vulnerabilities, and planning needs from which to address the multifactorial issues related to health and education outcomes in a socially disadvantaged community.
The term ‘risk factor’ in this context is used in preference to the long-established ‘social determinants of health’ to underscore the existence of opportunities to build the capacity to address risk, rather than to consider some conditions and consequences as pre-determined and potentially irreversible. Risk distribution among the population identifies the inequalities within communities, which are the underlying mechanisms influencing differences in individual and groupand wellbeing.
Who should use this report?
The Spatial Map is an important tool that enables individuals and communities, and policymakers and practitioners, to:
• access information about capacity and assets on which to build risk prevention and early intervention strategiesand adopt a strengths-based approach to change;
• frame how and where we can achieve
increased individual capability and community capacity to make healthy choices and efficiently access services for a secure and prosperous future;
• inform the design of policies, practices and cost-effective investments to improve health and education outcomes for individuals and communities; and
• understand and recognise the need for, and composition of, multidisciplinary work to connect geographical information, health outcomes, and policy around inequity in order to both influence planning and determine impact on health.
Method in brief
This project was designed to identify and map Brimbank-based physical and social infrastructure that contributes to or affects the risks for
individual’s health and wellbeing (see Section 3, main report).
The Spatial Map combines health and education measures from The Atlas with a range of publicly accessible and replicable information on the social and physical features and infrastructure within Brimbank that can support individual capability and community capacity for health and wellbeing. This concept is shown in the diagram below.
Geographic Information Systems (GIS) formed a key component of the methodology. By combining the two sets of information above using GIS, the following were produced:
• maps of location and distribution of features; and • correlation results (measurements of the
strength of the relationships between features and outcomes).
The elements of physical and social infrastructure explored were those most likely to:
• promote better health and wellbeing (such as good nutrition and social inclusion) or ameliorate risks;
• environmental features that promote wellbeing (contour variation, parklands, tree canopy); • availability (numbers) and proximity (coverage/
distribution) of a range of services and
providers of food, leisure-time physical activity, and learning and development;
• community and neighbourhood supports and groups; and
• out-of-hours availability of some services.
Maps of infrastructure overlaying a health or development outcome or indicator are used to graphically identify associations between the location of different features and the geographic variations in health and education outcomes within Brimbank. The correlations are quantitative measures of these patterns, revealing the extent of association between a health outcome and a specific feature. A correlation is either:
• positive – higher rates of better health and development outcomes are associated with greater access to a feature promoting health and development; or
• negative – higher rates of poor health and development outcomes are associated with less access to a feature.
The bulk of maps and correlation results were produced at Brimbank Population Health Area level (PHA), a geographical area specifically used for Australian health data. Where possible, Melbourne-wide maps were added for context and comparison.
Supporting technical information for TheSpatial Map, such as spatial metadata and a list of spatial data items, will be lodged on the AHPC website.
How we used GIS
Overlaying the concentration of physical and social features on the geographical distribution of health and development outcomes tells us:
• where patterns of presence or absence of particular features occur in association with risks to health and education; and
• how many particular feature types are found in an area (coverage);
• how close, on average, residents are to various features (proximity);
• the variation between areas; and
• the strength or extent of those associations (correlations).
Additionally, by blending features – such as fast food outlets, parks and public transport – over a specific outcome such as obesity, we built the picture that helps us describe the ‘many different Brimbanks’ or subpopulations and the multifactorial nature of the problem.
How to use The Spatial Map
Sections 2 and 3 of this report provide detail about context and methodology.
Section 4 of The Spatial Map (Analysing Selected Indicators), presents six key health and wellbeing indicators. These are self-assessed fair or
poor health (4.1), obesity (4.2), diabetes (4.3), psychological distress reported as ‘high’ or ‘very high’ (4.4), hospitalisations for ambulatory care-sensitive conditions (ACSCs) (4.5), and children developmentally vulnerable on one or more domains in the Australian Early Development Census (AEDC) (4.6).
Each indicator has:
1. a summary box of findings and contextual data; 2. a description of the risk factor or indicator
based on TheBrimbank Atlas of Health and Education (2014);
3. correlation tables (positive and negative ) and a summary
4. maps by area and subpopulations (PHA level) with overlays demonstrating the distribution of infrastructure; and
5. discussion, including literature on the topic and possible implications.
Conclusion
The Brimbank Spatial Map of Physical and Social Infrastructure reflects the interaction between social and physical environments and the health and wellbeing of individuals. This report presents maps and correlations in a narrative format in order to tell Brimbank’s particular story of diversity and capacities.
individuals and social and economic participation, particularly in disadvantaged communities.
Interventions for poor health and wellbeing are increasingly being developed and delivered in non-traditional settings and models (community health care services, parks, greengrocers and schools, volunteer organisations and leisure centres). These and other assets identified in this report are valuable agents for good health and community resilience.
The findings will assist the Brimbank City Council in its application of policy regulation and planning to support optimal health, development, wellbeing and education outcomes.
The analysis of the health, wellbeing and education impacts of the social and physical infrastructure identified in this report will be a further stage of work with partners to the Collaboration, underpinning the Growing Brimbank program.
Key findings
The findings describe both generalised patterns and patterns specific to particular risk factors.
Generalised patterns
• There are ‘many different Brimbanks’
(subpopulations) described by their community infrastructure, population density, health and education outcomes, cultural diversity and levels of socio-economic disadvantage.
However, people living in specific geographies do not have the same characteristics (Ess and Weeks 2001).4 In Brimbank specifically,
the recognition of the diversity of strengths and wealth of cultural resources (as well as vulnerabilities and needs) is vital for the identification and leveraging of assets within communities to redress risk factors affecting the community. The social infrastructure
• The connection between socioeconomic status (SES) and the selected health and development outcomes is recurrent and striking.
The pattern of correlations between poor health status and socio-economic disadvantage is repeated through the report. For example, self-assessed fair or poor health, female obesity, psychological distress and diabetes have very similar (but not identical) correlations with socio-economic disadvantage.
People with poor health and development outcomes tend to live in areas of low socio-economic advantage where the infrastructure includes:
• more bulk billing GPs, dentists and pharmacies;
• more flexible learning centres (tailored programs for disadvantaged young people); • greaternumbers of, and proximity to;
• takeaway or fast food outlets (compared to access to major supermarkets and shops selling fruit, a proxy for fresh food availability);
• packaged liquor licenses;
• licensed clubs and poker machines; • fewer playgrounds, pets, indoor play
centres, trees per person, conservation zones, drinking fountains and bike trails, and women’s gyms;
• less residential proximity to walking school bus stops; and
• more cultural supermarkets.
Clearly, some support services move to where the ‘needs’ are, but others do not. Some commercial services are more densely distributed in community areas with lower socio-economic status.
of this section). Equally, the features (or their absence) known to be associated with poor outcomes appear to be more prevalent in this band of entrenched disadvantage.
• Some comparisons are more informative when made to Greater Melbourne or Victoria, rather than with subpopulations in Brimbank.
• Some features are so pervasive in the community that there is not sufficient variation within Brimbank to show any correlation between the infrastructure or feature and health and development outcomes. However, this lack of correlation does not mean that the features should be ignored when planning for better outcomes. Examples are:
• the distribution of poker machines and liquor licenses is uniform across Brimbank, and thus cannot be identified as significantly correlated with specific health risks. However, their coverage and proximity to other community characteristics need to be understood for planning purposes; and
• while healthy food choices are relatively available in some parts of Brimbank, takeaway fast food stores are ubiquitous throughout the community.
• By comparing the distribution of poker machines, liquor licences and takeaway fast food stores in Brimbank with those in Greater Melbourne, it is clear that there are strong correlations between the prevalences of these outlets and poorer health outcomes.
• Some generalised assets within Brimbank are: • the even distribution of Brimbank City
Council facilities contributing to health and wellbeing (libraries, maternal and child health centres, leisure centres, playgrounds and sports fields);
• presence of fresh food outlets, cultural and major supermarkets (although major supermarkets are less prevalent in St Albans); • no obvious shortages in access to primary
health care providers, and a high number of general practitioners located in the most socioeconomically disadvantaged areas of Brimbank; plus
• areas with high health and education needs in Brimbank tend to have many community groups, kindergartens, and schools
provided by a mix of government and not– for-profit organisations.
Specific patterns
1. The ‘many different Brimbanks’ can be characterised by their IRSD scores.
Brimbank overall 926
Keilor PHA 1055
Ardeer and Sunshine West PHAs 882
St Albans / Sunshine North 839
2. Five of the six health indicators assessed – self-assessed fair or poor health, obesity, diabetes, psychological distress reported as ‘high’ or ‘very high’, children developmentally vulnerable on one or more domains in the Australian Early Development Census (AEDC) – are all strongly correlated with each other, and with:
• health risks such as harmful use of alcohol and male smoking;
• contextual indicators of low SES such as; • children living in jobless families; • mothers with low educational
attainment;
• adult unemployment;
• people aged 15 years and over living with a disability;
• no internet connection at home; • low-income households under financial
stress; and
• low-income households with children developmentally vulnerable in one or more domains of the AEDC.
3. Ambulatory Care Sensitive Conditions (ACSCs) can be a good litmus test of access to early intervention, and were not a part of the above pattern.
and asthma in 0–15-year-olds and cardio-respiratory and diabetic conditions in adults, and are areas which enjoy relatively better socio-economic circumstances (higher IRSD). There are fewer GP services with late opening hours per capita in areas where higher rates of hospitalisation occur, such as Keilor compared to St Albans and Sunshine, but for both adults and children the association with late-opening GPs was weak to moderate.
4. Natural assets are concentrated in the
relatively advantaged areas of Brimbank, such as Taylors Lakes and Keilor Downs. There is greater access (a positive correlation) to features like open spaces with trees, bike paths, drinking fountains and parkland area conservation zones, tree canopy, playgrounds and bike and walking trails associated with better health outcomes.
5. Sports facilities and courts are much more highly concentrated in the PHA of Keilor than in Delahey and Cairnlea, PHAs closer to the ‘band’ of disadvantage previously identified. 6. Some PHAs and suburbs with poor health and
education outcomes stand out in relation to: • fewer neighbourhood groups. There are
fewer neighbourhood groups in Sunshine, which has a high proportion of children who are developmentally vulnerable in terms of their social competence, emotional maturity and/or communication upon entry into school;
• residences with greater proximity to packaged liquor licenses and fewer gyms. St Albans and Kings Park have many packaged liquor licenses and fewer gyms and the highest estimated rates of obesity in women; and
• fewer GP services with late opening hours per capita. As previously noted Keilor, Keilor Park and Taylors Lakes PHAs have
7. Where there are higher rates of poor health and development outcomes (Sunshine West and North, St Albans, and Kings Park), we see less access to features (negative correlations) such as:
• public and commercial physical activity / fitness centres / gyms;
• walking to school bus stops; and • contour variation; and public toilets.
8. High volume roads and train lines divide sections of Brimbank and potentially influence the health care that residents can access. Such correlations give rise to questions to be explored; examples are whether ‘very high volume traffic’ within Keilor is related to ACSCs, and whether poor access to the nearest Leisure Centre for residents of Kings Park and Delahey PHAs drives the high rates of female obesity.
9. Privately run services like gyms (especially women’s gyms), swim schools and children’s indoor play centres are significantly less prevalent in the more disadvantaged areas of Brimbank such as St Albans and Delahey, where there are higher rates of female obesity, poor self-assessed health and childhood developmental vulnerability.
1.1
Purpose
This report – The Spatial Map of Physical and SocialInfrastructure – commissioned by the Australian Health Policy Collaboration (AHPC) presents an innovative approach to existing data on health and wellbeing for a geographically defined community.
The report is focused on the City of Brimbank in the western metropolitan region of Melbourne. It examines the relationship between significant social and physical infrastructure assets in the Brimbank community and measures of poor health and education outcomes or risks for poor health and education outcomes in the community.
The City of Brimbank and the AHPC have established the Brimbank Collaboration, a joint commitment to a long-term, place-based program applying evidence-based interventions to address risk factors for poor health and wellbeing in a community with significant levels of socioeconomic disadvantage.
The City of Brimbank is a large local government area (LGA). It is culturally diverse, with residents speaking more than 150 different languages, about 43% of the population born overseas, and more than half the population speaking a language other than English.
The LGA reflects the myriad of policy issues and barriers associated with a rapidly growing region undergoing substantial economic and social change.
Two foundation reports for the Collaboration were published in 2014:
• The Brimbank Atlas of Health and Education, and
with a geographical approach, and specifically the use of Geographic Information Systems (GIS).
This approach is critical to identifying the profound impact of the environments in which people live on their health and wellbeing, and the fundamental role of community assets in reducing inequity.
The key outputs presented in the report are maps and correlations representing the strength of relationships between health outcomes for residents of Brimbank and a range of assets within the City of Brimbank that constitute the everyday environment for its residents – from schools to transport options, libraries, food outlets and health care providers.
Not all features of Brimbank are included, but many different features are combined into the maps and correlation tables. The patterns in these features can help to inform thinking on questions like: Does poor health relate to poor physical access to health care providers in Brimbank? Does obesity relate to a lack of local healthy food options?
The maps and correlations do not present answers, but they can help present new perspectives on public health challenges. Many public health issues are, on the one hand, complex and multifaceted, but on the other hand, geographically stark: irrespective of the complexity of overlapping factors, rates of health indicators like diabetes, obesity, hospitalisations for ambulatory care-sensitive conditions (ACSCs – conditions that could be expected to be well managed with primary or community-based care, thus avoiding unnecessary hospitalisations), and psychological distress are higher in Brimbank than in many other parts of Melbourne.
Recognising this, the Brimbank Atlas of Health and
A place-based (ie. geographical) approach has already brought new insights to many areas of public health (Australian Institute of Health and Welfare 2011, Christian et al. 2015, Cummins et al. 2007, Dorling 2013, Jones et al. 2007, Lakerveld et al. 2016, Moodie & Taylor 2012).
Some researchers describe the different perspective that geography can bring to public health as the “public health macroscope” (Rydin et al. 2012). This refers to the fact that many health issues are not adequately studied under a microscope alone or by a focus on a subset of affected individuals. There is a risk of losing sight of a true understanding of the subject if we ignore patterns that interact with genetics and individual behaviours. A prominent example is the current obesity trend; the rapid growth and uneven distribution of this chronic health problem is difficult to understand through a focus on individuals.
In addition, the overlay of maps, featuring different spatial aspects, provides an increasingly probing and informative picture. For example, a map of hospitalisations for ACSCs indicates high rates in Taylors Lakes and Keilor. When the features of high-volume traffic, distribution of bulk-billing GP surgeries, pharmacies and dentists, and late-opening GP surgeries are overlaid, the relationships between these infrastructure assets and the hospitalisation data (the correlations) suggest they contribute to the high rates.
GIS is noted for its ability to bring together many different data sources at multiple levels (including the ‘macrosope’). The use of GIS in this report is intended to:
• identify information that individual data, in itself, does not provide;
• augment an understanding of health and wellbeing outcomes in Brimbank;
• highlight potential connections between features and assets in the local environment contributing to health and wellbeing outcomes in Brimbank; and
• contribute to policy information and interpretation of the relationship between health and wellbeing outcomes and community environments and assets.
GIS can act as a “glue” or “catalyst” in
multidisciplinary research (Knigge & Cope 2006, Brown & Knopp 2008). A multidisciplinary, collaborative and policy-focused approach to public health has been advocated in recent Australian research:
Multidisciplinary research teams … can close the gap between researchers and policymakers by increasing the policy relevance of the research …[and] increase attention to health in decision-making about the built environment. (Giles-Corti et al. 2015)
This report is intended to be useful to urban planners, for systems and logistics planning, as well as for social and health services provision and planning.
It contributes to a comprehensive profile of the health and wellbeing of the community of Brimbank, and the potential relationships between health and wellbeing and community physical and social infrastructure.
For policymakers, as well as health and community service providers working in communities such as Brimbank, targeted information on distribution of supply and patterns of access and demand related to socio-economic and environmental factors that affect health and wellbeing is critical.
The Australian Health Policy Collaboration
AHPC is a policy translation think tank that aims to inform and influence health and public policy nationally and locally, through the application of evidence about ‘what works’ to address specific risk factors for poor health and education in communities with significant socioeconomic disadvantage.
AHPC does this through two integrated programs: 11. a research translation program to inform and
influence policies to prevent and reduce the impact of chronic diseases on the health and wellbeing of the Australian population 12. the Brimbank Collaboration, a community
1.2
Background: The Brimbank Atlas
of Health and Education
The Brimbank Atlas of Health and Education was prepared in 2014 by the Public Health Information Development Unit (PHIDU).
The Atlas is a compilation of nationally accessible and consistent data on a range of health,
wellbeing and education outcome risks and indicators of socio-economic disadvantage within the City of Brimbank.
It brings together health, wellbeing and education data relevant to Brimbank from a range of sources, and presents them as comparative tables, small maps, and correlation results, interwoven into separate thematic discussions (Figures 1 and 2).
This report complements the Atlas, and responds to some of the significant patterns of health and wellbeing of individuals within Brimbank highlighted in it.
Data in the Atlas were drawn from a variety of national collections, particularly the 2010 General Social Survey (Australian Bureau of Statistics (ABS) 2011), the 2011 Census of Population and Housing (ABS 2012) and the Australian Health Survey 2011–12 (ABS 2012).
Data for this report were drawn from the Atlas (see Figure 1.1) and additional spatial datasets that are not specifically about health or wellbeing but describe assets and deficits in Brimbank.
The process of combining the health, wellbeing and social data (The Brimbank Atlas, 2014) with geographical, social and physical infrastructure information (the spatial data sets) allows the reader to:
• visually identify areas of concentration of risks and variations in access to resources, in association with poorer health and wellbeing outcomes; and
• assist in developing questions and/or answers about why these outcomes exist by overlaying the distribution and concentration of several assets, thus ‘building the picture’. It is often the overlay of additional features or characteristics that reveals potential explanations, not
considered at first review of the data.
The data in The Brimbank Atlas of Health and Education was divided into two groups of indicators (summary measures of chosen events derived from data collections that record all cases or a representative sample of the events in a population).
These two groups are: 1. Contextual indicators
For example, labour force participation, English proficiency, housing stress, socio-economic disadvantage, and the percentage of children under 15 years of age living in families where no parent has a job.5
The direct indicators in The Brimbank Atlas of Health and Education were compiled from multiple primary sources, including the Australian Early Development Census (a periodic survey of school readiness for all first year students), Victorian Department of Health hospital admissions data, and the 2011–13 Australian Health Survey and 2010 General Social Survey conducted by the Australian Bureau of Statistics.
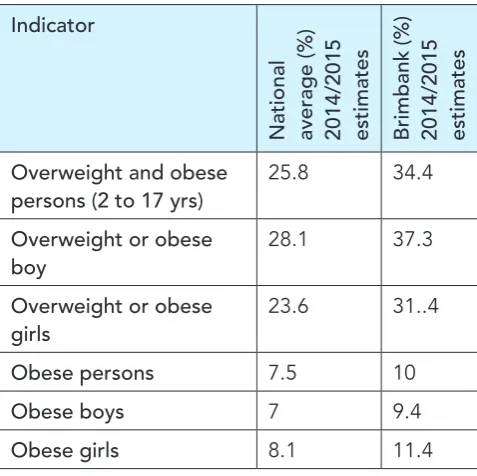
On some indicators, Brimbank data stand out when compared to Melbourne or Australia. For example, Brimbank has high estimated rates of female obesity and hospitalisations for ACSCs
For example, the rates of psychological distress for males differ in Sunshine (13.2 per 100 population), Keilor (10.7 per 100) and Brimbank overall (12.0 per 100), although all exceed national rates.
This Spatial Map focuses on health and wellbeing indicators that show marked differences between Brimbank and Australian averages, as well as strong differentiation within Brimbank. Through the use of GIS, the investigation sought to discover: • where health and wellbeing factors vary within
Brimbank, and the connections to other factors and influences; and
• the relationships between health and wellbeing variations and availability of local assets that support health and wellbeing.
1.3
Geographic Information Systems
(GIS) and its relevance to health
research
Geographic Information Systems are a
combination of geographic data and information systems. The term GIS is most often used to refer to the use of particular software packages that enable the combination of table data with map data (see image below). However, GIS is not a software-specific research tool.
Spatial data – the core of GIS – refers to any data that can be represented on a map. This includes many features of everyday life and the environment, such as addresses, flora and fauna, and population data from different suburbs, states, or countries.
In practice, use of GIS has traditionally been concentrated in particular research areas such as environmental science, transport, urban planning and demographic modelling. Use of GIS in less traditional research areas has expanded since the early 2000s (Gibson et al. 2010, Kwan 2002). This is due in part to decreasing costs of GIS software, which in the 1980s and 1990s were affordable only to large organizations and the military, and also to the “spatial turn”(Withers 2009), a term for researchers in diverse fields integrating location in their work.
GIS can augment and inform new research by being an effective communication tool, a way to bring together different data sources, and a way to understand underlying processes better.
Since power is often spatially mediated and reinforced – through property boundaries, legal jurisdictions, access to public and private space and so forth – integrating location can add much to social research (Massey 2005).
Health is one of the research areas in which GIS has found many more applications since the early 2000s (Barton & Grant 2006, Cummins et al. 2007, Dorling 2013, Geraghty et al. 2010).
This report, together with The Brimbank Atlas of Health and Education (2014), enables a deeper understanding of opportunities for risk mitigation, community development and enhancement. Together these reports provide a platform from which to direct further exploration and research, to inform planning principles addressing equity, and to inform policy and practice strategies and services.
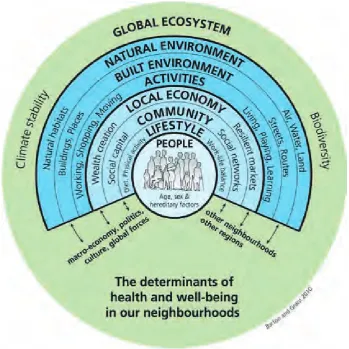
The ‘health map’ diagram below (Barton & Grant 2006) is one of numerous frameworks that conceptualise health as a set of overlapping factors. Such frameworks are naturally complex, but they move beyond single-issue health responses and are suited to understanding 21st
Factors that can affect health outcomes operate at different scales. It is important, therefore, to acknowledge that local community influences on health and wellbeing are a part but not the whole picture of the influences that can promote or inhibit good health and wellbeing in individuals. Other influences operate nationally, regionally and within specific community groups.
The purpose of Figure 1.3 is to illustrate the role of working across and within Brimbank and its communities to lift health and education
What can Geographic Information Systems tell us?
Data from GIS can help to highlight patterns that would be extremely difficult to reveal with other data forms. This can give a ‘forest through the trees’ perspective, highlighting connections between datasets. Alternatively, data from GIS can demonstrate that there is no apparent spatial pattern; this is informative in itself.
Maps can be a very efficient means of conveying complex information. Spatial statistics (numbers
Figure 1.3 The health map (Barton & Grant 2010)
What can Geographic Information Systems not tell us?
Data from GIS can provide clues to underlying processes by highlighting where patterns occur, but theycannot explain why.
GIS statistics can indicate correlation, not causality. Used well, GIS data are a stepping stone to further inquiry or research, rather than the end point (Chrisman 2005, Gordon 2011, Kwan 2002).
Particular challenges apply to using GIS in health research. This is explained in more detail in the Method section, Appendix A.
1.4
Comparable studies
In health research, GIS typically forms part of an interdisciplinary approach. This is because, firstly, GIS was not developed as a health research tool, and secondly, GIS is noted for its ability to bring together multiple data sources that have location in common (Brown & Knopp 2008, Knigge & Cope 2009).
While GIS is not a standard tool in health research, its use is growing. For example, in April 2016 the Association of American Geographers hosted a four-day seminar on GIS and related technologies in health research, referred to as a “frontier”.6
Sessions covered a wide range of GIS applications in health, including:
• spatial approaches to improving maternal and child health;
• urban temperatures and shade provision; • socio-economic status and urban health; • healthcare services: access and participation; • measures of spatial access to urban green
spaces; and
• spatial statistics and disease mapping.
These diverse health topics were brought together through geography – asking “where?” to better understand “why?” in health measurement and research.
6 www.aag.org/cs/AM2013/GIS-Frontier
7 www.journals.elsevier.com/health-and-place/
More evidence of how use of GIS in health has grown comes from the journal Health & Place,7
established in 1995 as “an interdisciplinary journal dedicated to the study of all aspects of health and health care in which place or location matters”. Recent article titles include:
• The interplay between neighbourhood
characteristics: The health impact of changes in social cohesion, disorder and unsafety feelings; • Natural and built environmental exposures on
children’s active school travel: A Dutch global positioning system-based cross-sectional study; • Changing spatial patterns and increasing
rurality of HIV prevalence in the Democratic Republic of the Congo between 2007 and 2013; and
• Rural tobacco use across the United States: How rural and urban areas differ, broken down by census regions and divisions.
GIS in health research is not an entirely new phenomenon: John Snow’s famous resolution of a cholera outbreak in 1854 relied on geographic information in much the same way as researchers today, albeit without computers. In this case, maps gave new perspective on where health problems were occurring (cholera deaths near particular water pumps), but it was up to researchers to analyse why these spatial patterns were occurring (sewage-contaminated drinking water).
Physical proximity to a source of infection is a fairly obvious spatial contributor to disease. The extension of GIS to chronic disease management is relatively new, but much in demand due to the prominence of chronic diseases in 21st century
industrialised nations (Moodie et al. 2016).
For example, some researchers have sought to use it to improve understanding of the social and environmental drivers of diabetes (Curtis & Lee 2010, Geraghty et al. 2010, Kruger et al. 2008, Ranta & Penttinen 2000) and the complex set of factors that determines access to health services (Hiscock et al. 2008, Todd et al. 2015).
geography is also related to economic trends; he emphasises the links between health, spatial disparity, and widening economic gaps (Dorling 2009, 2013).
This Spatial Map presents results that are comparable to, and complement, The Brimbank Atlas. The data presented in the Atlas was drawn from national data collections, primarily between 2011 and 2012.8 This report then combines
data drawn from a range of Brimbank, Victorian and national data collections from more recent collections up to 2015.
The data are therefore not necessarily consistent over time, although the intervals between collections are not substantial. The Spatial Map combines different pieces of information for common locations and outputs maps and correlations. It combines a variety of datasets that are not necessarily health-related but illustrate, and sometimes illuminate, the geographical patterns of risk factors and health, wellbeing and education outcomes within the Brimbank community.
1.5
More on the importance of the
overlay of infrastructure
As previously stated, it is not sufficient to study health issues on their own or by a focus on a subset of affected individuals.
Understanding the patterns of health and wellbeing of individuals and of communities requires more than attention to measures of individual and community health and wellbeing, as poor health and wellbeing and good health and wellbeing have been shown to cluster in communities of socioeconomic and other advantage and disadvantage.
This report considers the physical and social infrastructure within the community of Brimbank that show patterns of relationship with the patterns
geographical distribution of the risk factors to health and wellbeing that are significant in the Brimbank community.
By blending map features, we measure:
• how many of a particular feature type are found in an area; and
• how close (on average) residents are to various features.
This literally allows us to ‘build the picture’.
Let’s take the example of this report’s sixth risk factor – developmentally vulnerable children. St Albans/Sunshine Nth and Delahey PHAs have larger numbers of the most vulnerable children are in Brimbank (Map 4.6.2) compared to Melbourne Population Health Areas (PHAs) (Map 4.61).
Thus, the focus of this section is to explore the contribution of environment, geography and topography to the vulnerability of children; physical and social infrastructure assets that have strong correlations with health risks are identified through the mapping of both together (overlaying).
To explore the contribution of environment, geography and topography to the risk factor in our target areas, the following factors with strong correlations are overlaid:
Map 2.4 page 31 –tells us that our target area of St Albans PHA has some industrial areas in close proximity to the dense residential areas.
The GIS information tells us about the relationship of access to important assets in childhood
development and childhood vulnerability. For example:
• kindergartens and preschools (Map 4.6.3); and • playgrounds and flagship parks (Map 4.6.6)
Within easy travel distance from our target PHAs, there are no :
• libraries or toy libraries (Map 4.6.5) ; or • indoor play centres (Map 4.6.8) and private
swim schools and aquatic centres (Map 4.6.9).
Late-opening GP surgeries (Map 4.5.7) on the border between St Albans North and Delahey or Keilor and St Albans and Sunshine are available, but by no means numerous.
For any of these childhood services, access may be hampered because of:
• the density and intersections of main arterial roads and accident black spots (Maps 4.6.11, 4.5.6);
• lack of alternative options to public
transport such as ’walking school bus stops’ (see section 2, Map 2.5); and
• relatively few off-road bike paths (Map 4.6.12) leading to the few playgrounds (Map 4.6.6) in our target areas, compared to other PHAs.
The strong inverse correlations with conservation zones / parkland / trees per person / contour variations are starkly revealed in these two PHAs by maps:
• 4.5.3, where low elevation topography is evident;
• 4.2.10, showing relatively little parkland in either PHA; and
• 4.1.4, showing poor distribution of trees (public space and street) in Sunshine North and half of Delahey.
There is relatively good access to primary schools in St Albans but less access in Delahey PHA (Map 4.6.7).
However, more disturbingly, the positive correlation of packaged liquor licenses to childhood vulnerability (.947**) is strong, as demonstrated by their even and frequent
distribution in these two PHAs, as well as the rest of Brimbank. Packaged liquor licenses are relatively nearby to schools in St Albans (Map 4.6.10).
Flexible Learning Centres (Map 4.4.5) appear to be well placed within St Albans, in proximity to an area of high childhood vulnerability.
This suite of reports is the foundation to Growing Brimbank:
• The Brimbank Atlas of Health and Education 2014, Public Health Information Development Unit (PHIDU)
• Physical Activity, Sport and Health in the City of Brimbank (2014), the Institute of Sport, Exercise and Active Living, Victoria University
This chapter provides a brief introduction to the City of Brimbank.
Brimbank is large: the City of Brimbank was established in 1994 after the merger of the former Cities of Keilor and Sunshine; it spans 123 km² and had an estimated population of 199,432 in June 2015.
Brimbank comprises 25 new and established suburbs. Much of the recent residential growth has been in Delahey, Sydenham, Taylors Lakes, and more recently in Cairnlea.
In recent years the highest growth of population occurred in 2009, declining marginally each year since. It is the second most populous municipality in metropolitan Melbourne (after Wyndham, the largest in the Western Region), and incorporates one of the largest industrial areas in Melbourne.
Brimbank is relatively disadvantaged: the City of Brimbank scored 925.8 on the index of socio-economic disadvantage (IRSD), making it one of the 10 most disadvantaged capital city LGAs in Australia. The most disadvantaged communities are in central and southern parts of Brimbank, and the most populous suburbs are St Albans (IRSD = 839), Sunshine (894), followed by Keilor Downs (961).
Brimbank is culturally diverse: about 42% of
Brimbank’s population were born overseas (of which about 7.1% are recent arrivals – more than twice the Australian average); more than half the population speak a language other than English, and more than 150 languages are spoken. Recent migrant and refugee arrivals (since 2007) from countries in which English is not the predominant language are not a homogenous group; the most rapidly growing groups are from Asia and Africa. Close to one in every 11 people in Sunshine is either a recent
Brimbank has experienced rapid growth and substantial economic and social change: substantial migration into Brimbank has occurred in phases, after WWII and again in the 1970s and 80s, but there has been relatively low investment in infrastructure to meet these challenges to ensure a thriving community. Migration out of Brimbank is also substantial: 41% of residents moved out of the City between 2006 and 2011.
There is a high proportion of jobless families in the City of Brimbank – twice the Melbourne average. As a result, government support is the main source of income for almost twice as many families in the City of Brimbank as in Melbourne and Australia overall. Manufacturing is the largest employer, accounting for 12,661 local jobs in 2014/15. In 2011, 34.3% ofthe workforce lived and worked in Brimbank. The percentage of employed citizens in thepopulation rose from 39.3% in 2011
to 45% in 2015 (.id Social Atlas for Brimbank at http://atlas.id.com.au/brimbank).
Brimbank is home to major institutions, including Sunshine Hospital and Victoria University’s St Albans and Sunshine campuses.
Many resources describe the characteristics of Brimbank:
• resources on The Brimbank City Council website;9
• the .id social atlas portal for the City of
Brimbank,10 which presents detailed Census of
Population and Housing data in an interactive map; and
• the Brimbank Atlas of Health and Education, which includes an historical timeline of events in the Brimbank area (pages 4–6) and a demographic profile of the City of Brimbank (pages 50–52).
Why Brimbank?
The City of Brimbank reflects the myriad of policy issues and barriers associated with a rapidly growing region undergoing substantial economic and social change. Brimbank is a region on the urban edge with a long history of manufacturing industry development and subsequent de-industrialisation. Despite a substantial population of postwar immigrants and a fast-growing population of more recent migrants and refugees, there has been relatively low investment in infrastructure to meet these challenges to ensure a prospering community.
Map 2.3 Index of Relative Socio-economic Disadvantage by PHA, Brimbank
Map 2.4 Residential and Industrial Zones in Brimbank, with guide suburb labels
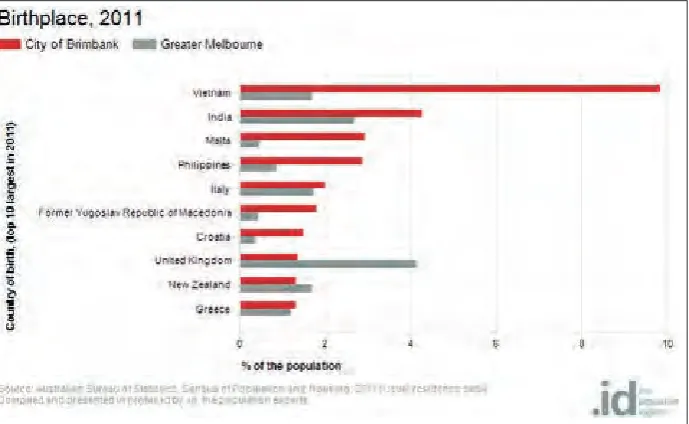
Figure 2.1 Cultural diversity of the migrant population in the City of Brimbank by Birthplace
Figure 2.2 Change in religion, City of Brimbank, 2006 to 2011
• 84,285 people who were living in the City of Brimbank in 2011 were born overseas, and 20% arrived in Australia within the five years prior to 2011.
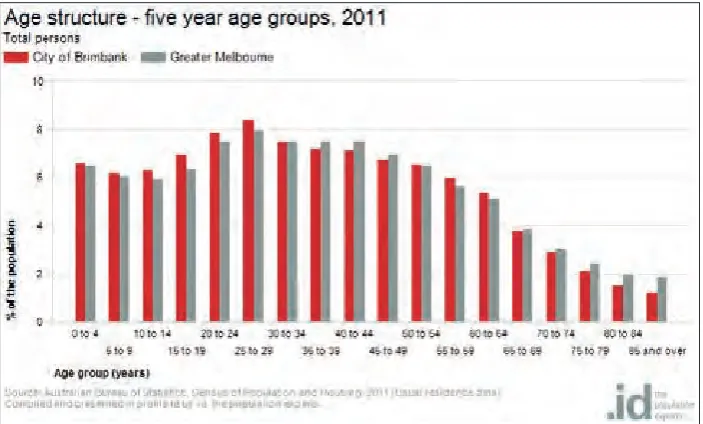
Figure 2.3 Age structure by 5-year age groups in Brimbank, 2011
Map 2.5 City of Brimbank Public Transport and Major Roads
Section 3:
Method
This section provides a brief description of the methods of processing and analysing the data captured in this report, and of some relevant concepts in spatial data to aid interpretation of the results in Section 4. The descriptions are intended for newcomers to spatial data. The relevant concepts in spatial analysis, datasets and items used, and more detailed information on how to read correlation outputs, are
contained in Appendix A.
3.1
Method in brief
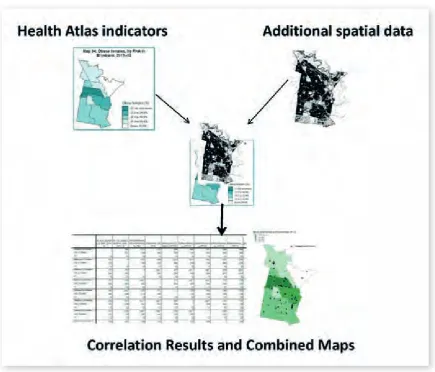
The diagram above (Figure 3.1) shows the basic concept of the methodology.
Two main groups of data were collected, combined based on location, then presented as correlation results and combined maps.
The two main groups of data were:
1. Selected indicators of health and wellbeing The set of health and wellbeing indicators used are drawn from the Brimbank Atlas of Health and Education (2014), and are downloadable from the PHIDU website.
(NB. The summaries of correlations for each risk factor are presented in the past tense, reflecting the timing of the data collections used, such as the Australian Census 2011 and the plans for revision as new data becomes available)
2. Social and physical infrastructure assets and features within Brimbank
AHPC identified local community assets (and deficits) that could be relevant to health and wellbeing outcomes. The accessible spatial datasets included food outlets, kindergartens, sports fields, public transport, accident black spots and commercial fitness providers.
The aim of this process was to provide visual and statistical information on how place (features and social and physical infrastructure) and
circumstances in which people live have a bearing on their health and wellbeing outcomes.
Correlation results and maps can visually highlight patterns, or in some cases the absence of patterns, especially when maps are combined to show the overlays and associations of features.
Blending map features to produce correlation results allows us to see coverage and proximity as separate measures of access to features.
Coverage measures how many of a particular feature type are found in an area. For example, bus stops per person, or bulk billing doctors per person.
Proximity measures how close (on average) residents are to various features – for example, proximity of libraries to residences.
Coverage and proximity measures are listed in Appendix A.
The primary purpose of exploring coverage and proximity was to measure variation betweenPHAs.
Together these measures inform thinking on the health and wellbeing indicators from The Brimbank Atlas of Health and Education. In particular, they assist in answering the following questions: • are there concentrations of assets or deficits
in particular areas? and
• are there possible connections between datasets?
In this way, health and wellbeing data can be considered and explored alongside indicators of the prevalence of features. For example, rates of smoking and obesity can be portrayed alongside the number of take-away food outlets and open space trees per person in each Brimbank PHA.
A note of caution: the correlation results were generated at PHA level – the smallest geographical area at which the health and wellbeing indicators are reported. However, this level of correlation results is approximate (without being unreliable) and must be interpreted together with the maps (and combined maps) and the written discussion.
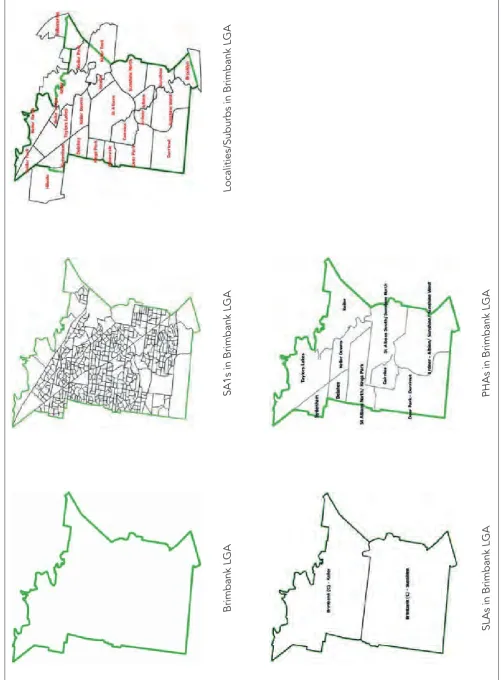
The geographical areas used for different reporting needs require explanation. In descending order of size, these are LGAs, Statistical Local Areas (SLAs), Statistical Areas Level 1 (SA1s), Localities/Suburbs, and PHAs.
PHAs are a combination of Suburbs and SLAs. PHAs are specifically used for Australian health data, as they are small enough to convey internal variation within LGAs.
In this report, correlations are always referred to as ‘at Brimbank PHA level’. It is possible that different results could be returned for maps at a wider scale: at SLA level in Victoria or Melbourne, for example, or LGA level in Australia.
SA1s in Brimbank LGA
Localities/Suburbs in Brimbank LGA
3.2
How to read correlation outputs
A correlation coefficient is a numerical expression of the strength of association between two continuous variables. Significant correlations can be positive or negative, but these terms do not mean ‘beneficial’ or ‘detrimental’, nor do they imply causation. Generally, correlation coefficients of magnitude greater than 0.71 have been flagged as significant in this report.• Correlations help us appreciate the extent of association between a health outcome and a specific asset.
• A significant correlation coefficient with a minus sign (ie. closer to -1) indicates a negative – or inverse –correlation. That is, two variables fluctuate at a similar rate, but in opposite directions. For example, the higher the mileage on a second-hand car, the lower the sale price (all else equal); this is an inverse correlation.
A correlation coefficient closer to +1 indicates a positive association between two variables. That is, they vary at a similar rate and in the same direction; for example, the time spent walking and distance travelled will be positively correlated.
In this report, a double asterisk after the correlation coefficient (**) indicates a correlation of magnitude 0.75 or more (strong).
The two exampletables overleaf convey
correlation information about a desirable health outcome: children developmentally on track under the physical health and wellbeing domain (derived from the Australian Early Childhood Census – see Section 4.6).
Outputs from GIS can show where a factor exists and to what extent, but cannot provide an answer to why. Regardless of the positive and negative results, the reader should not conclude, for example, that play centres directly help children be on track developmentally, or that state primary schools do the opposite.
The results indicate correlation, not causality.
A correlation matrix is provided as an abridged version of the almost 150 variables explored in this report (see at Appendix B). Its purpose is to enable the reader to quickly gauge the ‘heat map’ of what are the most important associations of physical and social infrastructure with poor health and education outcomes and what might be the ‘clusters of interest’.
For the Positive Correlation Table:
The PHAs in Brimbank with higher estimated rates of children developmentally on track also had: • greater proximity to indoor play centres; and
• more parkland; greater proximity to takeaway food outlets.
Children developmentally ON TRACK under the physical health and wellbeing domain Positive Correlations at Brimbank PHA level
These attributes are MORE PREVALENT in Brimbank PHAs with high rates of children developmentally on track under the physical health and wellbeing domain
Physical and social infrastructure
Indoor play centres – proximity to residences (.847**) Take away food outlets [chain] – per person (.668*) Percentage of Parkland (.637*)
Health and wellbeing indicators [no significant results]
Contextual indicators [no significant results]
Education and child development [no significant results]
For the Negative Correlation Table:
The PHAs in Brimbank with higher estimated rates of children developmentally on track also had: • greater distances from state primary schools and from packaged liquor licenses; and
• higher proportions of dwellings in rental stress and dwellings in mortgage stress.
Children developmentally on track under the physical health and wellbeing domain Inverse Correlations at Brimbank PHA level
These attributes are LESS PREVALENT in Brimbank PHAs, with high rates of children developmentally on track under the physical health and wellbeing domain
Physical and social infrastructure
State primary schools – proximity to residences (-.727*) Packaged liquor licenses – proximity to residences (-.660*)
Health and wellbeing indicators[no significant results]
Contextual indicators
Dwellings in rental stress (-.759*) Dwellings in mortgage stress (-.656*)
Education and child development
Children developmentally vulnerable on one or more domains (-.811**)
Demographics[no significant results]
Note
It is important to consider both positive and negative correlations to get the full picture and understand that correlations mean statements are also true in reverse. So, we could say that:
The PHAs in Brimbank with higher estimated rates of children developmentally on track also had: • greater proximity to indoor play centres; • more parkland;
• lower proportions of dwellings in rental stress and dwellings in mortgage stress;
• lower proportions of children developmentally vulnerable on one or more domains; and • greater distances from state primary schools
and from packaged liquor licenses.
The PHAs in Brimbank with lower estimated rates of children developmentally on track also had:
• less proximity to indoor play centres;
• fewer chain take away food outlets per person; • less parkland;
• higher proportions of dwellings in rental stress and dwellings in mortgage stress; and
Section 4:
Analysing selected Brimbank
indicators using additional spatial datasets
This section presents analysis of six selected health and wellbeing indicators from TheBrimbank Atlas of Health and Education, using additional spatial datasets (as described in Section 3). The results are presented in the form of correlation tables and overlay maps, followed by a discussion, for each selected indicator. Where relevant, maps of greater Melbourne are included.
The Brimbank Atlas of Health and Education (2014) describes the incidence of these health and wellbeing indicators in the Brimbank population.
The indicators considered are:
4.1 Self-assessed health status reported as ‘poor’ or ‘fair’
4.2 Obesity 4.3 Diabetes
4.4 Psychological distress reported as ‘high’ or ‘very high’
4.5 Hospitalisations for ambulatory care-sensitive conditions
4.6 Children developmentally vulnerable on one or more domains
These health and wellbeing indicators were selected because each is:
• a risk factor for preventable chronic disease/ conditions; or
• a risk factor that, in combination with others, has significant impact on levels of health and wellbeing, disease and disability in the community.
Several indicators are above Melbourne, Victoria, and Australian averages within Brimbank.
Subsections 4.1 to 4.4 and 4.6 present health and wellbeing indicators with many similarities.
Read in succession, these subsections demonstrate that disadvantage and poor health overlap in multifaceted ways. Self-assessed fair or poor health, obesity, diabetes, psychological distress, and smoking show similar (but not identical) patterns, with concentrations in areas of higher relative socio-economic disadvantage.
Subsection 4.5 – Hospitalisations for ACSCs – shows an unusual pattern, with the highest rates of hospital presentation occurring in areas of lower relative socio-economic disadvantage.
Each subsection is structured as follows.
1. Summary box
2. General information on the selected risk factor, reflecting findings from The Brimbank Atlas of Health and Education 2014
3. Correlations at Brimbank PHA level: • a positive correlation table • an inverse correlation table • a summary