TOWARDS THE CONSTRUCTION OF MEANING FOR TREND IN
ACTIVE GRAPHING
Janet Ainley, Elena Nardi and Dave Pratt
Running head: The Construction Of Meaning For Trend
Keywords: graphing, trend, spreadsheets, data handling
Abstract
The development of increased and accessible computing power has been a major agent in the current emphasis placed upon the presentation of data in graphical form as a means of informing or persuading. However research in Science and Mathematics Education has shown that skills in the interpretation and production of graphs are relatively difficult for Secondary school pupils. In this paper we explore the conjecture that the use of computers in education has the potential to revolutionise the ways in which children learn graphing skills. We describe research with 8 and 9 year olds using on a pedagogic strategy which we call Active Graphing, in which spreadsheets are use to collect and present data from practical experiments, and present results which indicate that children gain higher levels of
Background
One of the most significant characteristics which distinguishes contemporary living from that as recent as fifty years ago is the central importance of information. In particular, there is a great emphasis placed upon the presentation of data in various forms as a means of informing or persuading. The development of enormously increased and accessible computing power has been a major agent of this change. Software tools, such as databases and spreadsheets, owe their existence to the need for the collation of raw data and for the meaning of that data to be communicated through compact images including diagrams, graphs and charts.
There is an assumption in the news media that such images are transparent, in the sense that the reader will gain immediate understanding of their message, but within mathematics education concerns have been raised on this issue.
Reading a diagram is a learned skill; it doesn’t just happen by itself. To this point in
time, graph reading and thinking visually have been taken to be serendipitous outcomes
of the curriculum. But these skills are too important to be left to chance. Dreyfus and Eisenberg (1990)
A number of research studies from both mathematical and scientific perspectives (for
example, Kerslake (1981) reporting on the Concepts in Secondary Mathematics and Science project, Johnson and Welford (1988) reporting on the findings of the Assessment of
Performance Unit, Sharma (1993) reporting on the Strategies and Errors in Secondary Mathematics project) have revealed relatively low levels of graphing skills amongst secondary school children, and highlighted particular areas of difficulty. Such studies typically distinguish skills in the interpretation of graphs from those needed to construct graphs. Two studies with lower secondary children in Britain and North America (Swatton and Taylor (1994), Padilla, Mckenzie and Shaw (1986)) show relatively low success rates in interpretative skills (interpolation and particularly reading relationships between variables), but higher rates in some construction skills (such as plotting points). Donnelly and Welford (1989) found a range of difficulties including the tendency for weaker children to over-interpret the information. These findings serve to strengthen the widely-held perception of interpretation skills as being of a higher order than construction skills.
However, there is an alternative explanation of these very poor levels of performance in the interpretation of graphs. Traditionally much emphasis has been placed by teachers, and
primary school mathematics schemes, both on the conventions of graphical representation and on neat presentation. Drawing neat, detailed graphs by hand is time consuming, particularly for young children with limited motor skills, even when the intellectual demands of the content are relatively low. We suggest that this time factor, combined with the relatively high profile given to graphical representation as a topic, has led to the production of graphs
frequently being seen as the end-point, indeed the purpose, of the activity, with little attention focused on interpretation (beyond rather superficial 'reading' of data), or on the use of graphs as problem solving tools. We have characterised this traditional approach to graphical
Just as the increased use of computers has changed the demand for, and access to,
information, the use of computers in education has the potential to revolutionise the ways in which children learn graphing skills. We suggest that a mastery of graphing requires three separate, though clearly related, capabilities:
• an understanding of how to interpret and use graphs,
• a knowledge of the conventions and technicalities of graphs, such as the use of scale, and
• the practical skills required to produce graphs by hand.
In a conventional classroom situation where graphs are drawn by hand, it is difficult to separate the physical and intellectual demands of producing graphs, from the intellectual demands of interpreting them. The demands of learning conventions and technicalities are high, and this, together with the time required to produce graphs by hand, has led to attention being focused on a limited range of types of graph, particularly in primary schools. It is easy to make the assumption that the experience of drawing graphs, and 'knowing' the conventions are necessary prerequisites for being able to interpret graphs effectively.
However,our preliminary studies using a computer-based pedagogy with eight to eleven year-olds has led us to challenge both this conventional view of graphing, and assumptions about the types of graph which are appropriate for children in primary schools. When graphs are produced on the computer, there is no need for the child to have the practical skills
In a recent review of a number of studies related to young children's graphical interpretation skills, including the use of motion sensors and other real-time datalogging devices, Phillips (1997) offers further support for this view, concluding that there is evidence of a “surprising proficiency” demonstrated by some young students. These students are “capable of a wide range of operations with graphs that include... the use of scattergraphs to see a trend”.
Furthermore, we have collected some evidence which suggests that children working on interpretation tasks with the computer also acquire significant insights into the conventions and technicalities of graphing (Ainley (1995). We conjecture that by allowing the
development of interpretation skills before explicit teaching of the conventions and
technicalities of graphing and the practical skills of drawing graphs, the computer may allow us to re-evaluate the progression traditionally applied to graphing skills. The reversal of the more conventional order that generating graphs precedes their interpretation is a specific case of a more general notion, which Papert(1996) refers to as the power principle:
… or “what comes first, using it or ‘getting it’?” The natural mode of acquiring most
knowledge is through use leading to progressively deepening understanding. Only in
school [ ] is this order systematically inverted. (p. 98)
Access to the use of a computer for producing graphs may fundamentally change the ways in which graphs can be used in the classroom, and this in turn raises questions about how the role of graphing may be perceived by children. We suggest that, as with the availability of calculators in arithmetic (see evidence from the CAN project in Shuard et al. (1991)), the possibility of producing graphs with a computer does not simply remove the need for
The spreadsheet environment
There are a number of features in the spreadsheet environment which have particular relevance to the learning of graphing skills. It is clear from our own experience and that of other researchers that there are costs as well as benefits.
The ease with which many different kinds of graphs can be produced
A spreadsheet offers the facility to produce and modify the details of a range of graphs very quickly. This allows children to experiment with producing many different graphs, most of which would be difficult to produce by hand. However, the computer does not consider the sense or the purpose of the graph. This may seem obvious, but is not always apparent to novice users. Provided that the appropriate quantity and type of data has been highlighted, the computer will produce a graph, but it provides no feedback as to whether the graph makes sense. This may cause difficulties for children when they use the computer for exploring graphical representation. It appears from our initial observations (Pratt (1995)) that children intuitively apply different criteria from mathematicians or scientists when deciding on the 'best' graph to use, focusing on the superficial appearance of the graph rather than on how easy it is to read or whether it is meaningful, a phenomenon also reported by Ben-Zvi and Friedlander (1996). Organising the layout of data on the spreadsheet so that it can be graphed efficiently emerges as an important analytic skill.
The nature of computer generated graphs
• The graphs are dynamic, in the sense that their size and proportions can be altered by dragging the corners of the graph window. Unless the user has specified otherwise, the scales shown on the axes will generally change as the graph is distorted.
• Graphs can be created interactively: once the graph has been created, it will change as data is changed on the spreadsheet. It may be possible for the teacher to exploit the potential of this level of interactivity to help children develop their understanding of scale. However, Goldenberg (1987) and Yerushalmy (1991) have shown how the children can be misled by illusions which arise out of the way in which computers present the graphs on screen.
• The appearance of the graph can be changed through menus which control the scales on the axes, the orientation, the style of markings and labels, and so on.
These features may make an experienced user feel in control, but can make novices feel less secure. Other features may initially seem problematic: for example, the computer will by default choose a scale which is convenient for fitting the graph to a standard window, but which may not be one that is appropriate or easy to use. In some software, the default setting is for graphs to be drawn showing only the horizontal gridlines.
A new pedagogic approach: Active Graphing
Our exploratory work with children using the spreadsheet environment led us to identify a number of features in both the use of the spreadsheet, and the setting of activities which seemed to contribute to success in the interpretation of graphs.
and Tinker, 1987 Brasell, 1987) supports our view that this proximity is important both in children's developing understanding of the conventions of graphing, and in their ability to interpret complex graphical representations.
• A familiar and/or meaningful context: this allows children to understand and feel ownership of the data.
• The presentation of a complete image: gives a holistic view rather than focussing on separate components.
• The use of a number of similar graphs: this allows children to focus on differences and common features, encouraging discrimination. Changing the appearance of the graphing by dragging (as described above) adds to this experience.
• A clear purpose for using the graph to solve a problem: this enables children to experience active use of graphs as problem solving tools rather than seeing them as illustrations.
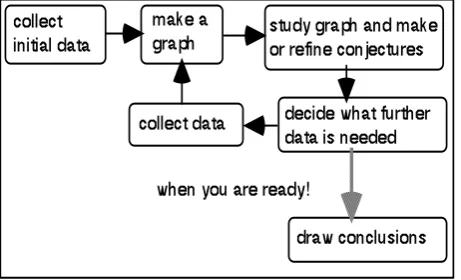
Figure 1: A schematic for the Active Graphing approach
Exploring children’s construction of meanings for trend
Our initial research with Active Graphing raised a number of issues which have been
explored in more depth in a recent study (funded by ESRC), designed to allow us to observe children more systematically as they engaged with active graphing tasks. We were
particularly interested in how children construct meanings for aspects of graphing. In particular, we were concerned to explore the role played by children’s interactions with the three modalities, experiment (E), data (D) and graph (G), which we refer to as the EDG triangle, and how the balance of the three may change as the children’s experience of active graphing increases. In this paper we discuss the findings of this study in relation to children’s construction of meaning for trend within graphs of experimental data: other aspects of the study have been reported elsewhere (Ainley, Nardi & Pratt (1998a,b,c)
Method
which fitted broadly into themes in her planning for the term. These were carefully designed to incorporate key features which are central to Active Graphing:
• a problem which was sufficiently intriguing to gain the children’s interest,
• a relatively simple experimental element in which the effects of changing one variable could be measured with reasonable accuracy, and
• some scope for children to make decisions about the design of the experiment, so that they felt ownership of the task and its outcomes.
The activities are described in detail in the following sections. Each activity was led by the class teacher and ran in the classroom for one week, generally with a two-week gap between activities. For pragmatic reasons, the class was organised in two halves, each working in pairs or small groups on the activity for a period of up to two hours on alternate days: thus each group worked for 2 sessions on each activity. Four girl/boy pairs (two from each half of the class) were selected for close observation.
At the end of the week’s work on each activity there was a plenary session (which was also audio-recorded) in which groups presented their work to the class. The data consists of the recorded sessions and interviews, the children’s work (spreadsheets and graphs) and field notes.
Selected parts of the recordings were transcribed and these were combined with the other sources of data to produce extended narrative accounts, the Stories, describing the work of each pair on each activity. Our analysis of the Stories aimed to identify significant learning incidents, based on two different kinds of criteria. One strand of analysis involved identifying incidents in which the children’s discourse focussed on a single modality (E, D or G), and those in which the discourse linked modalities (for example E-D, or D-G). This notation is used to indicate that the children were working with the first modality, but also talking about the second. This analysis enabled us to look at the pattern of the children’s use of the different modalities. A second strand of analysis focussed on the identification of patterns in the
children’s behaviour, categories for which emerged at various stages of data processing. In the process of analysis some clear links emerged between these two strands, with certain behaviours appearing more often in the context of discourse across the same combinations of modalities. In the following section we present examples of three behaviours which we saw as significant in children’s construction of meaning for trend:
• shape spotting, associated with Graph only discourse, • normalising, associated with Graph-Data discourse, and • feature spotting, associated with Graph-Experiment discourse.
The activities
naturally form two pairs: Bridges and Helicopters having some different characteristics from Display Area and Sheep Pen.
In Bridges, the children were challenged to construct a bridge by folding a piece of paper which could hold a marble egg. In her introduction to the activity the teacher set up the problem by claiming that another teacher had claimed that this would be impossible. The bridges had to be constructed according to the same basic pattern (see Figure 2), although groups could choose where to place the supports. The children experimented by making bridges with different numbers of folds, and testing how much weight each could hold by gradually placing more weights on the bridge until it collapsed.
Figure 2: The Bridges apparatus
Figure 3: A ‘helicopter’
The remaining two activities, Display Area and Sheep Pen differed in a number of ways from the two activities already described. The most immediate difference was that the effects of changing a variable in the experiment could not be measured directly, but could be calculated by the spreadsheet.
The idea for Display Area arose as part of a project about Tudors in which the children had looked at miniature portraits. The problem was to make a rectangular frame from a 75 cm length of ribbon, which could hold as many miniatures as possible: i.e. the children had to find the rectangle with maximum area for a perimeter of 75 cm. The children worked on this activity initially by pinning a length of ribbon on to a display board to make the frame, then measuring the length and width of the frame and entering these results on the spreadsheet. With help, they set up a third column on the spreadsheet with a formula to calculate the area of the frame.
In Sheep Pen, the children were given the problem of designing a rectangular sheep pen using 39 m of fencing, to be set against a wall, that would hold as many sheep as possible: i.e. they had to find the maximum area for a rectangle in which one length and two widths total 39 m. They modeled this using straws cut to 39 cm, bending the straw to make a ‘pen’, measuring its width and length, and entering these on the spreadsheet. As in Display Area, they used a third column to calculate the areas of the pens. In both activities, the children produced graphs of the width (or length) of the rectangle and its area. Both activities produce similar graphs, in which the maximum value is found from a parabola.
accessible to the children and amenable to algebraic modelling (e.g. l= for Display Area , and l=39-2w for Sheep Pen). It was therefore possible to identify the rules connecting width and length, and translate these into a formula on the spreadsheet to generate data. A more detailed analysis of this aspect of the study can be found in Ainley, Nardi and Pratt (1998b).
Results: examples of significant learning incidents
Despite the differences between the two pairs of activities, many of the same themes emerged in our analysis of the children’s work. The incidents presented below illustrate typical phases in the construction of meaning for trend during the Active Graphing process. The children’s activity and discourse was characterised by intermittent phases of sense-making as they moved through different aspects of Active Graphing.
Shape-Spotting (Graph-only discourse)
Children’s first response to seeing scattergraphs was often to interpret them in a ‘pointwise’ way. By this we mean looking at particular points on the graph, and associating these with incidents in the experiment; so, for example, they might identify one point as ‘the one I dropped’, or ‘the one that hit the chair on the way down’.
Figure. 4 : “It goes like a ramp.”
La: It's going like in a pattern.
Cl: It's in steps...this is a really slopey step and it's going like that.
La: And then it looks as if it's going like a ramp. It first goes like that and then it goes like that - in a ramp.
Da: It's going like that, I think. And then it’s going to go down there. Res: Can you talk to me a bit more about this?
La: I think it goes like mmm and then down again. If we do high ones it could still go up.
Cl: Looks like some sort of animal lying down.
Da: It looks like a lion. There is the tail and the head. There is its body and ...
sometimes invent humorous stories which made fictional links to the experiment).
Nevertheless, where shape-spotting involved looking through the random fluctuations in the data to observe patterns (as distinct from looking at the data in a pointwise fashion), we see such activity as a first step towards constructing meanings for trend, as illustrated in the next example.
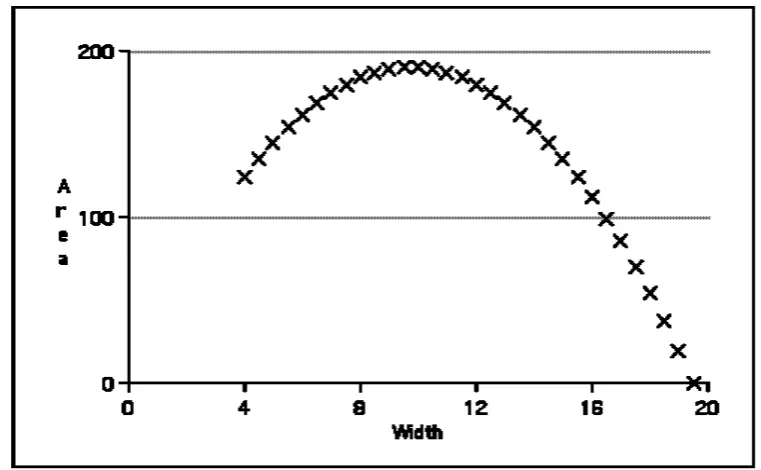
In their work on Display Area, La and Da also saw shapes in their graph, but their shape-spotting here is perhaps a little more sophisticated.
Figure 5: “It’s a hill.”
Res: Okay so what is this graph saying? (Figure 5) La: It’s a hill.
Da: It’s like a mountain there.
When they describe their graph (Figure 5) as a ‘hill’ or a ‘mountain’, La and Da seem to be referring not only to the shape they can see (essentially a downward slope), but also
imaginatively predicting what the shape of the graph will be when they have added more data. La’s statement that “it’s gonna come down again” appears to refer to the (imagined) left hand side of the graph, indicating her increasingly clear sense that it is legitimate to extrapolate from the trend she has identified. It is significant that Da makes an implicit link between the graph and the data (or perhaps to the experiment) in his statement that the graph will “go back to nought”.
Normalising (Graph-Data discourse)
We use the term normalising to refer to a behaviour we observed in a number of different situations, in which the children are unhappy with the appearance of the graph and want to ‘correct’ it. As the examples given below illustrate, when normalising occurred, children were confident that they could see some trend in their graph, but could also see certain points which did not fit this trend. We observed normalising in a number of different situations: when there were points which did not fit the overall pattern of the graph, when there were large gaps in the graph, and when the graph showed up anomalies in the data. The class teacher soon came to recognise normalising incidents as fruitful opportunities to talk about experimental accuracy and fair testing.
Figure 6: “The cross for 4 is falling.”
Res: What are these results showing and how do you feel about them?
Ta: They’re not that good, because on here it should have been, on the sevens, and fours it should have been bigger … number …
Res: Right, which one are you pointing at? This one here, for seven? Ta: … because look, here, the four folds, and its only the same as two … Res: You’re right, I wouldn’t be very happy about this either
Ta: … and for three it’s twenty seven
Res: Right, so what do you think about going on about this? Ta: Try it again.
Res: Ok you’re pointing at … in between the results for 3 and 5. El: Yeah.
At this point Ta is clearly looking at the graph as a whole, looking through the individual points to identify a trend. This enables him to identify points which do not appear to fit the trend. El also uses her sense of the trend to predict where one of these points should be if it is to fit. Although they are looking at the graph, their discourse involves the graph and the data, particularly as Ta justifies his claim about the cross for four folds. Such incidents usually led the children to repeat that part of the experiment, in the hope of getting a result which fitted their predictions.
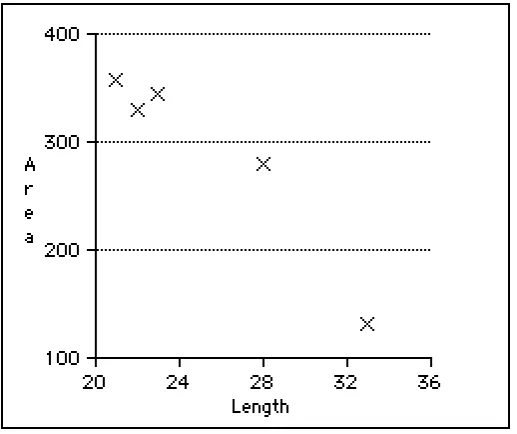
Our second example illustrates a more complex use of normalising , triggered by an anomaly which appeared early in Cl and Ch’s work on Display Area. Their graph (Figure 7) had three crosses in a vertical line, representing three rectangles with the same length but different widths, thus giving different areas. As the perimeter is fixed, this is clearly impossible. The class teacher had recognised this situation, and taken the opportunity to intervene to
Figure 7: Cl and Ch’s graph and data.
Ch: ... can we measure this one again to see what that actual one is - it’s sixteen and a half yes delete them two...
Res: How are you going to choose which one to delete? [ ... ]
Res: Can you tell me how much this is going to be? If this is twenty two how much is the other? ... How would you find it?
Cl: Let's measure...
Res: Can you do it in your head? ... How would you find it out?
Cl: Twenty two add twenty two is ... that’s forty four then you err then you have to try and make seventy five.
[... checking calculation]
Res: So then these two things would be thirty one what would each be? Cl: ...fifteen times two equals thirty, sixteen times two equals thirty two. Res: We have thirty one though, OK?
Cl: I don't know.
Res: It’s very close what you are saying. If we have, this is twenty two and this twenty two and this is forty four so these two are thirty one both of them so how much each.
Ch: Divide it -
Cl: Ahh so it’s fifteen and a half.
Res: Excellent! So this is how to choose which one... Cl: Now I get it! That one is right but these two aren't.
In this example, what began for Cl and Ch as an attempt to normalise the graph in accordance with the logic of the experimental situation, evolves into a realisation of how to calculate the width of a rectangle when given the length and the perimeter. Their attention, and their discourse, moves between the graph and the data, but they also begin to work in a more abstract way on the mathematical relationship between width and length.
They went on to use the rule they had discovered as a correcting procedure, applied to experimental data. Although they were aware of the utility of their rule for checking the data they already had, they did not yet see the possibility of using it to generate new data.
Feature-Spotting a) (Graph-Experiment discourse)
they have been set. In their discussions of the graphs we often observed feature-spotting : children making connections between the features they see in the graph and what they know of the experiment through intuition and observation. Such discussion is characterised by G-E discourse.
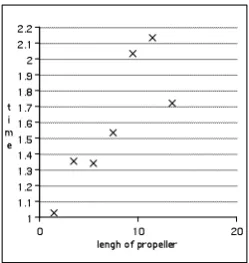
In the following extract, Ta, El and Je discuss with the researcher the graph that they have produced from the Helicopters activity (Figure 8). They have conducted a large number of trials with different wing lengths, but difficulties with timing the flights accurately has meant that the graph is rather ‘messy’. They are able to describe some trends in the graph, but the complexity of the image, and of the children’s choice of language mean that the research finds it necessary to intervene frequently to help them articulate their ideas.
Ta: They are going up instead of down because there they are going down. El: Sort of ... they are climbing like that and they are going like that. Ta: I think the under 10, 15 under 15 are going are the best.
Res: Okay, so less than 15 and more than ... what is this? Ta: Actually 12 and 9 they are all coming up.
Res: Yes, and then what’s happening? Ta: Over 12 they are all going down.
Res: They are going down and becoming more or less the same lower down - okay. Ta: They are just falling instead of spinning.
Res: Oh, you say falling instead of spinning. Ta: Yeah, going straight down.
Res: Right, and they are going fast because they are going down fast. Then the flight is quite short, isn't it? They don't stay up in the air for a long time, do they? El: No, they are just falling down.
Res: Is that what we are seeing here?
El: These are like staying in the air - longer sort of time. Res: Are these staying longer?
El: Well, not longer but they are staying in the air the same sort of time. Je: They are all the same, aren't they?
perhaps the times they represent), since the spinners themselves were quite different in appearance because of their wings.
Feature-Spotting b) (Graph-Experiment-Data discourse)
Our second example of feature-spottingcomes from the fourth activity the children
undertook, Sheep Pen. Their work on this activity was rather different from previous ones, as although physical materials were offered (art straws cut to length to model the fencing), many of the children, as a result of their experiences with Display Area, soon abandoned the
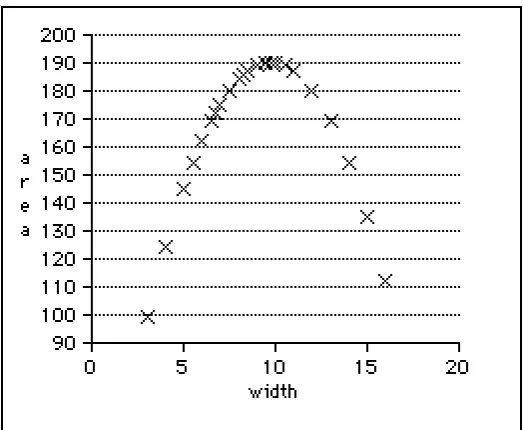
practical activity in favour of using a spreadsheet formula to model it (Ainley, Nardi and Pratt (1998a,b)). Two pairs of children (Ta and El, and Je and Ph) both used such a formula to give the length of a sheep pen for any width they chose. However, the graphs they produced looked rather different because of the scale, and because they had entered slightly different values for the width. In the following extract, the researcher encourages them to compare their graphs.
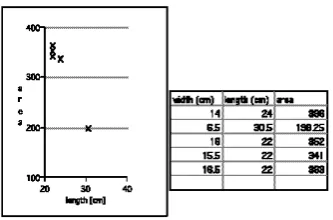
Figure 10: Je and Ph’s sheep pen graph.
I ask the two pairs to compare their graphs (Figures 9 and 10). Ph: Ours is a little skinny one, yours is a big, fat podgy one. Res: Do we think the graphs are similar?
Ph: Yes, sort of.
Je: That's thin .. that’s fat and that’s thin and ...
El: That one doesn't go back to the end ... it goes like ... (Figure 9) Res: Why do you think it’s that?
Je: Yours stops there and not go to the bottom. (Figure 9) Res: Why do you think it is so?
Ta: They have chosen lower numbers than ours.
Res: Is there anything special about the crosses, you know, on this graph? (Figure 10) Do you think they are like evenly spread or do you think they are squashed at all?
Ph: At the top they’re really squashed ...[ ] .. and at the bottom they’re really spread out.
Res: Right, (to Ta ) what do you think about your graph then? Do you think they are squashed in some area?
Ta: Yeah, here. (pointing to Figure 9)
Res: Why do you think this is so? Why do you think in some areas ... Ta: We got the same.
Je: On the 190s ... two the same. Res: Aaah!
I ask Je whether their crowded data around 190 (Figure 10) is there for the same reason. Ph says they worked around 190 [to try to find the maximum].
The children are also very aware of the similarities of the two graphs in the spacing of crosses. Ph describes the appearance of one graph vividly (“they’re really squashed”), and Je and Ta give similar explanations for this; both of them talk about having ‘[two] the same’ for one of the values - in fact two different widths giving the same area. Ph goes on confidently to say that this is because they ‘worked around’ 190 to see if they could find a higher value - higher both as a value for the area and as a position on the graph. However, because of the scale of the graphs, it is now impossible for the children to spot the highest crosses, and so their attention is more focused on the spreadsheet data.
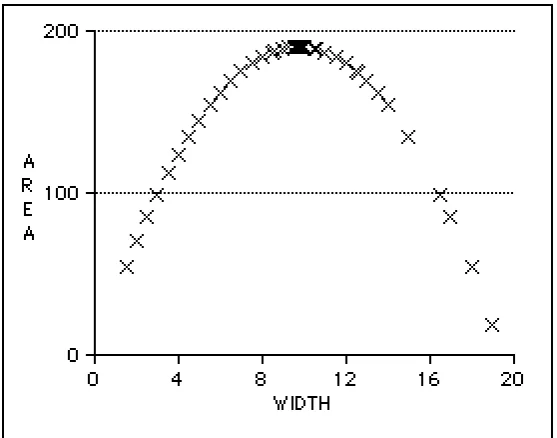
In a final example from the same activity, La and Da are working systematically with their spreadsheet model of the sheep pens. They have used a formula to increase the values of the width by 0.5 each time, but are still not satisfied that they have found the real ‘top of the hill’ on their graph (Figure 11).
Figure 11: ‘This hill here …’
pointed at the top of this hill here okay, that somewhere there is the maximum we can have, okay? And we also found that 190 is the best we have already. La: Yes that’s 190.
Da: And that' s not a square.
Res: But you think we can go even bigger than that? La: We could go higher.
Res: How can we go higher? La: Aaahh!
Da: I think we could do 20 now.
La: Where is 190? So we could do 9 10 … Da: 29.
La: No because we’ve done halves ... and we’ve done wholes. Res: Yes.
La: ...we can do quarters. (mumbling tentatively) Res: Say it again!
La: We can try quarters.
Res: Because as you say we have done all the whole numbers and we have done all the halves.
La: So now we do quarters.
formula to increase the width by 0.25 each time). This strategy does prove successful in making the ‘hill’ go higher.
It is clear in both of these examples from Sheep Pen, the last of the four activities, that the children’s confidence and skill in reading scattergraphs has increased to the point where they move effortlessly in their discussion between the graph, the data and the problem situation. Interpolation of a (new) maximum value between the two highest values they already have illustrates a sophisticated sense of trend in the graph.
Summary
Through the examples in this section we have illustrated the following results from our study. When children’s attention and discourse is focussed on the graph, shape-spotting, as
distinct from pointwise reading, was seen as a significant category of behaviour, since it indicates attempts to look through, rather than at, the individual points.
Two further behaviours, normalising and feature-spotting, were identified. Both of these centre on a developing construction of meaning for trend, characterised by shifts in both attention and discourse from the graph to the data and/or the experiment.
Shape-spotting, normalising and feature-spotting appeared and re-appeared intermittently, rather than following a particular sequence, presumably cued by surface features of the activity. However, as children progressed through the programme of activities, their awareness of trend and interpretation of graphs generally became more fluent and sophisticated, as we discuss in the following section.
Discussion
changes as the children’s experience increases. In this final section we discuss our findings in relation to the children’s construction of meaning for trend.
In our analysis it soon emerged that much of the children’s work on all four of the activities involved interaction not with a single modality, but linking across the modalities in different combinations. Indeed the most interesting and powerful learning incidents which we observed seemed to occur when there was more interaction across the different modalities. A good illustration of this is given in the example of feature-spotting described earlier, relating to a scattergraph produced during work on Helicopters (see Figure 6). Here we saw the children’s discourse moving seamlessly between descriptions of the graph in front of them, and
references to aspects of the experiment they had previously carried out. Nemirovsky (1998) terms such ‘talking and acting without distinguishing between symbols and referents’ as fusion , which he sees as an expression of fluency in symbol use (in which he includes graphical symbols). In this and many other examples of feature-spotting we observed fusion in the children’s discourse as they constructed connections between their intuitions and observations of the experiment and features of the scattergraph. We see this as a strong indication of their growing fluency in the use of graphs.
This fluency is seen even more clearly in the two examples of feature-spotting taken from the Sheep Pen activity (related to Figures 9, 10 and 11). In these the children’s discourse links all three modalities, as they use appearance of the graph to conjecture that a different treatment of the data will produce the solution to the experimental problem. We conclude that
The spreadsheet environment, particularly when used on portable computers, supported interaction across the modalities by allowing the juxtaposition of the experiment, data and graph in two senses. They were juxtaposed in time, as data could be entered as soon as it was collected and graphs could be produced quickly. They were also juxtaposed in space, as the computer could be used wherever the experiment was carried out, and graph and data could be shown on the same screen.
Our analysis has also identified different behaviours which children engage in during the active graphing approach. We have given examples to illustrate these which characterise their attempts to construct meanings for trend: shape-spotting, normalising and feature spotting. These three behaviours all indicate children’s developing skills in looking through the individual points presented on the graph to observe regularities in the data and relationships between the experimental variables. Of these behaviours, shape-spotting may initially appear unrelated to interpretation and use of the graph, but we have come to see this as signaling a move away from looking at the data in a pointwise manner. Thus shape-spotting can be used as an opportunity for intervention to draw children’s attention towards making links across modalities through discussion of regularities.
There is a dialectic relationship between the behaviours of normalising and feature spotting: successful normalising has a pay-off in terms of accuracy, supporting the construct and notion of trend, and making it easier to spot features in the graph. As the sense of trend becomes more firmly established, the identification of perceived abnormalities in the graph becomes more efficient, supporting further normalising.
In our final example in the previous section, taken from the fourth activity, La shows perhaps the most sophisticated interpretation skills we observed, but she and Da still talk about their graph as a ‘hill’. We did not see the clear changes that we had perhaps hoped for in the children’s use of the three modalities, or in the patterns of their behaviour, as they worked through the programme, perhaps because of the relative levels of novelty within each activity. Rather, the developing sophistication of their constructions of trend were indicated by greater levels of fluency in their discourse.
The final point which we wish to draw out from this discussion is that the purposefulness of an Active Graphing task, the focus on an overall problem to be solved, draws the children into the need to make sense of the graph, and offers opportunities to understand the utility of graphs as analytical tools. As the children engage in normalising and feature-spotting, an awareness of a dependent relationship between the two variables in question emerges. Thus, making sense of the graph supports an understanding of the experimental situation, and of the problem solution.
As the graph is used as an analytic tool within the ongoing experiment, children are given the opportunity to appreciate the utility of graphs, and to develop familiarity with the conventions and technicalities of their construction as they repeatedly read and interpret them.
References
Ainley, J.: 1995, ‘Re-viewing Graphing: traditional and intuitive approaches.’ For the Learning of Mathematics ,15(2) pp. 10-16.
Ainley , J.: 1999, ‘Who are you today? Complementary and Conflicting Roles in School-Based Research.’ For the Learning of Mathematics, 19 (1) @@
Ainley, J., Nardi, E. & Pratt D.: 1998a, ‘Graphing as a Computer Mediated Tool’, in: A. Olivier & K. Newstead (eds.) Proceedings of the 22nd Annual Conference of the International Group for the Psychology of Mathematics Education, University of Stellenbosch, Stellenbosch, Vol. 1 pp. 243-258.
Ainley, J., Nardi, E. & Pratt D.: 1998b, ‘Constructing Meaning for Formal Notation in Active Graphing’, in: Proceedings of he First Conference of the European society for
Research in Mathematics Education, Osnabrueck, Germany (in press) Ainley, J., Nardi, E. & Pratt D.: 1998c Children’s Interpretation of Graphs within a
Computer-Based Pedagogy (R000221844), Final Report to ESRC, Mathematics Education Research Centre, University of Warwick.
Ben-Zvi, D. & Friedlander, A.: 1996, ‘Statistical Thinking in a Technological Environment,’ in J. B. Garfield and G. Burrill (eds.) Research in the Role of Technology in Teaching and Learning Statistics: Proceedings of the 1996 IASE Round Table Conference, University of Granada: International Statistics Institute, pp. 45-55.
Brasell, H.: 1987, ‘The Effect of Real-Time Laboratory Graphing on Learning Graphic Representations of Distance and Velocity.’ Journal of Research in Science Teaching 24 pp. 385-395.
Bryant, P. E. & Somerville, S. C.: 1986, ‘The Spatial Demands of Graphs.’ British Journal of Psychology, 77 pp. 187-196.
Carraher, D., Schliemann, A. & Nemirovsky, R.: 1995, ‘Graphing from everyday experience.’ Hands On! 18(2) p. 7.
Dreyfus, T. & Eisenberg, T.: 1990, ‘On difficulties with diagrams: Theoretical issues,’ in G. Booker, P. Cobb & T. N. De Mendicuti (eds.)Proceedings of the 14th Annual Conference of the International Group for the Psychology of Mathematics Education, PME, Oaxtepex, Vol. 1, pp. 27-36.
Goldenberg, E. P.: 1987, ‘Believing is seeing : How preconceptions influence the perception of graphs,’ in J. Bergeron, N. Herscovics & C. Kieran (eds.)Proceedings of the 11th Annual Conference of the International Group for the Psychology of Mathematics Education, Université de Montréal. Montreal, Vol. 1 pp. 197-203.
Johnson S. & Welford, A. G.: 1988, ‘Using graphical and symbolic representation’, in F. Archenhold (ed.) Science at Age 15 : a review of APU Survey Findings 1980-1984, HMSO, London
Kerslake, D.: 1981, ‘Graphs’, in: K. M. Hart (ed.) Children’s Understanding of Mathematics: 11-16, John Murray, London, pp. 120-136.
Mokross, J. R. & Tinker, R. F.: 1987, ‘The impact of microcomputer based laboratories on children's abilities to interpret graphs.’ Journal of Research in Science Teaching, 24 pp. 369-383.
Nachmias, R. & Linn, M. C.: 1987, ‘Evaluations of Science laboratory Data: the Role of Computer-Presented Information.’ Journal of Research in Science Teaching, 24 pp. 491-506.
Nemirovsky, R. (1998) Symbol-Use, Fusion and Logical Necessity: on the Significance of Children’s Graphing, in: A. Olivier & K. Newstead (eds.) Proceedings of the 22nd Annual Conference of the International Group for the Psychology of Mathematics
Education, University of Stellenbosch, Stellenbosch, Vol. 1 pp. 259-263.
Nemirovsky, R. & Rubin, A.: 1991, ‘ “It Makes Sense If You Think About How The Graphs Work. But In Reality ...” ’, in F. Furunghetti (ed.) Proceedings of the 15th Annual Conference of the International Group for the Psychology of Mathematics Education,
Group for the Psychology of Mathematics Education , Universidade Federal de Pernambuco, Recife, Vol 2 pp. 256-263.
Padilla, M. J., McKenzie, D. L. & Shaw, E. L.: 1986, ‘An Examination of the Line Graphing Ability of Students in Grades Seven Through Twelve.’ School Science and
Mathematics, 86, pp. 20-26.
Papert, S.: 1996, ‘An Exploration in the Space of Mathematics Educations.’ International Journal of Computers For Mathematical Learning, 1(1), pp. 95-123.
Phillips, R. J.: 1997, ‘Can Juniors Read Graphs?’ Journal of Information Technology in Teacher Education, 6 (1), pp. 49-58.
Pratt, D.: 1994, ‘Active Graphing in a Computer-Rich Environment’, in: J. P. Da Ponte & J. F. Matos (eds.) Proceedings of the 18th Annual Conference of the International Group for the Psychology of Mathematics Education, University of Lisbon,Lisbon, Vol. 4 pp. 57-64.
Pratt, D.: 1995, ‘Young Children’s Active and Passive Graphing.’ Journal of Computer Assisted Learning, 11, pp. 157-169.
Sharma, S.: 1993, Graphs: Children’s Strategies and Errors, King’s College, London. Shuard, H., Walsh, A., Goodwin, J. & Worcester, V.: 1991, Calculators, Children and
Mathematics, Simon and Schuster, London.
Swatton, P. & Taylor, R. M.: 1994, ‘Pupil Performance in Graphical Tasks and its Relationship to the Ability to Handle Variables.’ British Educational Research Journal, 20, pp. 227-243.
Yerushalmy, M.: 1991, ‘Student perceptions of aspects of algebraic function using multiple representation software.’ Journal of Computer Assisted Learning , 7, pp. 42-57.
Mathematics Education Research Centre Institute of Education,