The Active Target Time Projection Chamber at NSCL
D.Bazin1,2,,J.Bradt1,2,Y.Ayyad3,W.Mittig1,2,T.Ahn4,S.Beceiro-Novo1,2,L.Carpenter1,2,M.Cortesi1,A.Fritsch5, J. J.Kolata4,W.Lynch1,2, andN.Watwood1,6
1National Superconducting Cyclotron Laboratory, Michigan State University, East Lansing, MI 48824-1321, USA 2Department of Physics and Astronomy, Michigan State University, East Lansing, MI 48824-1321, USA 3Department of Applied Nuclear Physics, Lawrence Berkeley National Laboratory, Berkeley, CA 94720, USA 4Department of Physics, University of Notre Dame, Notre Dame, IN 46556, USA
5Department of Physics, Gonzaga University, Spokane, WA 99258, USA
6Department of Chemistry, Michigan State University, East Lansing, MI 48824-1321, USA
Abstract. Reactions in inverse kinematics close to the Coulomb barrier offer unique opportunities to study exotic nuclei, but they are plagued by the difficulty to efficiently and precisely measure the characteristics of the emerging particles. The Active Target Time Projection Chamber (AT-TPC) offers an elegant solution to this dilemma. In this device, the detector gas of the time projection chamber is at the same time the target in which nuclear reactions take place. The use of this new paradigm offers several advantages over conventional inert target methods, the most significant being the ability to increase the luminosity of experiments without loss of resolution. The AT-TPC and some results obtained on resonantαscattering to explore the clustering properties of neutron-rich nuclei are presented, as well as fusion cross section results using a10Be radioactive beam. In addition, the first re-accelerated radioactive beam experiment using the fully commissioned ReA3 linac was conducted recently at the NSCL with the AT-TPC, where proton resonant scattering of a 4.6 MeV/u46Ar beam was used to measure the neutron single-particle strength in47Ar.
1 Introduction
Reactions close to the Coulomb barrier have been used with light beam probes such as protons, deuterons or al-phas since the dawn of the first accelerators. The proper-ties of the majority of stable isotopes found in the chart of the nuclides have been studied using a wide variety of reactions such as resonant scattering or transfer reactions. However, extending these techniques to radioactive nuclei produced as beams has proven to be a significant experi-mental challenge. The main reason lies with inverse kine-matics where the light probe nuclei are at rest in a target and have much wider kinetic energy range after the reac-tion than in direct kinematics. Measuring the properties of the scattered probe or its remnant becomes much more challenging, and in most cases a compromise between tar-get thickness and resolution becomes necessary.
The concept of active target is an attempt at avoid-ing this compromise by turnavoid-ing the target into a detector medium where all the energy dissipated during the reac-tion can be measured and the locareac-tion of each reacreac-tion vertex determined experimentally [1]. This is best done in a gas volume where the radioactive beam can react with the gas atomic nuclei as it slows down. Since the energy of the reaction products can be measured as they emerge from the reaction vertex, there is no loss of resolution regardless of the amount of material traversed by the incoming beam.
e-mail: bazin@nscl.msu.edu
The gas pressure can be adjusted to vary the effective tar-get thickness and measure reactions in a particular range of energies. From the reaction vertex location measure-ment, the energy of the beam at the time of the reaction can be determined for each event and an excitation func-tion of the cross secfunc-tion can be deduced. This feature is particularly useful when studying reactions such as fusion or resonant scattering for instance.
The AT-TPC and its smaller scale prototype (pAT-TPC) have been used at NSCL and other laboratories to conduct these types of experiments at energies close to the Coulomb barrier. Most of the experiments conducted so far have used low energy resonant scattering and fusion reactions. A few examples of the results obtained are pre-sented in the following, after a brief description of the de-tector and its associated technology.
2 Detector
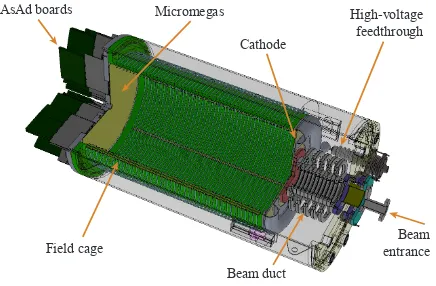
The AT-TPC consists of a 250 liter cylindrical volume closed by a cathode plate at the upstream end, and a sensor plane (labeled Micromegas) at the downstream end (see fig. 1). Upon applying a voltage at the cathode end, elec-trons freed by charged particles along their track drift to-wards the sensor plane at a constant velocity. The elec-tric field is kept uniform along the main axis of the cylin-der by a series of concentric rings located both inside and outside the field cage, and polarized via a linear resistor
chain. Upon arriving at the sensor plane, the electrons
Field cage
Micromegas
Cathode
Beam duct
High-voltage feedthrough
Beam entrance AsAd boards
Figure 3.3: A schematic view of the AT-TPC. The outer shielding volume was made transparent in this image to make the details of the inner volume more visible. Beam enters the detector through the beam duct at the right-hand side of the image and moves toward the Micromegas on the left. Some compo-nents of the GET electronics are shown mounted on the downstream end of the detector (see Sec. 3.4).
which has at its center a thin window of aluminized Mylar to allow the beam to enter the detector. The
downstream end is closed by an aluminum flange which supports the readout plane. This inner volume
is filled with the gas to be used as a target.
Surrounding the inner volume is a larger, concentric shielding volume contained by a cylindrical
aluminum pressure vessel. The purpose of the shielding volume is to isolate the high electric potential of
the cathode from the environment and to prevent arcing. Therefore, the shielding volume is filled with
an inert gas with a high dielectric constant, like nitrogen. The pressure of the shielding volume is kept
slightly lower than the pressure in the active volume. This ensures that if there were a small leak between
the two volumes, the inner volume would not be contaminated with a foreign gas that could affect the
electron drift velocity.
3.2.2 Electric and magnetic fields
The active volume contains a uniform electric field which is produced by applying a potential difference
between the cathode at its upstream end and the anode its downstream end. To ensure that the electric
field is uniform, the walls of the inner volume are surrounded inside and out by a field cage consisting
13
Figure 1.Schematic view of the AT-TPC. The field cage is made of a non-conductive material, fiberglass and epoxy. The outer chamber shields the field cage from the exterior and holds the beam duct that couples the high voltage of the cathode to the grounded beam pipe. The beam enters the field cage through a small 3µm-thick window placed at the center of the cathode. The front-end cards (AsAd boards) of the digital electronics are directly connected to the back of the sensor plane via small feed-through boards equipped with o-rings for sealing the inner vol-ume to the exterior.
are multiplied by a Micromegas device [2] consisting of a micro mesh mounted on a pad plane made of a Printed Circuit Board (PCB) where a pattern of 10,240 triangular pads have been etched. On the other side of this PCB high density connectors are used to transfer the signals to the digital electronics. A 3-dimensional image of the tracks left by the charged particles inside the field cage can be reconstructed from a time recording of the signals on each pad. The AT-TPC can be placed inside a large bore MRI solenoid to apply a magnetic field superimposed on the electric field. The resulting curved trajectories can be ana-lyzed to measure the magnetic rigidity of the emitted parti-cles for identification as well as momentum determination. The prototype version of the AT-TPC was built first and is very similar, except for its size, the geometry of the sensor plane and the number of channels [3].
The high density electronics used with the AT-TPC has been specially developed by a collaboration (GET for General Electronics for TPC) [4], that features for each channel a charge preamplifier and shaping amplifier fol-lowed by a 512-cell analog memory and 12-bit ADC for the digitizing section. In addition, this electronics has the unique feature of implementing discriminators on each channel and combining them into a running multiplicity that can be used to generate an internal trigger. This feature is particularly important in an active target as all charged particles entering the field cage do not escape, therefore no external detector can be used to generate a trigger from them. A complete description of the full scale AT-TPC will be available in a forthcoming publication [5].
3 Results
A few results obtained with the AT-TPC detectors are pre-sented. They involve reactions around the Coulomb bar-rier which is the domain most adapted to the active target concept.
3.1 αresonant scattering
αresonant scattering at low energy is an efficient reaction to populate virtual states (also referred to as resonances) of the target+projectile composite system. In the case of αparticles, these resonances may exhibitαclustering ef-fects that are of high interest in the nuclear physics com-munity. The most famousαcluster state is the so-called Hoyle state of12C, that is critical in the description of12C nucleo-synthesis via the tripleαreaction. αcluster states are sought in other light nuclei, that may have equally im-portant impacts on nucleo-synthesis, but are also of great interest in structure models of the nucleus.
Theαclustering resonances in the nuclei10Be [6],14C [7] and more recently 12Be have been investigated with the pAT-TPC using radioactive beams of 6He, 10Be and 8He respectively. The target was composed of 4He gas mixed with a 10% concentration of CO2as quencher. The radioactive beams were produced at the Notre Dame tan-dem facility using the Twinsol device [8] for [6, 7], and the TRIUMF facility for the8He beam.
The results shown below were obtained with the10Be beam, and show a clear separation between the elastic scat-tering events and the inelastic events where10Be was ex-cited to its first 2+state (panel b of fig. 2). The tracks from
4He and10Be were clearly identified from the respective energy losses of the two particles, helped by polarizing every 5th ring of the pad plane to a higher gain for the Micromegas [7], as seen on panel a of the same figure 2. From the track reconstruction, the vertex of the reactions
A. FRITSCHet al. PHYSICAL REVIEW C93, 014321 (2016)
This secondary beam was delivered to the cylindrical target volume of He : CO290 : 10 gas at 1 atm of the PAT-TPC,
measuring 50 cm along the beam axis and 27 cm in diameter. The 10Be energy was measured to be 39.7 (5) MeV by using
silicon detectors. The center-of-mass energyEc.m.decreased from 11.3 MeV to zero while traveling the length of the gas volume. The average rate of10Be that entered the volume was
103ions per second with a total of 3.2×10⁸. The beam purity
was about 35% with main contaminants of4He(2+) (50%),
9Be(4+) (5%), and 10B(4+) (3%).
Electrons from reaction trajectories are guided toward the Micromegas [27] amplifier by an electric field of 0.8 kV/cm parallel to the beam axis. The Micromegas consists of 2-mm-wide radial strips separated into quadrants. A waveform digitizer [28] records the charge as a function of drift time tdrift over 40 µs by using an array of 511 switching capacitors. We increased the amplification gain of every fifth radial strip to measure theα-particle trajectories with lower-energy deposits. The trigger generation required a pair of high-gain strips at radiusr=12 mm to receive signals from radially opposed quadrants.
Figure1(a)shows the recorded charge againsttdriftandr for a scattering event of 10Be from an
αparticle in the gas, where negative and positive radii represent radially opposed quadrants. The discrete αtrajectory is due to the increased sensitivity of the high-gain strips. The laboratory anglesθlab
andEc.m.at the reaction vertex were deduced by accounting for energy deposition and the 2.4 cm/µs electron-drift velocity [25]. Beam particles were differentiated by using the energy loss per unit length obtained from the beam track. Both elastic scattering and inelastic scattering to the 2+
1 state of 10Be at
3.37 MeV were selected by gating on the kinematical cor-relation ofθlab10Be andθα
lab in Fig.1(b). The events along the
θlab10Be+θα
lab=90◦line originate from scattering ofα-particle
contaminants in the beam and in the gas.
III. RESULTS
States of14C were resonantly populated via scattering of a 10Be beam off4He gas particles. While resonantαscattering
is advantageous for its sensitivity toα-cluster states that favor decay viaαemission [18,19], measurements with a radioactive beam are challenging. A previous study [23,24] suffered
0 30 60 90
0 30 60 90
[deg]
lab
10Be
[deg] lab
(b)
tdrift
[
s]
0 40
r [cm]0 5 10
-5 -10
(a) 10Be
10Be
lab 10Be
lab 0+
2+
FIG. 1. (a) Trajectories of a10Be
+αscattering event. (b)θlab10Bevs θα
labplot with the kinematical curves for elastic and inelastic scattering
to the 10Be 2+
1 state. Data shown have been selected via energy-loss
gating for10Be beam particles.
[deg]
c.m.
θ Ec.m. [MeV]
0 10 20 30 40 50 60
40 60 80 100 120 140
[MeV]
c.m.
E
2 3 4 5 6 7 8 9 10
(a)
2 3 4 5 6 7 8 9 10
[mb/sr]
Ω
d
/
σ
d
0 10 20 30 40 +
2
-3
-5 )
-(7
+
4
-5
-5
(b)
0 5 10 15 20 25 30 35
40 60 80 100 120 140
[MeV]
c.m.
E
2 3 4 5 6 7 8 9 10
(c)
2 3 4 5 6 7 8 9 10
[mb/sr]
Ω
d
/
σ
d
0 10 20 30
40 (d) 4+5
-FIG. 2. Differential cross sections of 10Be scattering off α
particles: (a) elastic scattering and (c) inelastic scattering to the 2+
1 state of 10Be. The color scale is given in mb/sr. Excitation
functions for (b) elastic and (d) inelastic scattering also are shown. The shaded spectrum is gated byθc.m.=70◦–90◦(45◦–55◦), and the blank spectrum by 90◦–110◦(70◦–80◦) for elastic (inelastic) scattering. The lines indicate identified resonances.
limited angular acceptance, uncertainties in reaction-channel selection, and inaccurate energy calibration. By using the newly developed thick target method [19] for the PAT-TPC [25], we measured cross sections for both elastic and inelastic scattering to the 2+
13.37 MeV state of10Be over a wide range
ofθc.m.as a continuous function ofEc.m.as shown in Fig.2. Characteristic diffractive patterns at several energies can be seen in the spectrum for the elastic channel in Fig.2(a). A total of seven resonances were identified, as indicated in the excitation function of Fig.2(b).
Each diffractive resonance pattern follows the square of the Legendre polynomialPL2(θc.m.) for the angular momentum L. States withJπ
=L(−)L are selectively populated by the L wave because bothαand 10Be are spin-zero. Following previous analyses [18,24], optimal L values were chosen by comparing the angular distributions toPL2(Fig.3). The measured angular domain ofθc.m.=35◦to 145◦is well suited to extract resonance parameters: potential scattering dominates at forward angles, at backward angles6He cluster exchange
may be dominant, and there is less selectivity forLvalues. There is very good agreement in the oscillatory pattern of the data with the proposed polynomials, giving clear Jπ assignments to the dominant partial-wave contributions of the resonances. We tentatively attribute a (7−) state at 6.5 MeV with a lower-quality fit. More realistic angular distributions were calculated with theR-matrix formalism [29] by using optical-model potential parameters based on 48 MeVα+9Be
elastic-scattering data [30] for a channel radius of 4.7 fm. As one would expect, the experimental distributions are not exactly reproduced due to uncertainties in the optical-model parametrization and the lack of a possible 6He transfer
014321-2 Figure 2. Panel a: typical scattering event recorded in the pAT-TPC, showing the double-gain setup of the Micromegas, by po-larizing every 5thring of the pad plane to a higher gain in order to
better cover the dynamic range differences between the4He and
10Be particles. Panel b: kinematics plot of the angle of10Be vs the angle of4He, where the elastic and inelastic components of the cross section are clearly separated (from [7]).
can be determined event by event, then used to calculate the reaction energy. Excitation functions can then be de-duced as a function of the center-of-mass angle, as shown in panels a and c of fig. 3. The excitation functions show a
chain. Upon arriving at the sensor plane, the electrons Field cage Micromegas Cathode Beam duct High-voltage feedthrough Beam entrance AsAd boards
Figure 3.3: A schematic view of the AT-TPC. The outer shielding volume was made transparent in this image to make the details of the inner volume more visible. Beam enters the detector through the beam duct at the right-hand side of the image and moves toward the Micromegas on the left. Some compo-nents of the GET electronics are shown mounted on the downstream end of the detector (see Sec. 3.4).
which has at its center a thin window of aluminized Mylar to allow the beam to enter the detector. The
downstream end is closed by an aluminum flange which supports the readout plane. This inner volume
is filled with the gas to be used as a target.
Surrounding the inner volume is a larger, concentric shielding volume contained by a cylindrical
aluminum pressure vessel. The purpose of the shielding volume is to isolate the high electric potential of
the cathode from the environment and to prevent arcing. Therefore, the shielding volume is filled with
an inert gas with a high dielectric constant, like nitrogen. The pressure of the shielding volume is kept
slightly lower than the pressure in the active volume. This ensures that if there were a small leak between
the two volumes, the inner volume would not be contaminated with a foreign gas that could affect the
electron drift velocity.
3.2.2 Electric and magnetic fields
The active volume contains a uniform electric field which is produced by applying a potential difference
between the cathode at its upstream end and the anode its downstream end. To ensure that the electric
field is uniform, the walls of the inner volume are surrounded inside and out by a field cage consisting
13
Figure 1.Schematic view of the AT-TPC. The field cage is made of a non-conductive material, fiberglass and epoxy. The outer chamber shields the field cage from the exterior and holds the beam duct that couples the high voltage of the cathode to the grounded beam pipe. The beam enters the field cage through a small 3µm-thick window placed at the center of the cathode. The front-end cards (AsAd boards) of the digital electronics are directly connected to the back of the sensor plane via small feed-through boards equipped with o-rings for sealing the inner vol-ume to the exterior.
are multiplied by a Micromegas device [2] consisting of a micro mesh mounted on a pad plane made of a Printed Circuit Board (PCB) where a pattern of 10,240 triangular pads have been etched. On the other side of this PCB high density connectors are used to transfer the signals to the digital electronics. A 3-dimensional image of the tracks left by the charged particles inside the field cage can be reconstructed from a time recording of the signals on each pad. The AT-TPC can be placed inside a large bore MRI solenoid to apply a magnetic field superimposed on the electric field. The resulting curved trajectories can be ana-lyzed to measure the magnetic rigidity of the emitted parti-cles for identification as well as momentum determination. The prototype version of the AT-TPC was built first and is very similar, except for its size, the geometry of the sensor plane and the number of channels [3].
The high density electronics used with the AT-TPC has been specially developed by a collaboration (GET for General Electronics for TPC) [4], that features for each channel a charge preamplifier and shaping amplifier fol-lowed by a 512-cell analog memory and 12-bit ADC for the digitizing section. In addition, this electronics has the unique feature of implementing discriminators on each channel and combining them into a running multiplicity that can be used to generate an internal trigger. This feature is particularly important in an active target as all charged particles entering the field cage do not escape, therefore no external detector can be used to generate a trigger from them. A complete description of the full scale AT-TPC will be available in a forthcoming publication [5].
3 Results
A few results obtained with the AT-TPC detectors are pre-sented. They involve reactions around the Coulomb bar-rier which is the domain most adapted to the active target concept.
3.1 αresonant scattering
αresonant scattering at low energy is an efficient reaction to populate virtual states (also referred to as resonances) of the target+projectile composite system. In the case of αparticles, these resonances may exhibitαclustering ef-fects that are of high interest in the nuclear physics com-munity. The most famousαcluster state is the so-called Hoyle state of12C, that is critical in the description of12C nucleo-synthesis via the tripleαreaction. αcluster states are sought in other light nuclei, that may have equally im-portant impacts on nucleo-synthesis, but are also of great interest in structure models of the nucleus.
Theαclustering resonances in the nuclei10Be [6],14C [7] and more recently 12Be have been investigated with the pAT-TPC using radioactive beams of 6He, 10Be and 8He respectively. The target was composed of 4He gas mixed with a 10% concentration of CO2as quencher. The radioactive beams were produced at the Notre Dame tan-dem facility using the Twinsol device [8] for [6, 7], and the TRIUMF facility for the8He beam.
The results shown below were obtained with the10Be beam, and show a clear separation between the elastic scat-tering events and the inelastic events where10Be was ex-cited to its first 2+state (panel b of fig. 2). The tracks from
4He and10Be were clearly identified from the respective energy losses of the two particles, helped by polarizing every 5th ring of the pad plane to a higher gain for the Micromegas [7], as seen on panel a of the same figure 2. From the track reconstruction, the vertex of the reactions
A. FRITSCHet al. PHYSICAL REVIEW C93, 014321 (2016)
This secondary beam was delivered to the cylindrical target volume of He : CO290 : 10 gas at 1 atm of the PAT-TPC,
measuring 50 cm along the beam axis and 27 cm in diameter. The 10Be energy was measured to be 39.7 (5) MeV by using
silicon detectors. The center-of-mass energyEc.m.decreased from 11.3 MeV to zero while traveling the length of the gas volume. The average rate of10Be that entered the volume was
103ions per second with a total of 3.2×10⁸. The beam purity
was about 35% with main contaminants of4He(2+) (50%),
9Be(4+) (5%), and 10B(4+) (3%).
Electrons from reaction trajectories are guided toward the Micromegas [27] amplifier by an electric field of 0.8 kV/cm parallel to the beam axis. The Micromegas consists of 2-mm-wide radial strips separated into quadrants. A waveform digitizer [28] records the charge as a function of drift time tdrift over 40 µs by using an array of 511 switching capacitors. We increased the amplification gain of every fifth radial strip to measure theα-particle trajectories with lower-energy deposits. The trigger generation required a pair of high-gain strips at radiusr=12 mm to receive signals from radially opposed quadrants.
Figure1(a)shows the recorded charge againsttdriftandr for a scattering event of 10Be from an
αparticle in the gas, where negative and positive radii represent radially opposed quadrants. The discrete αtrajectory is due to the increased sensitivity of the high-gain strips. The laboratory anglesθlab
andEc.m.at the reaction vertex were deduced by accounting for energy deposition and the 2.4 cm/µs electron-drift velocity [25]. Beam particles were differentiated by using the energy loss per unit length obtained from the beam track. Both elastic scattering and inelastic scattering to the 2+
1 state of 10Be at
3.37 MeV were selected by gating on the kinematical cor-relation ofθlab10Be andθα
lab in Fig.1(b). The events along the
θlab10Be+θα
lab=90◦line originate from scattering ofα-particle
contaminants in the beam and in the gas.
III. RESULTS
States of 14C were resonantly populated via scattering of a 10Be beam off4He gas particles. While resonantαscattering
is advantageous for its sensitivity toα-cluster states that favor decay viaαemission [18,19], measurements with a radioactive beam are challenging. A previous study [23,24] suffered
0 30 60 90
0 30 60 90 [deg] lab 10Be [deg] lab (b) tdrift [ s] 0 40
r [cm]0 5 10
-5 -10 (a) 10Be 10Be lab 10Be
lab 0+
2+
FIG. 1. (a) Trajectories of a10Be
+αscattering event. (b)θlab10Bevs θα
labplot with the kinematical curves for elastic and inelastic scattering
to the 10Be 2+
1 state. Data shown have been selected via energy-loss
gating for10Be beam particles.
[deg]
c.m.
θ Ec.m. [MeV]
0 10 20 30 40 50 60
40 60 80 100 120 140
[MeV] c.m. E 2 3 4 5 6 7 8 9 10 (a)
2 3 4 5 6 7 8 9 10
[mb/sr] Ω d / σ d 0 10 20 30 40 + 2 -3 -5 ) -(7 + 4 -5 -5 (b) 0 5 10 15 20 25 30 35
40 60 80 100 120 140
[MeV] c.m. E 2 3 4 5 6 7 8 9 10 (c)
2 3 4 5 6 7 8 9 10
[mb/sr] Ω d / σ d 0 10 20 30
40 (d) 4+5
-FIG. 2. Differential cross sections of 10Be scattering off α
particles: (a) elastic scattering and (c) inelastic scattering to the 2+
1 state of 10Be. The color scale is given in mb/sr. Excitation
functions for (b) elastic and (d) inelastic scattering also are shown. The shaded spectrum is gated byθc.m.=70◦–90◦(45◦–55◦), and the blank spectrum by 90◦–110◦(70◦–80◦) for elastic (inelastic) scattering. The lines indicate identified resonances.
limited angular acceptance, uncertainties in reaction-channel selection, and inaccurate energy calibration. By using the newly developed thick target method [19] for the PAT-TPC [25], we measured cross sections for both elastic and inelastic scattering to the 2+
13.37 MeV state of10Be over a wide range
ofθc.m.as a continuous function ofEc.m.as shown in Fig.2. Characteristic diffractive patterns at several energies can be seen in the spectrum for the elastic channel in Fig.2(a). A total of seven resonances were identified, as indicated in the excitation function of Fig.2(b).
Each diffractive resonance pattern follows the square of the Legendre polynomialPL2(θc.m.) for the angular momentum L. States withJπ
=L(−)L are selectively populated by the L wave because bothαand 10Be are spin-zero. Following previous analyses [18,24], optimal L values were chosen by comparing the angular distributions toPL2 (Fig.3). The measured angular domain ofθc.m.=35◦to 145◦is well suited to extract resonance parameters: potential scattering dominates at forward angles, at backward angles6He cluster exchange
may be dominant, and there is less selectivity forLvalues. There is very good agreement in the oscillatory pattern of the data with the proposed polynomials, giving clear Jπ assignments to the dominant partial-wave contributions of the resonances. We tentatively attribute a (7−) state at 6.5 MeV with a lower-quality fit. More realistic angular distributions were calculated with theR-matrix formalism [29] by using optical-model potential parameters based on 48 MeVα+9Be
elastic-scattering data [30] for a channel radius of 4.7 fm. As one would expect, the experimental distributions are not exactly reproduced due to uncertainties in the optical-model parametrization and the lack of a possible 6He transfer
014321-2 Figure 2. Panel a: typical scattering event recorded in the pAT-TPC, showing the double-gain setup of the Micromegas, by po-larizing every 5thring of the pad plane to a higher gain in order to
better cover the dynamic range differences between the4He and
10Be particles. Panel b: kinematics plot of the angle of10Be vs the angle of4He, where the elastic and inelastic components of the cross section are clearly separated (from [7]).
can be determined event by event, then used to calculate the reaction energy. Excitation functions can then be de-duced as a function of the center-of-mass angle, as shown in panels a and c of fig. 3. The excitation functions show a
A. FRITSCHet al. PHYSICAL REVIEW C93, 014321 (2016)
This secondary beam was delivered to the cylindrical target volume of He : CO290 : 10 gas at 1 atm of the PAT-TPC,
measuring 50 cm along the beam axis and 27 cm in diameter. The 10Be energy was measured to be 39.7 (5) MeV by using
silicon detectors. The center-of-mass energyEc.m.decreased from 11.3 MeV to zero while traveling the length of the gas volume. The average rate of10Be that entered the volume was
103ions per second with a total of 3.2×10⁸. The beam purity
was about 35% with main contaminants of4He(2+) (50%),
9Be(4+) (5%), and 10B(4+) (3%).
Electrons from reaction trajectories are guided toward the Micromegas [27] amplifier by an electric field of 0.8 kV/cm parallel to the beam axis. The Micromegas consists of 2-mm-wide radial strips separated into quadrants. A waveform digitizer [28] records the charge as a function of drift time tdrift over 40 µs by using an array of 511
switching capacitors. We increased the amplification gain of every fifth radial strip to measure theα-particle trajectories with lower-energy deposits. The trigger generation required a pair of high-gain strips at radiusr=12 mm to receive signals from radially opposed quadrants.
Figure1(a)shows the recorded charge againsttdriftandr
for a scattering event of 10Be from anαparticle in the gas,
where negative and positive radii represent radially opposed quadrants. The discreteα trajectory is due to the increased sensitivity of the high-gain strips. The laboratory anglesθlab
andEc.m.at the reaction vertex were deduced by accounting for energy deposition and the 2.4 cm/µs electron-drift velocity [25]. Beam particles were differentiated by using the energy loss per unit length obtained from the beam track. Both elastic scattering and inelastic scattering to the 2+
1 state of 10Be at
3.37 MeV were selected by gating on the kinematical cor-relation ofθlab10Be andθα
lab in Fig.1(b). The events along the
θlab10Be+θα
lab=90◦line originate from scattering ofα-particle
contaminants in the beam and in the gas.
III. RESULTS
States of14C were resonantly populated via scattering of a 10Be beam off4He gas particles. While resonantαscattering
is advantageous for its sensitivity toα-cluster states that favor decay viaαemission [18,19], measurements with a radioactive beam are challenging. A previous study [23,24] suffered
0 30 60 90
0 30 60 90 [deg] lab 10Be [deg] lab (b) tdrift [ s] 0 40
r [cm]0 5 10
-5 -10 (a) 10Be 10Be lab 10Be
lab 0+
2+
FIG. 1. (a) Trajectories of a10Be+αscattering event. (b)θ10Be
lab vs
θα
labplot with the kinematical curves for elastic and inelastic scattering
to the 10Be 2+
1 state. Data shown have been selected via energy-loss
gating for10Be beam particles.
[deg]
c.m.
θ Ec.m. [MeV]
0 10 20 30 40 50 60
40 60 80 100 120 140
[MeV] c.m. E 2 34 5 6 7 8 9 10 (a)
2 3 4 5 6 7 8 9 10
[mb/sr] Ω d / σ d 0 10 20 30 40 + 2 -3 -5 ) -(7 + 4 -5 -5 (b) 0 5 10 15 20 25 30 35
40 60 80 100 120 140
[MeV] c.m. E 2 3 4 5 6 7 8 9 10 (c)
2 3 4 5 6 7 8 9 10
[mb/sr] Ω d / σ d 0 10 20 30
40 4+
-5
(d)
FIG. 2. Differential cross sections of 10Be scattering off α
particles: (a) elastic scattering and (c) inelastic scattering to the 2+
1 state of 10Be. The color scale is given in mb/sr. Excitation
functions for (b) elastic and (d) inelastic scattering also are shown. The shaded spectrum is gated byθc.m.=70◦–90◦(45◦–55◦), and the blank spectrum by 90◦–110◦(70◦–80◦) for elastic (inelastic) scattering. The lines indicate identified resonances.
limited angular acceptance, uncertainties in reaction-channel selection, and inaccurate energy calibration. By using the newly developed thick target method [19] for the PAT-TPC [25], we measured cross sections for both elastic and inelastic scattering to the 2+
13.37 MeV state of10Be over a wide range
ofθc.m.as a continuous function ofEc.m.as shown in Fig.2. Characteristic diffractive patterns at several energies can be seen in the spectrum for the elastic channel in Fig.2(a). A total of seven resonances were identified, as indicated in the excitation function of Fig.2(b).
Each diffractive resonance pattern follows the square of the Legendre polynomialPL2(θc.m.) for the angular momentum L. States with Jπ
=L(−)L are selectively populated by the Lwave because bothαand 10Be are spin-zero. Following
previous analyses [18,24], optimal L values were chosen by comparing the angular distributions toPL2 (Fig.3). The measured angular domain ofθc.m.=35◦to 145◦is well suited to extract resonance parameters: potential scattering dominates at forward angles, at backward angles6He cluster exchange
may be dominant, and there is less selectivity forLvalues. There is very good agreement in the oscillatory pattern of the data with the proposed polynomials, giving clear Jπ assignments to the dominant partial-wave contributions of the resonances. We tentatively attribute a (7−) state at 6.5 MeV with a lower-quality fit. More realistic angular distributions were calculated with theR-matrix formalism [29] by using optical-model potential parameters based on 48 MeVα+9Be elastic-scattering data [30] for a channel radius of 4.7 fm. As one would expect, the experimental distributions are not exactly reproduced due to uncertainties in the optical-model parametrization and the lack of a possible 6He transfer
014321-2
Figure 3. Panels a and c: excitation functions plotted for dif-ferent center-of-mass angle of the reaction for the elastic and in-elastic components of the cross section, respectively. The projec-tions of the excitation funcprojec-tions between angles 70◦- 90◦(shaded spectrum) and 90◦- 110◦(clear spectrum) (from [7]).
number of resonances which can be identified via R-matrix analysis of their angular distributions. In this work 2+and
4+resonances were identified at 3.0 MeV and 7.0 MeV,
respectively and tentatively assigned to a rotational band corresponding to a predicted linear chain structure in14C [9]. The predicted 0+ band head resonance was not
ob-served likely due to the 2 MeV experimental trigger cutoff.
3.2 Proton resonant scattering
Proton resonant scattering has been used extensively using proton beams to extract spectroscopic information on the analog states of the populated resonances in the neutron plus target system of the same isospin. The idea is to pop-ulateT0+12 compound nucleus states of aT0AZnucleus plus a proton that are isospin analogs of bound levels in the A+1Z nucleus. An example can be found in [10] for the case of 41Ar where the authors find good agreement between their deduced spectroscopic factors and those ob-tained from a 40Ar(d,p) transfer reaction. The T
> reso-nances observed in [10] were identified and analyzed by averaging the excitation functions with a width of about 20 keV, in order to smooth out the superimposed T< reso-nances of the40K compound nucleus.
Although many stable isotopes have been studied via this method using intense proton beams of very well de-fined energies, only a few radioactive isotopes with long enough half-lives to make target material could be mea-sured. Carrying this methodology to short-lived radioac-tive nuclei implies the use of radioacradioac-tive beams, therefore inverse kinematics. The motivation for measuring proton resonant scattering on46Ar stems from the observation of the weakening of the N=28 shell gap in isotones of48Ca such as44S and42Si [11, 12]. Located between the doubly magic48Ca and highly deformed44S,46Ar could exhibit
reduced single-particle strength [13], and impose mean-ingful constraints on the effective interactions used in shell model calculations. Investigations using Coulomb excita-tion [14] and transfer reacexcita-tions [15] indicate such a reduc-tion might be small, and using an orthogonal method such as proton resonant scattering offers an alternative way of measuring spectroscopic factors in47Ar.
Performing this type of measurement in inverse kine-matics on radioactive beams requires good quality beam properties. The energy resolution in particular is critical because the reaction energy is deduced from the position of the reaction vertex and the corresponding energy loss of the beam. The re-accelerated46Ar beam used to perform proton resonant scattering on this nucleus had an energy of 4.6 MeV/u with an energy width below 1%, hence an energy resolution around 40 keV/u. This radioactive beam was first produced via projectile fragmentation of a 140 MeV/u48Ca primary beam on a9Be target, filtered by the A1900 fragment separator, then stopped in a gas cell be-fore being injected into an electron beam charge breeder, accelerated by the ReA3 linac and delivered to the AT-TPC. The average beam intensity was around 1,500 par-ticles per second, with a small admixture (around 10%) of the stable60Ni and a few % of the46Ar daughter and grand-daughter 46K and46Ca. A small ion chamber was placed in front of the AT-TPC to measure the energy loss of the incoming particles for identification. Fig. 5 shows the vertex position distribution observed in this experi-ment, where the sharp falloffcorresponds to the entrance window of the field cage. The position resolution obtained from fitting the falloffedge of the distribution is 14.1 mm FWHM, which corresponds to an energy resolution of 43.3 keV/u FWHM.
Several challenges were encountered during this ex-periment. In particular, the large difference in energy loss between the46Ar and proton caused saturation and distor-tion effects in the electronics that required extensive clean-ing of the data durclean-ing the analysis phase. Unlike in the 10Be+4He experiment presented above, individual polar-ization of the 10,240 pads of the AT-TPC was not avail-able to reduce the avalanche gain of the pads on which the46Ar beam tracks were projected. This shortcoming is now being addressed via electronically controlled protec-tion boards that allow the polarizaprotec-tion of individual pads to be set programmatically.
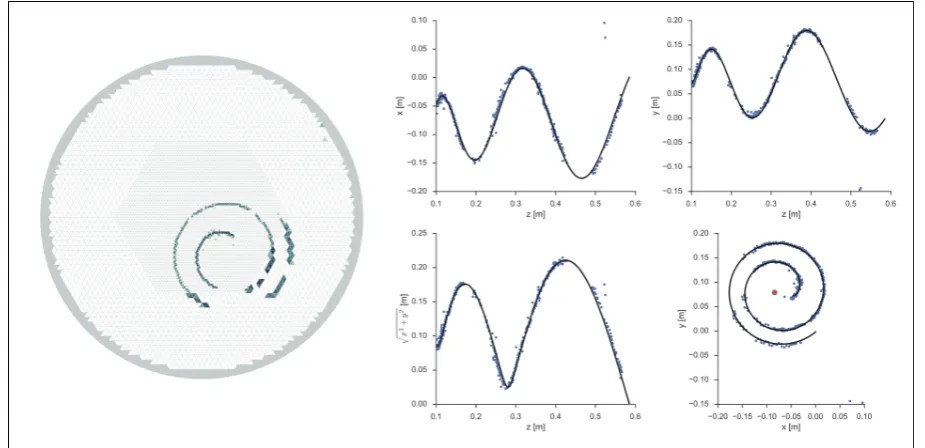
The proton scattering event displayed in fig. 4 has been processed using image recognition algorithms such as the Hough transform to remove noise and spurious data. The left-hand side shows the pad plane projection of the event, while the right-hand side shows projections of the same event together with the result of the Monte-Carlo fitting used to model the event and extract its physical parame-ters such as vertex energy, scattering and azimuthal angles. More details on the analysis method can be found in [5]. The gas target used in this experiment was C4H10at about 20 Torr, therefore events corresponding to scattering on 12C nuclei had to be rejected from the analysis. The final phase of this complex analysis is still ongoing and will be the subject of a publication in the near future.
Figure 4. Typical event observed in46Ar+p scattering. The spiral track corresponds to the recoil proton orbiting in the 1.7 Tesla solenoidal field and slowing down in the gas. The hit pattern (left) and projections (right) show the data after processing designed to remove noise and cross talk, resulting in significant fragmentation of the track. The right-hand side projections have the results of the Monte-Carlo fit superimposed on the data. The red dot indicates the center of the spiral as guessed from the initial circular Hough transformation algorithm.
Figure 5.Vertex position distribution measured for the46Ar+p reaction. The sharp falloffcorresponds to the entrance window of the field cage. The inset shows the detail of the falloffand the fit function used to estimate the resolution.
3.3 Fusion
For the same reasons as explained in the previous sections, the AT-TPC is particularly well adapted to measure fusion cross section excitation functions. The following results were obtained using a 10Be radioactive beam produced by the Twinsol device at the University of Notre Dame [16]. Using P10 gas (90% Ar and 10% CH4) in the pAT-TPC, the fusion cross section between10Be and40Ar was measured with very low beam intensity (100 counts per second). The selection and identification of fusion events was achieved using the range and energy loss information
about 20% greater than those shown in thisfigure. Since10Be is
tightly bound, its fusion cross section should follow the systema-tics for stable nuclei, especially at energies well above the Cou-lomb barrier. The expected cross section was calculated using the PACE4 fusion-evaporation code contained within the LISEþ þ package[13]and is shown by the corresponding curve inFig. 9. Apart from employing the“quantum-mechanical”option to prop-erly account for near- and sub-barrier fusion, all the default parameters were selected.
The most likely cause of the 20% discrepancy is a problem in the pre-scaling procedure used to determine the absolute nor-malization. However, since we only became aware of this issue well after the experiment was conducted, we were unable to verify this hypothesis. Other possibilities, such as an incorrect measure of the gas pressure, were considered and could be discarded on the basis of the observed range of the ions in the pAT-TPC. As a result, the absolute normalization of all the data was obtained by scaling the three highest-energy experimental total fusion data points to the cross sections predicted by PACE4.
Since the emission of charged particles from the fused system could be directly observed, as shown inFig. 8, the cross sections corresponding to charged-particle-associated fusion (CP) and fu-sion with the emisfu-sion of only neutrons (NCP) could be separately determined. These excitation functions are also shown inFig. 9. The absolute normalization in both cases is exactly that used to calculate the total fusion yield, i.e., not the one deduced from the pre-scaled trigger rates during the normalization runs.
3.3. Comparison with theory
The fusion cross sections illustrated inFig. 9are compared with the predictions of PACE4 for a P10 gas target, which contains a substantial amount of12C. In principle, fusion of 10Be with12C
could be separated from that with40Ar using the range of the
recoiling fusion product. However, the10Be
þ40Ar fusion products have a low-enough energy that their stopping power is mainly due to nuclear effects. As a result, their range is similar enough to that of the10Be
þ12C fusion products that it becomes difficult to reliably separate them in practice. As will be discussed in the following paragraph, however, fusion with40Ar dominates above an incident
10Be energy of about 14 MeV. In this region the comparison
be-tween theory and experiment is very good, though there is an indication of a small excess of NCP fusion throughout the range and a deficit of CP fusion above about 27 MeV. It is not clear whether these are experimental effects or deficiencies of the
PACE4 predictions.
The12C and40Ar fusion cross sections could be approximately
separated, though, by comparing the observed ratio of CP fusion to total fusion with the PACE4 prediction, as illustrated inFig. 10. Above about 16 MeV this ratio is in good agreement with the theoretical prediction, although the above-mentioned excess of NCP fusion throughout the region and the deficit of CP fusion above about 27 MeV are even more clearly seen here. The pre-dicted ratio begins to be dominated by fusion with12C below
14 MeV, and the experimental data there are also in good agree-ment with theory although the error bars are large due to the low cross sections in this region.
4. Summary and conclusions
The fusion excitation function for10Be
þ40Ar has been mea-sured in the c.m. energy range from 12–24 MeV using the proto-type active-target time projection chamber (pAT-TPC) developed at Michigan State University. The incident10Be rate was limited to
100 Hz by the data-collection electronics. Despite that severe constraint, excellent-statistics data were obtained during a single 90-h run, illustrating the very high efficiency of this detector. Cross sections as low as 12 mb were measured with acceptable (50%) statistical accuracy, and charged-particle-associated evaporation cross sections could also be determined. The count-rate capability of the data-collection electronics has already been improved by a factor of two since this experiment was carried out, and devel-opment of a new generation of electronics allowing an anticipated maximum acceptance rate of up to 1000 Hz is underway[14]. It should also be mentioned that, while a10Be rate of up toE105Hz
is available fromTwinSol, a more realistic upper limit ofE104Hz
is imposed by the drift time of the particle tracks. This would imply that the data reported here could be collected in only 1.5 h with the improved electronics, or even considerably less if a very pure beam were available. However, the focus of this experiment was to illustrate that excellent fusion data can be obtained in a reasonable period of time with very weak beams.
The agreement between evaporation-model theory and ex-periment in the present exex-periment was very good, but separating
Fig. 9.Experimental total fusion cross section (triangles), fusion with neutron emission (dots), and fusion with emission of charged particles (squares). The curves are calculations using the PACE4 code. The total fusion cross section and prediction have been multiplied by a factor of three, and the charged-particle associated cross section and prediction have been divided by a factor offive, in order to sufficiently separate the data sets on this plot. See the text for a discussion of the absolute normalization.
Fig. 10.Observed ratio of charged-particle-associated fusion to total fusion. PACE4 calculations of this ratio for a P10 target, for40Ar, and for12C are also shown.
J.J. Kolata et al. / Nuclear Instruments and Methods in Physics Research A 830 (2016) 82–87 86
Figure 6. Excitation function of the40Ar+10Be fusion cross section. The total fusion cross section, as well as fusion cross section where a charged particle was emitted (CP) or not (NCP) are compared to Pace4 calculations (from [16]).
recorded by the detector. The observation of events where a charged particle was emitted during the reaction enabled us to separate fusion cross sections in different categories, as shown in fig. 6.
4 Conclusion
The active target concept combined with a time projection chamber detector shows promising prospects for experi-ments using rare radioactive beams in inverse kinematics at energies close to the Coulomb barrier. Several
experi-ments have already shown interesting results in the study of α clustering states of neutron-rich nuclei and fusion cross section measurements. Resonant proton scattering turns out to be more challenging experimentally, in par-ticular due to the large size difference between the beam and recoil particle, but the first experiment conducted with a re-accelerated beam of 46Ar from the ReA3 linac at NSCL shows the potential of this method for exploring the single-particle structure of nuclei far from stability. Sev-eral improvements aimed at mitigating the shortcomings observed during this commissioning run are well under way, and will greatly benefit future experiments.
5 Acknowledgements
This work is supported by the US National Science Foun-dation under Grants No. MRI09-23087, No. PHY09-69456 and No. PHY14-01343.
References
[1] S. Beceiro-Novo et al.,Prog. in Part. and Nucl. Phys.
84, 124 (2015).
[2] Y. Giomataris et al., Nucl. Instrum. Methods Phys. Res. A376, 29 (1996).
[3] D. Suzuki et al.,Nucl. Instrum. and meth. in Phys. Res. A691, 39 (2012).
[4] E. Pollacco et al.,Physics Procedia37, 1799 (2012). [5] J. Bradt et al., submitted to Nucl. Instrum. Methods
Phys. Res. A(2017).
[6] D. Suzuki et al.,Phys. Rev. C87, 054301 (2013). [7] A. Fritsch et al.,Phys. Rev. C93, 014321 (2016). [8] F. Becchetti et al.,Nucl. Instrum. Methods Phys. Res.
A505, 377 (2003).
[9] T. Suhara et al.,Phys. Rev. C82, 044301 (2010). [10] H. L. Scott et al.,Phys. Rev.172, 1139 (1968). [11] C. Force et al.,Phys. Rev. Lett.105, 102501 (2010). [12] B. Bastin et al.,Phys. Rev. Lett.99, 022503 (2007). [13] A. Gade et al.,Phys. Rev. C93, 054315 (2016). [14] S. Calinescu et al.,Phys. Rev. C93, 044333 (2016). [15] L. Gaudefroy et al., Phys. Rev. Lett. 97, 092501
(2006).
[16] J. J. Kolata et al.,Nucl. Instrum. Methods Phys. Res. A830, 82 (2016).