CMD-3 Overview
Ivan B.Logashenko1,2,?,??F.V.Ignatov1, R.R.Akhmetshin1, A.N.Amirkhanov1,2, A.V.Anisenkov1,2, V.M.Aulchenko1,2, V.S.Banzarov1, N.S.Bashtovoy1, D.E.Berkaev1,2, A.E.Bondar1,2, A.V.Bragin1, S.I.Eidelman1,2, D.A.Epifanov1,2, L.B.Epshteyn1,2,3, A.L.Erofeev1,2, G.V.Fedotovich1,2, S.E.Gayazov1,2, A.A.Grebenuk1,2, S.S.Gribanov1,2, D.N.Grigoriev1,2,3, V.L.Ivanov1,2, S.V.Karpov1, V.F.Kazanin1,2, A.N.Kirpotin1, A.A.Korobov1,2, I.A.Koop1, A.N.Kozyrev1,2, E.A.Kozyrev1,2, P.P.Krokovny1,2, A.E.Kuzmenko1,2, A.S.Kuzmin1,2, P.A.Lukin1,2, K.Yu.Mikhailov1,2, V.S.Okhapkin1, A.V.Otboev1, Yu.N.Pestov1, A.S.Popov1,2, G.P.Razuvaev1,2, A.A.Ruban1, N.M.Ryskulov1, A.E.Ryzhenenkov1,2, A.I.Senchenko1,2, V.E.Shebalin1,2, D.N.Shemyakin1,2, B.A.Shwartz1,2, D.B.Shwartz1,2, A.L.Sibidanov4, P.Yu.Shatunov1, Yu.M.Shatunov1,2, E.P.Solodov1,2, A.A.Talyshev1,2, A.I.Vorobiov1, Yu.V.Yudin1,2, I.M.Zemlyansky1
1Budker Institute of Nuclear Physics, SB RAS, Novosibirsk, 630090, Russia
2Novosibirsk State University, Novosibirsk, 630090, Russia
3Novosibirsk State Technical University, Novosibirsk, 630092, Russia
4University of Victoria, Victoria, British Columbia, Canada V8W 3P6
Abstract. The CMD-3 detector is installed at the VEPP-2000 e+e−
collider at BINP (Novosibirsk, Russia). It is a general-purpose detector, equipped with a tracking sys-tem, two crystal (CSI and BGO) calorimeters, liquid Xe calorimeter, TOF and muon systems. The main goal of experiments at CMD-3 is a study of exclusive modes of
e+e−→
hadronsat energies √s≤2 GeV. In particular, these results provide an impor-tant input for calculation of the hadronic contribution to the muon anomalous magnetic moment.
The first round of data taking was performed in 2011–2013, when about 60 1/pb were taken in the center-of-mass (c.m.) energy range from 0.32 to 2.0 GeV. Here we present a survey of results of data analysis.
Between 2013 and 2016 the collider and the detector were upgraded. The data taking resumed by the end of 2016. In the first run after the upgrade about 50 1/pb were collected at the energy range between 1.28 and 2.007 GeV. We discuss the upgrade and the first preliminary results from the new data.
1 Introduction
The electron-positron collider VEPP-2000[1, 2] started operation at Budker Institute of Nuclear Physics (Novosibirsk, Russia) in 2010. The machine covers the c.m. energy range from √s=0.32
GeV to 2.0 GeV and employs the technique of round beams. Two detectors, CMD-3[3] and SND[4] are installed in the two interaction regions of VEPP-2000.
?e-mail: [email protected]
??This work is supported in part by the Russian Science Foundation (project 14-50-00580) and RFBR grants 16-02-00160-a,
hexagonal cells is surrounded by the Z-chamber, a MWPC with a dual anode and cathode readout, used for precise determination of the fiducial volume for charged particles. The barrel electromag-netic calorimeter [5], placed outside the superconducting solenoid (0.13X0, 13 kGs), is composed
of two systems: the Liquid Xenon (LXe) calorimeter (about 5.4X0), surrounded by the CsI crystal
calorimeter [6] (about 8.1X0). The LXe calorimeter has 7 layers and utilizes dual readout: the anode
signals are used for a measurement of the total energy deposition, while signals from the cathode strips provide information about a shower profile and are used to measure the coordinates of the photon con-version point to 1-2 mm precision. The endcap BGO crystal calorimeter (about 13.4X0) operates in
the main magnetic field. The time-of-flight system, made of plastic scintillators with PMT readout, is placed between the two layers of the barrel calorimeter. The detector is surrounded by the muon range system.
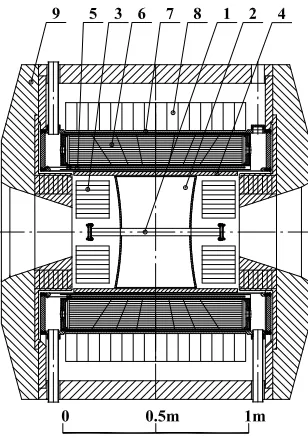
Figure 1.CMD-3 detector: 1 – beam pipe, 2 – drift chamber, 3 – BGO calorimeter, 4 – Z-chamber, 5 – superconducting solenoid, 6 – LXe calorimeter, 7 – TOF system, 8 – CsI calorimeter, 9 – yoke. The muon range system, not shown, is placed outside the yoke.
The primary goal of experiments at VEPP-2000 is a measurement of cross sections of various modes ofe+e− → hadronsin the whole available c.m. energy range up to 2 GeV. The precision of the total cross section ofe+e− → hadronsis closely related to the problem of the muon anomalous magnetic moment,aµ. The value ofaµis predicted within the Standard Model (SM) to about 0.42 ppm.
The accuracy of calculation is limited by the knowledge of the hadronic (QCD) contributionaµ(had),
Figure 2.Average luminosity of VEPP-2000 at different energies. Red points — 2011–2013 runs, green points — 2017 run.
Figure 3. Integrated luminosity collected by CMD-3 at different energies with 20 MeV energy bins. Blue — 2011–2013 runs, green — 2017 run. The line shows the effective ISR integrated lumi-nosity at BaBar.
2 Results from 2011–2013 runs
The first round of data taking after VEPP-2000 commissioning was done in 2011–2013. In 2011 and 2012 the data were collected in the c.m. energy range from 1.0 GeV to 2.0 GeV with a 25 MeV step in 2011 and slightly larger step in 2012. About 30 pb−1were collected, with about 10 pb−1above the
NNthreshold. In 2013 a c.m. energy scan from 1.0 GeV down to 0.32 GeV was performed in 20 MeV steps, with finer steps up to 2 MeV close to theω(782) resonance. About 20 pb−1were collected, with
about 8 pb−1near theω(782) peak. In each season some amount of data was taken near theφpeak to
calibrate the detector subsystems. Starting from 2012 the beam energy was continuously monitored with high precision∆E/E<10−4using Compton backscattering of laser photons at the electron beam
[10, 11].
The collider performance is illustrated in Fig. 2. The peak VEPP-2000 luminosity observed in 2011–2013 was significantly lower than the design expectations at energies √s > 1.2 GeV, up to
a factor of 10 at the maximum energy of 2 GeV. The main limitating factors were: the deficit of positrons significant for √s > 1.2 GeV, and the upper limit of the booster ring energy at 0.825
GeV, which forced to ramp beam up and down at each injection into the main VEPP-2000 ring. The integrated luminosity collected in 2011–2013, is similar to that available at BaBar using ISR (Fig. 3). The analysis of data collected in 2011–2013 is in progress. All major channels are under analysis including channels with up to 6 pions or 2 kaons and 2 pions in the final state. The luminosity is measured to 1% usinge+e−→e+e−ande+e−→γγevents [12].
The CMD-3 collaboration published several results with a few charged particles in the final state:
e+e−→3(π+π−) [13],e+e−→K+K−π+π−[14],e+e−→ pp¯[15] ande+e−→ K
SKL[16] around the φ-meson withKS → π+π−. The most recent results are the measurement of cross sectionse+e− → π+π−π0η[17] ande+e−→π+π−π+π−nearφ(1020) [18].
The total cross sectione+e−→π+π−π0ηwas measured for the first time in the c.m. energy range
from threshold to 2 GeV. Several intermediate states are identified:ω(782)η,φ(1020)η,a0(980)ρ(700)
and an additional contribution possibly due toρ(1450,1700)π.
Figure 4.Comparison of the CMD-3 measurement of
e+e− →
K+K−
to previous measurements at CMD-2 [19, 20] and SND [21].
Figure 5. Comparison of the CMD-3 measurement of
e+e− →
K+K−
to the recent BaBar measurement [22] using ISR approach.
decay is observed, allowing to measure the branching ratio of G-parity and OZI-suppressed decay
B(φ→π+π−π+π−)=(6.5±2.7±1.6)×10−6.
Thee+e− → K+K−cross section was measured at theφ-meson energy range to 2% systematic accuracy. The CMD-3 result is above all previous measurements [19–22] (Fig. 4 and 5) and is in perfect agreement with isospin symmetry: comparing with the recent CMD-3 measurement ofe+e−→ KSKL[16], the ratio of coupling constants with the Coulomb factor taken into account
gφK+K−
gφKSKL
q
Z(m2 φ)
=0.990±0.017.
The preliminary results of the measurement of the dominant cross section e+e− → π+π− are discussed in the separate paper [23].
3 Collider and detector upgrades, 2013-2016
After the first full scan of the whole VEPP-2000 energy range, the collider operation was suspended for 3 years to implement a number of improvements. A new injection complex VEPP-5 was com-missioned at BINP in 2016. A new 200 m beamline was constructed, which connected the injection complex with VEPP-2000. That allowed to replace the old VEPP-2000 electron/positron source with the beams coming from the injection complex and completely resolved the problem of positron deficit. A second big improvement of VEPP-2000 was an increase of the maximum energy of the booster ring to match that of the main VEPP-2000 ring. That made it possible to inject beams to the main ring in the whole available energy range without energy ramping.
The major CMD-3 upgrade was a replacement of the time-of-flight system, located between the LXe and CsI barrel calorimeters [24, 25]. The new system is composed from about 200 strips of organic scintillator with shifter fiber readout and two silicon photomultiplier (SiPM) photodetectors per strip. The new system has high efficiency and time resolution of 0.5−0.7 ns. Other detector
Ec.m., MeV 1500 1600 1700 1800 1900 2000
)), nb -π + π 3( → -e + (e σ 0 0.2 0.4 0.6 0.8 1 1.2 1.4 1.6
Figure 6. Preliminary results of the CMD-3 mea-surement of thee+e− →
3(π+π−
) cross section using 2017 data (red squares) in comparison with the previ-ous CMD-3 measurement [13] (black dots) and BaBar measurement (green open circles).
Ec.m., MeV
1820 1840 1860 1880 1900 1920 1940
)), nb -π + π 3( → -e + (e vis σ 0.9 1 1.1 1.2 1.3 1.4
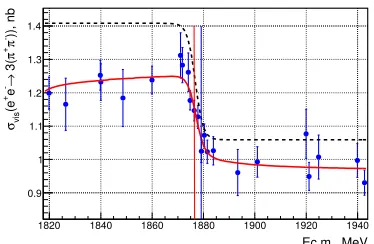
Figure 7.Fit of thee+e−→
3(π+π−
) cross section near theNNthreshold (CMD-3, 2017 data). The curves are described in the text. The vertical lines show the pp
andnnproduction thresholds.
The commissioning of the collider and the detector was done in 2016 and CMD-3 resumed data taking at the beginning of 2017. The VEPP-2000 luminosity in 2017 data taking is shown in Fig. 2 with green points. Significant improvement by a factor of 2 to 8 compared to 2011–2013 is observed.
4 The 2017 run
Overall, about 50 pb−1were collected in Feb.-Jun. 2017 in the energy range from 1.28 GeV to 2.007
GeV. The integrated luminosity collected at different energies is shown in Fig. 3 as a green histogram. About 30 pb−1were collected in≈1 pb−1units distributed almost uniformly over the scanned energy
range. The rest 20 pb−1 were collected at two particular energies: 2.007 GeV and near the NN
threshold.
About 4 pb−1 were collected at √s = 2.007 GeV, the highest energy accessible at VEPP-2000.
These data were recorded to investigate a possibility of a search for direct production ofD∗0(2007)
ine+e−annihilation. Observation of such production at any level above the SM predictionB(D∗0 →
e+e−)∼O(10−19) would be a clear signal of physics beyond SM [26].
Previously, a drop of the cross section ofe+e− → 3(π+π−) at the NN threshold was observed [13]. To study the behaviour of various modes ofe+e−→hadronsat theNNthreshold, in 2017 we scanned the c.m. energy range around the threshold in small steps of 1.2 MeV, approximately equal to the beam energy spread. About 15 pb−1were collected in the energy range 1.872≤ √s≤1.884 GeV.
The preliminary result of the measurement of thee+e−→3(π+π−) cross section using 2017 data is shown in Fig. 6. We confirmed the sharp drop in the cross section. The fit of the visible cross section with the step-like function
σBorn(E)=a+
b
1+exp
E−Ethr w ,
spread, isw=1.496±0.063 MeV.
References
[1] P.Yu. Shatunovet al., Phys. Part. Nucl. Lett.13(2016) 995. [2] D. Shwartzet al., PoS ICHEP2016 (2016) 054.
[3] B. I. Khazinet al., Nucl. Phys. Proc. Suppl.181-182(2008) 376. [4] M. N. Achasovet al., Nucl. Instrum. Meth. A598(2009) 31. [5] V. E. Shebalinet al., Nucl. Instrum. Meth. A824(2016) 710. [6] V. M. Aulchenkoet al., JINST10(2015) P10006.
[7] G. W. Bennettet al.[Muon g-2 Collaboration], Phys. Rev. D73(2006) 072003.
[8] I. Logashenkoet al.[Muon g-2 Collaboration], J. Phys. Chem. Ref. Data44(2015) 031211. [9] Naohito Saito [J-PARC g-’2/EDM Collaboration], AIP Conf.Proc. 1467 (2012) 45-56. [10] E. V. Abakumovaet al., Nucl. Instrum. Meth. A744(2014) 35.
[11] E. V. Abakumovaet al., JINST10(2015) T09001. [12] A. E. Ryzhenenkovet al., JINST12(2017) C07040. [13] R. R. Akhmetshinet al., Phys. Lett. B723(2013) 82. [14] D. N. Shemyakinet al., Phys. Lett. B756(2016) 153. [15] R. R. Akhmetshinet al., Phys. Lett. B759(2016) 634. [16] E. A. Kozyrevet al., Phys. Lett. B760(2016) 314. [17] R. R. Akhmetshinet al., Phys. Lett. B773(2017) 150. [18] R. R. Akhmetshinet al., Phys. Lett. B768(2017) 345. [19] R. R. Akhmetshinet al., Phys. Lett. B364(1995) 199. [20] R. R. Akhmetshinet al., Phys. Lett. B669(2008) 217. [21] M. N. Achasovet al., Phys. Rev. D94(2016) 112006. [22] J.P. Leeset al., Phys. Rev. D88(2013) 032013.
[23] F. Ignatovet al., “Preliminary results on CMD-3 measurement ofe+e−→π+π−cross section”, this volume.
[24] G. V. Fedotovichet al., JINST9(2014) C09022. [25] A. N. Kozyrevet al., JINST12(2017) C07027.

![Figure 4. Comparison of the CMD-3 measurement ofe+e− → K+K− to previous measurements at CMD-2[19, 20] and SND [21].Figure 5](https://thumb-us.123doks.com/thumbv2/123dok_us/7993121.1326859/4.482.45.439.80.211/figure-comparison-cmd-measurement-previous-measurements-cmd-figure.webp)