Utilisation of JSI TRIGA Pulse Experiments for
Testing of Nuclear Instrumentation and Validation
of Transient Models
Ingrid Vavtar Reactor Physic Division F-8
Jožef Stefan Institute Ljubljana, Slovenia [email protected]
Anže Pungerčič Reactor Physic Division F-8
Jožef Stefan Institute Ljubljana, Slovenia [email protected]
Luka Snoj
Reactor Physic Division F-8 Jožef Stefan Institute
Ljubljana, Slovenia [email protected]
I. INTRODUCTION
A vital phase in the development of nuclear instrumentation detectors and associated electronic data acquisition systems is experimental testing and qualification in a well-characterized and representative radiation field in a reference irradiation facility. The 250 kW Jožef Stefan Institute (JSI) TRIGA Mark II research reactor is a very well characterized reactor in terms of the knowledge of the neutron and gamma fields, a product of the work performed at the JSI over the last decade, mostly in collaboration with the Instrumentation, Sensors and Dosimetry Laboratory at CEA, Cadarache [1]-[5]. The neutron flux level in the JSI TRIGA reactor in steady state mode is on the order of 1E13 n/cm2s, which is too low for do MTR relevant testing. However in pulse mode operation the JSI TRIGA reactor can achieve 1 GW for approximately 5-10 ms thus achieving MTR relevant testing conditions for a short time. Moreover pulse operation can be used for experimental validation of reactor transient modelling.
In order to support pulse experimental campaigns data from all pulse experiments was collected and is publicly available at http://
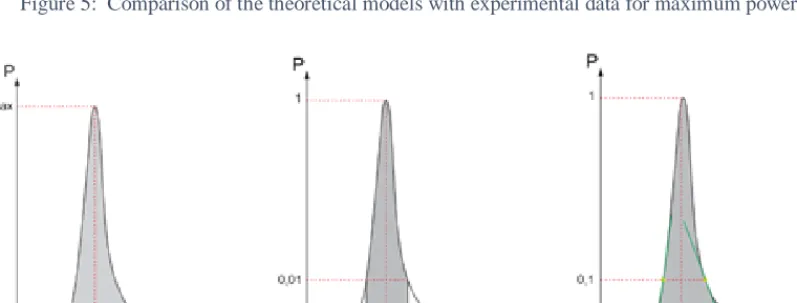
trigapulse.ijs.si/. In addition a comparison of measured pulse physical parameters (maximal power, total released energy and full width at half maximum) was made with theoretical predictions from the Fuchs-Hansen and the Nordheim-Fuchs models. The FH model was used for evaluation of experimental uncertainties. It was shown that experimental data follows the theoretical models, but in some cases there is a large deviation, which can be attributed to large experimental uncertainties and uncertainties of the theoretical models.
The validated models will be used to support future experimental campaigns, where nuclear instrumentation and data acquisition systems for fast transient measurements will be tested.
II. TRIGA MARK II
The TRIGA research reactor at JSI is a 250 kW TRIGA Mark II reactor. It is a light water pool-type reactor cooled by natural convection. The reactor core is placed at the bottom of a 6.25 m high open aluminum tank, measuring 2 m in diameter (seeFigure 1) and is filled with demineralized water. The core shape is cylindrical and there are 91 locations in the core, which can be occupied by fuel rods, neutron source, irradiation channels and control rods (see Figure 2).
The fuel elements are cylindrical shape with a homogeneous mixture of uranium and zirconium hydride coated in stainless steel. In the TRIGA reactor are four control rods, three control rods with fuel extensions and transient control rod with void instead fuel extension. In the control rods the absorber is boron carbide (B4C)). Elements in the core are arranged in six concentric rings with 1, 6, 12, 18, 24 and 30 available locations. Each location corresponds to a hole in the aluminum upper and lower grid plates of the reactor, which confine the reactor core. The core is surrounded by a graphite reflector enclosed in aluminum casing. The pulsed experiment is performed using a pulse rod system where the inserted transient control rod is ejected from the reactor core by pneumatic system. [6]-[7]
Abstract—A pulse experiment model was validated in order to support future pulse experimental campaigns. All pulse experiments data was collected and are publicly available at http://trigapulse.ijs.si/. A comparison of the measured pulse physical parameters (maximal power, total released energy and full width at half maximum) and theoretical predictions (Fuchs-Hansen and the Nordheim-Fuchs models) was made.
III. PULSE EXPERIMENT
After a quick ejection of the transient control rod from the reactor at pulse experiment, the reactor becomes prompt supercritical in a short time, a few 10 ms, and the power begins to increase exponentially. The change in power and consequently, the fuel temperature affects the decrease of the reactivity due to the prompt negative temperature reactivity coefficient of the fuel, which makes the reactor establish a new equilibrium state quickly and efficiently.
Due to the decrease of the reactivity the chain reaction is slowed down or interrupted, resulting in a decrease in power. The peak power of the pulse reaches some MW and the total released pulse energy is relatively small (typically a few MJ) due to the short pulse time.
In the TRIGA reactor, the temperature reactivity coefficient of fuel is the strongest and most important feedback effect of the reactor state on reactivity. The
Figure 1: Side view of the TRIGA Mark II reactor. [7]
temperature reactivity coefficient of fuel αgis defined as:
𝛼𝛼𝑔𝑔=𝛥𝛥𝑇𝑇∆𝜌𝜌 𝑔𝑔,
(1)
where∆ρis the change in the reactivity of the reactor and ΔTgis the change in the average fuel temperature in the entire reactor core.
The reason for an effective and prompt temperature feedback mechanism is in the special fuel composition, which is a homogeneous mixture of 20 % enriched uranium and zirconium hydride (ZrH ratio 1.6). Since hydrogen in the zirconium hydride serves as moderator, most moderation takes place in the fuel element itself and only a small part in the water surrounding the fuel elements. Consequently, any change in power and therefore also the change in fuel temperature immediately reflects on the moderator in the fuel element. Therefore, both the fuel and the moderator immediately affect back the reactivity of the core. Since the change in fuel temperature affects reactivity in different ways, the negative temperature reactivity coefficient of fuel is the sum of several contributions. The Doppler effect in the fuel and the shift of the thermal part of the neutron spectrum to higher energies contribute the most to the prompt negative temperature reactivity coefficient of the fuel in the TRIGA reactor.
The basis of the Doppler's phenomenon is broadening of resonances (see Figure 3) for the capture of the neutron in the uranium 238U, which increases the absorption of neutrons and thus reduces reactivity.
Figure 3: Shape of the resonance with mean energy 6.67eV in uranium 238𝑈𝑈depending on energy at three different
temperatures. [8]
Another important contribution is the shift of the thermal part of the neutron spectrum to higher energies or spectrum hardening. Since the peak of the neutron spectrum (see Figure 4) is moved to higher energies, where the microscopic cross section for fission on the uranium 235Uis smaller, the neutron flux is reduced, followed by a decrease in reactivity.
Figure 4: Lethargy neutron spectrum in standard (12 w/o) fuel in TRIGA Mark II reactor at JSI for two temperatures.
Lethargy is defined as 𝑢𝑢 = 𝑙𝑙 𝑛𝑛 (𝐸𝐸0
𝐸𝐸)and lethargy neutron
spectrum is neutron spectrum multiplied with energy.
IV. THEORETICAL MODEL
Theoretical model for the description of pulses is the Fuchs-Hansen adiabatic model [10], derived from the equations of the point reactor kinetics on the basis of four assumptions. The first assumption is that the system is adiabatic or that the fuel does not exchange heat with the environment and consequently all the energy released is used to heat the fuel. Another assumption is that all delayed neutrons can be ignored. Both of these assumptions are good, because the pulse time is short and there is no significant heat transfer during this time and also the time is short compared to the time when the delayed neutrons are released. The third assumption is that the power of the reactor before the pulse was low or equal zero. This assumption is valid, as the reactor is initially subcritical or at low power and the source of the neutrons in the reactor is not strong. The last assumption is instant reactivity change, which is valid due to rapid withdrawal of the transient control rod from the reactor. If we take into account the first two assumptions in the equations of point kinetics, one equation of point kinetics is obtained:
𝑑𝑑𝑑𝑑(𝑡𝑡) 𝑑𝑑𝑡𝑡 =
𝜌𝜌(𝑡𝑡) − 𝛽𝛽
𝛬𝛬 𝑑𝑑(𝑡𝑡), (2)
where Pis power, ρis inserted reactivity, βeffective delayed neutron fraction (TRIGA: β = 1$ = 0.007 [6]), Λis average generation time or time between the birth of a neutron and death with fission. Average generation time can be calculated as: 𝛬𝛬 = 𝑙𝑙/𝑘𝑘, where l is average lifetime of prompt neutrons or time between the birth of a neutron and death with absorption or leakage and k is the multiplication factor. In derivation, it is also important to define the prompt reactivity ρ′:
𝜌𝜌′ = 𝜌𝜌 − 𝛽𝛽. (3)
From the first assumption, it follows that the reactivity during the pulse decreases proportionally to the released energy or the resulting fuel temperature:
where γ is effective temperature reactivity coefficient of fuel and E(t)total energy released during the pulse:
𝐸𝐸(𝑡𝑡) = ∫ 𝑃𝑃(𝑡𝑡𝑡𝑡 ′)𝑑𝑑𝑡𝑡′
0 .
(5)
By solving the Fuchs-Hansen adiabatic model described above, the time dependence of power P(t)and released energy E(t) can be determined:
Considering the third assumption in equations (6)and
(7)the maximum power Pmaxcan be predicted:
𝑃𝑃𝑚𝑚𝑚𝑚𝑚𝑚≈ 𝜌𝜌 ′2
2𝛾𝛾𝛾𝛾 (8)
and total energy released during pulse 𝐸𝐸:
lim
𝑡𝑡→∞𝐸𝐸(𝑡𝑡) ≅
2𝜌𝜌′
𝛾𝛾 . (9)
The total energy released does not depend on the average generation time and is therefore the same for fast and thermal reactors. Unlike the total energy released, the maximum power is inversely proportional to the average generation time and is therefore higher in fast reactors than in thermal reactors, although the total energy released is comparable. The average generation time in the thermal reactor is Λt= 10−4− 10−3sand in the fast reactor is Λf= 10−8− 10−7s. In the case of an effective temperature reactivity coefficient of fuel the inverse proportionality of both the maximum power and the total energy released can be seen, which is desirable from a safety point of view, because this part minimizes the effect of an increase in reactivity.
In addition to the maximum power and the total energy released, there is another limit value of the pulse experiment, full width at half maximum (FWHM). Full width at half maximum is defined as:
𝐹𝐹𝐹𝐹𝐹𝐹𝐹𝐹 = 𝑡𝑡2− 𝑡𝑡1, (10)
where t1 and t2 represents times, when pulse reaches half of the maximum power:
𝑃𝑃𝑚𝑚𝑚𝑚𝑚𝑚
2 = 𝑃𝑃(𝑡𝑡1, 𝑡𝑡2). (11)
Full width at half maximum is determined as:
𝐹𝐹𝐹𝐹𝐹𝐹𝐹𝐹 =3.525𝛾𝛾𝜑𝜑′ . (12)
In addition to the Fuchs-Hansen model, there is also the Nordheim-Fuchs model [11], which on the basis of the same assumptions with a slightly different execution procedure, leads to the same limit values.
V. COMPARISON OF THEORETICAL MODELS AND EXPERIMENTAL VALUES
The data from pulse experiments that have been carried out on the TRIGA Mark II reactor at the Jožef Stefan Institute has been collected and are publicly available at http://trigapulse.ijs.si/. The purpose was to analyse all the pulses that have been performed so far and to make a comparison between the theoretical models (Fuchs-Hansen model and Nordheim-Fuchs model) and performed pulse experiments. Limit values, maximum power, total energy released and full width at half maximum, are compared for theoretical models and experiments.
In Figure 5, the maximum power is represented depending on the square prompt reactivity. The black line shows the theoretical predictions and the blue dots show performed pulse experiments. The grey area shows uncertainty of the theoretical prediction. It was estimated that the uncertainties of the parameters of the theoretical predictions are uncorrelated. Relative uncertainty of effective delayed neutron fraction (β) has been estimated at 9 % [12], of average lifetime of prompt neutrons (l) was estimated at 8 %[12], relative 𝑃𝑃(𝑡𝑡) =
2 ((𝜌𝜌𝛾𝛾 )′ 2+ 2 𝛾𝛾𝛾𝛾𝑃𝑃0)
(
√(𝜌𝜌𝛾𝛾)′ 2+ 2 𝛾𝛾𝛾𝛾 𝑃𝑃0+ 𝜌𝜌 ′
𝛾𝛾 √(𝜌𝜌𝛾𝛾)′ 2+ 2 𝛾𝛾𝛾𝛾 𝑃𝑃0− 𝜌𝜌 ′ 𝛾𝛾 ) 𝑒𝑒−(√(𝜌𝜌 ′ 𝛬𝛬 ) 2 +2𝛾𝛾𝛬𝛬𝑃𝑃0)𝑡𝑡
𝛾𝛾 𝛾𝛾
( 1 +
(
√(𝜌𝜌𝛾𝛾 )′ 2+ 2 𝛾𝛾𝛾𝛾 𝑃𝑃0+ 𝜌𝜌 ′
𝛾𝛾 √(𝜌𝜌𝛾𝛾 )′ 2+ 2 𝛾𝛾𝛾𝛾𝑃𝑃0− 𝜌𝜌 ′ 𝛾𝛾 ) 𝑒𝑒−(√(𝜌𝜌 ′ 𝛬𝛬 ) 2 +2𝛾𝛾𝛬𝛬𝑃𝑃0)𝑡𝑡
)
2 , (6)
𝐸𝐸(𝑡𝑡) = 𝜌𝜌′ 𝛾𝛾 +√(𝜌𝜌 ′ 𝛾𝛾) 2
+ 2 𝛾𝛾𝛾𝛾 𝑃𝑃0
𝛾𝛾 𝛾𝛾
(
1 − 𝑒𝑒−(√(𝜌𝜌
′ 𝛬𝛬 )
2 +2𝛾𝛾𝛬𝛬𝑃𝑃0)𝑡𝑡
)
1 + (
√(𝜌𝜌𝛾𝛾 )′ 2+ 2 𝛾𝛾𝛾𝛾 𝑃𝑃0+ 𝜌𝜌 ′
𝛾𝛾 √(𝜌𝜌𝛾𝛾 )′ 2+ 2 𝛾𝛾𝛾𝛾𝑃𝑃0− 𝜌𝜌
′ 𝛾𝛾 ) 𝑒𝑒−(√(𝜌𝜌 ′ 𝛬𝛬 ) 2 +2𝛾𝛾𝛬𝛬𝑃𝑃0)𝑡𝑡
uncertainty of inserted reactivity (ρ) has been estimated at 5 % [13] and relative uncertainty of effective temperature reactivity coefficient of fuel has been estimated at 50 % [6]. Where is five or more experimental data at a certain reactivity a statistical analysis is made. Statistical analysis indicates maximal (max) and minimal (min) values, average, median and deviation 1σ. It can be seen that experimental data are mostly within estimated uncertainty of theoretical prediction. In the case of experimental data, there is a considerable uncertainty in determining the inserted reactivity and between the various pulses the core composition changes (number and position of fuel elements), which affects the maximum power between the pulse and consequently total released energy and full width at half maximum.
The experimental values of maximum power and total energy released can be divided into two parts because of different number of fuel elements in the core.
A comparison between the theoretical models and the measurements was also made for the total energy released. The total energy released, in the case of
experimental measurements, is determined by an integral of the power curve. It is important to set the proper boundaries for integration to capture only the response of prompt neutrons and omit the delayed neutrons as foreseen in the theoretical models. The boundaries were set in three different ways (see Figure 6). The first method is 1000 pts, where the power curve is integrated 1000 measurements before and after the maximum power value. The second method is the 1 %, where the integration of the power curve is performed from 1 % of maximum power to 1 % of maximum power. The third method is the tangent, where the result is an integral of the power curve between the points determined by the tangents of the power graph on 1/10 of the maximum power value.
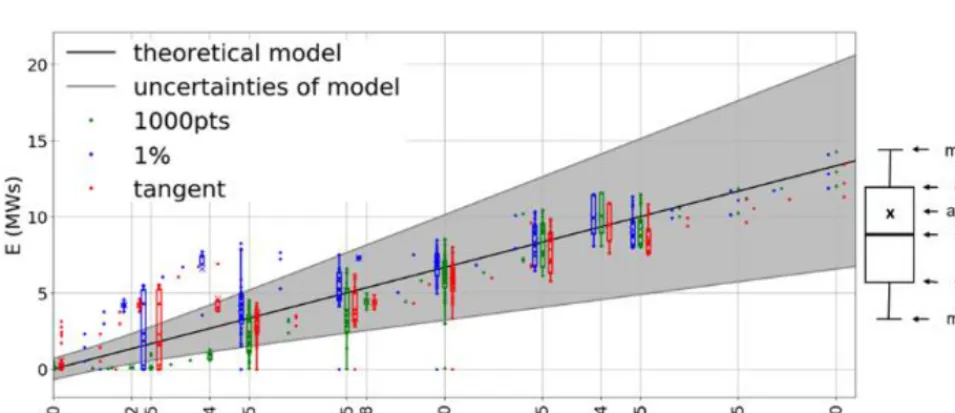
In Figure 7, the results of the experimental data of the total energy released (1000pts green, 1% blue and
tangentred) and the theoretical models (black line) of the total released energy flow in dependence of the inserted reactivity are shown. In case of five or more experimental data at a certain reactivity a statistical analysis is made and with grey area uncertainty of
Figure 5: Comparison of the theoretical models with experimental data for maximum power.
theoretic model is shown. As in the case of maximum power, it can be observed that the experimental values follow the theoretical predictions, but at low inserted reactivities the experimental data are outside of determined uncertainties of theoretical model. It can also be observed that all three modes of determination of total energy released are in good agreement among themselves, especially in the case of large inserted reactivity.
The comparison of theoretical models and experiments for full width at half maximum is presented in Figure 8. As in case of maximum power the black line shows the theoretical predictions and the blue dots show performed pulse experiments. The grey area shows uncertainty of the theoretical prediction. Where is five or more experimental data at a certain reactivity a
statistical analysis is made. It can be noted that the match between theoretical predictions and experimental data is rather poor. Many experimental data are outside the estimated uncertainty of the theoretical models. The worst are data at low inserted reactivities, which was expected. The reason for bad matching is the high uncertainty in determining the full width of half maximum from the experimental data, which is very high especially at low inserted reactivities.
CONCLUSION
Purpose of utilisation was to collect all data from pulse experiments in order to support pulse experimental campaigns where pulse operation can be used for experimental validation of reactor transient modelling. Also, to achieve MTR relevant testing conditions at the
Figure 7: The comparison of the theoretical models with the experimental data for total energy released with three different integration models.
JSI TRIGA Mark II reactor a pulse mode operation is used where can be achieved 1GW for approximately 5 ms - 10 ms. The pulse mode is a well-characterized and representative radiation field which will be used to support future experimental campaigns, where nuclear instrumentation and data acquisition systems for fast transient measurements will be tested. All experimental data of pulse experiments are publicly available at
http://trigapulse.ijs.si/. A comparison of measured pulse physical parameters (maximal power, total released energy and full width at half maximum) was made with theoretical predictions from the Fuchs-Hansen and the Nordheim-Fuchs models.
It was shown that the experimental data of maximum power and total energy released are mostly within the estimated uncertainty of the theoretical model. They differ most at low inserted reactivities, where background noise is disturbing at determination of experimental data, and theoretical models can only be applied at higher reactivities. At full width at half maximum the deviations are greater due to the greater uncertainty in determining values from the experimental data.
REFERENCES
[1] Goričanec, T., et al., Evaluation of neutron flux and
fission rate distributions inside the JSI TRIGA Mark II reactor using multiple in-core fission chambers, Ann. Nucl. Energy, 111 (2018) 407-440.
[2] Štancar, Ž., et al., Computational validation of the
fission rate distribution experimental benchmark at the JSI TRIGA Mark II research reactor using the Monte Carlo method, Ann. Nucl. Energy, 112 (2018) 94-108.
[3] Radulović, V., et al., Measurements of miniature
ionization chamber currents in the JSI TRIGA Mark II reactor demonstrate the importance of the delayed contribution to the photon field in nuclear
reactors. Nucl. Instrum. Meth. A, 804(2015) 149-154.
[4] Ambrožič, K., et. al., Delayed gamma
determination at the JSI TRIGA reactor by synchronous measurements with fission and ionization chambers. Nucl. Instrum. Meth. A, 911(2018) 94-103.
[5] Žerovnik, G., et al., Validation of the neutron and gamma fields in the JSI TRIGA reactor using in-core fission and ionization chambers, Appl. Radiat. Isot. 96(2015) 27-35.
[6] Pregl, Varnostno poročilo za reaktor TRIGA Mark
II v Podgorici, Revision 7, IJS-DP-10675, Ljubljana, March 2017.
[7] Ž. Štancar, L. Snoj, L. Barbot, Reaction Rate
Distribution Experiments at the Slovenian JSI TRIGA Mark II Research Reactor, TRIGA-FUND-RESR-002, International Handbook of Evaluated Reactor Physics Benchmark Experiments. Paris: NEA/NSC/DOC(2006)1, OECD NEA, 2017.
[8] L. Snoj, A. Trkov, October 2012. Temperaturni koeficient reaktivnosti. Ljubljana.
[9] A. Trkov, L. Snoj, M. Ravnik, 2.10.2013. Reaktorska in radiacijska fizika, študijsko gradivo. Ljubljana.
[10]G. I. Bell, S. Glasstone, 1970. Nuclear Reactor Theory. New York, p. 517.
[11]D. L. Hetrick, Dynamics of Nuclear Reactors, American Nuclear Society, Illinois, 1993.
[12]Filliatre, Experimental assessment of the kinetic parameters of the JSI TRIGA reactor, Annals of Nuclear Energy, pages 236-245, September 2015.
![Figure 1: Side view of the TRIGA Mark II reactor. [7]](https://thumb-us.123doks.com/thumbv2/123dok_us/8120946.1353174/2.625.118.476.385.647/figure-view-triga-mark-ii-reactor.webp)