Available Online at www.ijcsmc.com
International Journal of Computer Science and Mobile Computing
A Monthly Journal of Computer Science and Information Technology
ISSN 2320–088X
IMPACT FACTOR: 6.017
IJCSMC, Vol. 6, Issue. 12, December 2017, pg.128 – 141
CrimeWatch: Crime Density
Indicator Mobile Map Application
using Apriori Algorithm
Anna Liza A. Ramos
1, Sean David A. Israel
2, James Vincent M. Bautista
3,
John Francis L. Gumogda
4, Jimwell A. Recto
5, Leonard John Paul T. Sular
61 2 3 4 5 6Institute of Computer Studies, Saint Michael’s College of Laguna, Philippines
; [email protected]; 3[email protected]
; 4 [email protected]; 5[email protected]
Abstract—Crime is one of the global issue that law enforcers needs to monitor, implement laws and policies
towards the development of a solutions for the public safety. With the advancement of technology, crime reports are now accessible and can be seen visually through the use of mobile phone to purposely increase public awareness and will serve as guide for the community to make an effective decision making. This study aim to develop a crime map application that will serve as a platform of information for the law enforcers and for the community to strategically address issues and concerns relative to crime. A systematic investigation is conducted, 408 residents participated the survey from the 17 barangays of Binan, Laguna, Philippine, V-Model approach is applied to ensure that all components of the requirements are reviewed accordingly. The ISO9126 is used to evaluate the application in terms of its functionality, usability, portability, reliability, and efficiency which marked an evaluation result of 3.92 ―very satisfactory‖
Keywords— Crime, crime map, crime density
I. INTRODUCTION
Crime is a result from a violation to any law [2] which existed since hate and anger were introduced to mankind [43] as a result to uncontrollable emotions because of misinterpretations and misunderstandings. It was a self-defense mechanism [62] that later turned to a concern to public safety [29]. It is an unpredictable activity happening in any places [24]. In fact, crime is a global issue increasing day by day [8] which is a result from different causes like gangs, 82%; irresponsible parenthood, 80%; poverty, 74%; unemployment, 74%; unstable judicial system, 69%; drug addiction and alcoholism, 67%; influences of bad peers, 63%; and increased availability of guns, 55%; [54]. Thus, crimes must be controlled through the enforcement of the law to protect the public's security.
used by most police authorities as these allow easy messaging, web browsing, and picture and video taking, being an effective tool used both by the police authorities and the public [33]. This, it is an effective tool for crime monitoring and dissemination [23]. In fact, as of 2016, there are an approximately 22,495,029 Filipinos mobile users proving its capabilities as a way in information dissemination [7]. To further monitor crime activities, crime maps are developed [32]. Crime maps show visuals of the density of crime occurring onto places in a certain area [51]. Through the introduction of the internet, the traditional paper pin-point maps are integrated to provide a more comprehensive view of crime in its environment [28] aiming to easily reach the public [31]. Thus, crime maps are considered as one of the significant tools in crime [1]. These solutions aim to help in developing effective strategies and tactics, improving safety, and informing the public for awareness [39].
Through the introduction of such technology, the data collected grows faster [22]. For it to be analysed and to further understand and address other concerns raised by crime, data mining [30] and information management [55] are introduced making them as important weapons in law enforcement. In mining data collected, the classic and well-known Apriori Algorithm is utilized [62][48] for its proven effectiveness used in different fields like in business [27], education [4], tourism [12], transportation [56], health [60][20][38], and security [41][34].
PROJECT CONTEXT
For the past years to date, level of crime has raised immeasurably worldwide [26] that continuously endangers the security of the public. In 2014, from the data gathered by World Data Atlas [61], Philippines ranked 8th out of 166 countries in the world with a total of nine-thousand seven-hundred ninety-seven (9,797) crimes (index and non-index). And in 2016, the United Nations Office on Drugs and Crime (UNDOC) [58] reported an increasing trend of crime rate (mostly murder, rape, theft, robbery and kidnapping) in the Philippines since 2009. The Philippines is a developing country with problems being faced and are being solved until now [50] ever since the declaration of Martial Law in 1972 [16].
From the statistics gathered by the Philippine National Police (PNP) on 2015, it has showed that CALABARZON (Region 4) has the highest crime volume recorded on crimes against person. National Capital Region (NCR) got the highest volume of crimes against property and followed by Central Visayas, and CALABARZON [21]. In the crime statistics report of PNP Region 4A (CALABARZON) in 2013, Laguna has a total of one-thousand fifty-nine (1,059) index crimes which are mostly crimes committed against a person (murder, homicide, physical injury and rape) [47]. According to www.numbeo.com, as of late December 2016 and early January 2017, crime rates in Laguna are significantly high [17]. Furthermore, Laguna ranks first with the most against-person crimes (114 reports) and second in against-property crimes (99 reports) as of the latest statistical report of PNP CALABARZON in May 2016 [45].
Based on the 2016 records of PNP Biñan, the barangays in Biñan City were arranged from highest to lowest according to their crime volume. The three (3) barangays with the highest record of crimes are Mamplasan, Soro-soro and Malaban; with the average record of crimes are Malamig, San Antonio and Canlalay; and with the lowest record of crimes are Ganado, Platero and Biñan. Furthermore, as of January 2017, Biñan City has a total of ninety-four (94) crimes against persons, twenty-eight (28) of it is Murder, and seventy-three (73) crimes against property.
Over the years, PNP stayed traditional [46] but their way of monitoring to crimes became insufficient. To properly meet its mission and vision to serve and protect the country and enforce the law, upgrading their crime enforcement fitted to the current era would be an advantage towards the attainment of a safer place to live, work, invest and do business through new technologies.
As security is concerned, it has a major problem in information dissemination that hinders its function because of its lack of efficient communication platform between the police authorities and the public [36]. But since the rise of smartphones, it simplifies communications by securely, efficiently, instantly and directly giving the information to the users [35]. Smartphones have been in use to access information even while on the move [10] proving its effectiveness.
STATEMENT OF THE PROBLEM
A. General Problem
The researchers found out that there is no existing mobile application that informs the public about the crime incidents in Biñan City.
B. Specific Problems
1)Difficulty in crime information dissemination: Through an interview conducted with PO2 Maestro of PNP Biñan, there is a difficulty in disseminating crime information on barangays due to limited count of police officers. They assign police officers to engage into dialogues per barangay, and to send out posters, flyers and brochures to inform and spread news to the public. According to the survey conducted to four-hundred eight (408) respondents from 24 barangays in Biñan City, seventy-seven (77) of them have never received any crime news from their barangay, hundred twenty-nine (129) received news rarely from their barangay, and one-hundred thirty seven (137) sometimes received news from their barangay. When the respondents were asked where they get information about crimes, majority answered news either from television and/or internet with two-hundred sixty-six (266), and second is gossips and telltale with two-hundred fifteen (215). The sources of information by the respondents are either national broadcast or unreliable source. Amongst the respondents, one-hundred twenty-two (122) get their news from barangay halls and police stations. Furthermore, two-hundred sixty-four (264) see the importance of being informed with crime incidents in their barangay. Limited source of information lessens the use of reported crime data and developed crime density map. It is mostly because of the fast development the city, faster than the police department being able to expand. If the police department has not developed to meet that progress, it could result and fall into a shortage [57]. Furthermore, reports received by the community, which is indirect from the police officers, are not validated, giving a higher probability of false news [13].
2)Time-consuming in processing crime reports to monitor crime dense area: Through the interview conducted, the researchers asked on how a crime statistics is generated, PO2 Maestro said that the Technical Operation Center generates paper-based report monthly through manual recording and filing of reports which usually take time. With regards to the monitoring, the current ratio, according to the PNP Biñan, is 1 police:2,700 civilians, which makes monitoring harder. Despite the force multipliers (city marshals & barangay tanods), the ratio is still far from the standard ratio.
RESEARCH OBJECTIVES
A. General Objective
To develop a mobile android application that will provide information about crime occurrences in Biñan City.
B. Specific Objectives
1)To design an online crime map application. The application allows the police staff and community users to view the necessary details of the crime such as the incident details, crime type, location, and number of persons involved (victim/s & offender/s). Also, the users can view the statistics of the crime occurrence per barangay and per crime type. And to validate that there is a need to develop the application, the researchers conducted a survey to three-hundred eighty-three (383) residents in Biñan which resulted that majority of them agreed to the development of a mobile android application that would provide information about crime.
2)To design an application that could process crime reports to monitor crime dense areas. The application allows the admin and the police officers to create and submit crime reports directly to their mobile phone that will automatically generate crime reports that will provide the police officers and community users to view the crime hotspots means density of crime reports in a barangay which provide the users to identify and classify the barangay with the level of crime occurrence: a) Level 4 is RED which means that the public is recommended to be highly cautious at all times due to the severity of crime incidents; (b) Level 3 is ORANGE which means that the public is advised to be cautious due to the moderate occurrence of crime incidents; (c) Level 2 is YELLOW which means that the public must be careful due to the moderately low risk of crime incidents; and (d) Level 1 is GREEN which means that the public is considered safe with a low risk to any crime incidents.
SCOPE AND LIMITATION
A. Scope
The study focused on crime density map in Biñan City. The application includes the following features:
1)Crime Density Map Module: This module showed the crime map of Biñan City, Laguna where areas are colored in accordance to the crime density upon each: (a) Level 4 is RED which means that the public is recommended to be highly cautious at all times due to the severity of crime incidents; (b) Level 3 is ORANGE which means that the public is advised to be cautious due to the moderate occurrence of crime incidents; (c) Level 2 is YELLOW which means that the public must be careful due to the moderately low risk of crime incidents; and (d) Level 1 is GREEN which means that the public is considered safe with a low risk to any crime incidents;
2)Crime Statistics Module: This module showed the generated crime statistic from the crime reports in the application divided into two tabs, per barangay and per crime type; and
3)Crime Reports Module: This module allows to create and submit crime reports that contains required fields such as the (a) Location. It identifies the place where the crime occurred. It is the most required field in the crime report; (b) Date and Time. It identifies when the crime specifically occurred. This is automatically encrypted once the crime report is submitted; (c) Age. It identifies the age range of the suspect/s and/or victim/s; (d) Gender. It identifies the sex of the suspect/s and/or victim/s; and (e) Number of Suspect/s and Victim/s. It identifies the number of the suspect/s involved and/or victim/s affected.
B. Limitations
The application cannot predict crime incidents.
Not all data and information are included in this application, such as the physical attributes of the victim/s and/or suspect/s, for confidentiality purposes.
The application does not include blotter reports.
The application can run efficiently in Google Chrome, and Microsoft Edge.
SIGNIFICANCE OF THE STUDY
Police Officers. The study will be beneficial to the police officers to help them in monitoring crime-dense areas that will serve as determinant to implement and create solutions and policies.
Community. The study will greatly benefit to make better decision making and to increase awareness of any criminal activities within their area.
City Government. The study will improve their services to the public.
Researchers. The study will serve as evidence of their technical skills as Computer Science students.
Future Researchers. The study will be used as reference for the future researchers to improve the study.
II. METHODOLOGY
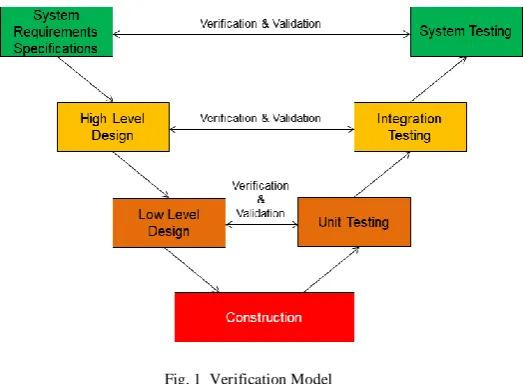
The researchers applied the concept of V-model to ensure the accuracy of every stages in the development of the application process [52].
Fig. 1 Verification Model
related research work. The planning mainly focused on the identification of requirements that need to be analysed and reviewed before the development starts and most importantly what strategies and techniques to address current situation.
2)High-Level Design (HLD). In this phase, the flow of the application has been thoroughly studied through interpretation of diagrams that will help the process owner understand the objectives in a visual presentation. These diagrams are then presented and evaluated based on the agreed requirements expected in the application.
3)Low-Level Design (LLD). In this phase, the researchers applied the object oriented design principles with regarding to the coding activity
4)Construction. The researchers identified available tools to build and execute the application.
5)Testing. The researchers conducted a series of test. (a) Unit Testing. The researchers installed the application to different mobile phones to check and test if there are compatibility issues with the minimum version to the maximum version; (b) Integration Testing. The researchers integrates each modules together and tests the communication of the internal modules within the application. They installed the compiled application into a mobile phone and tested the connection between modules, and buttons to secure that each are working properly and appropriately; and (c) System Testing. The researchers checked the entire functionality and communication of the application. They run numerous testing, from the buttons to the connection of the database to the application, to eliminate bugs and errors. An expert is sought to help them in debugging the application. Moreover, ISO 9126 is utilized to evaluate the characteristics of the application to ensure that the requirements are being met.
ALGORITHM
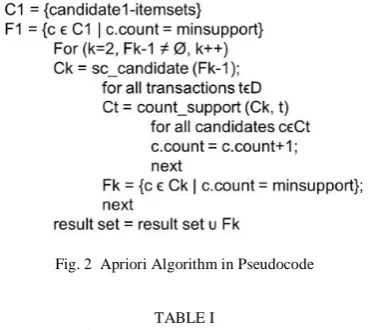
The Apriori Algorithm is a dominant and widely-used algorithm in terms of mining frequent item sets [11]. It identifies the frequent individual items in the database and expanding them into a larger item set provided that those items appear adequately often in the database [5]. The algorithm was applied to the application by getting the specific crime and the number of their occurrence in a specific barangay from the inputted crime reports in the database. A crime will only be frequent if it is equal or more than the minimum support. It will then check the crimes, classify them and associate them according to their barangay.
Fig. 2 Apriori Algorithm in Pseudocode
TABLE I SYMBOLS IN THE PSEUDOCODE C1 candidate1 itemset F1 frequent1 itemset
K itemset
Fk-1 pruning itemset
T transactions
D database
Ct count support
ϵ element
∪ universal
The data are compared then fetches the crime types and pairs those in the same type. After pairing, it analyzes which crime type is frequent. It then produced which barangay has the most crime occurrences.
III.RESULTSANDDISCUSSION
The researchers specified the requirements needed:
TABLE II SYSTEM REQUIREMENTS
WINDOWS DESKTOP OS
Minimum: Windows 7
ver 7601
Maximum Windows 10
ver 1709 LINUX DESKTOP OS Recommended: Fedora Linux
ver 8, Werewolf
ANDROID OS VERSION
Minimum: KitKat
ver 4.4.4
Maximum: Nougat
ver 7.1.2
ANDROID DATABASE Recommended: Realm Database ver 2.1.0 ANDROID
PROGRAMMING SOFTWARE
Recommended Android Studios ver 2.2.1
WEB DATABASE Recommended: Microsoft SQL Server ver 12.0
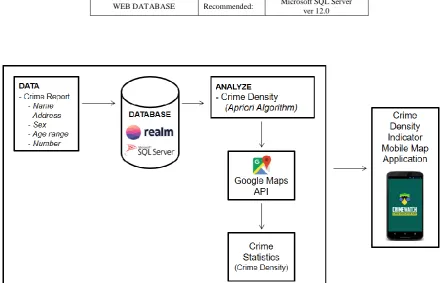
Fig. 3 Conceptual Framework of the Application
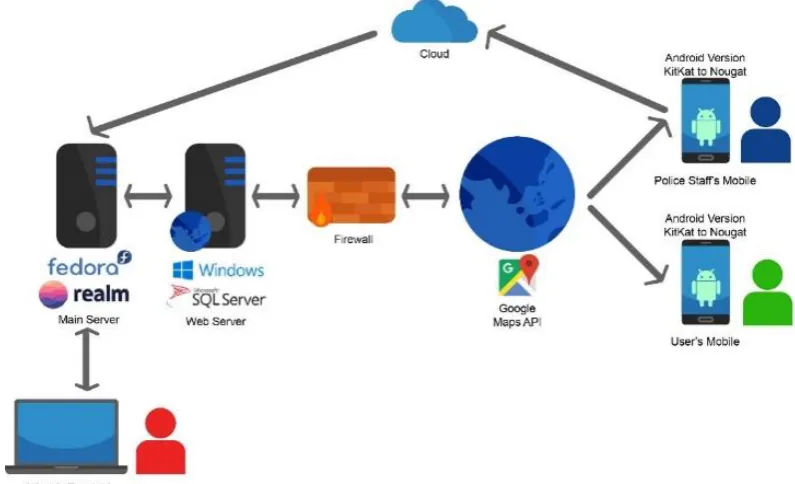
Fig. 4 System Architecture of the Application
Fig. 4 shows the system architecture of the application. The Admin of the application managed the main server Fedora Linux as its operating system and Realm Database which caters the real-time mobile data syncing. The web server received the data from the main server using Windows operating system and Microsoft SQL Server to fetch the data from Realm Database. Web server is connected to the internet and fetched the map through Google Maps API where the users can view the application through android mobile phones specifically from KitKat to Nougat versions only. Also, with regards to processing of reports the authorized users can used both mobile and web application.
Fig. 5 Context Diagram of the Application
Fig. 6 Use Case Diagram of the Application
Fig. 6 shows the activity of the users. All users can log in and log out the application based on their account level before they can view crime map and crime statistics, occurrence and density. In this application, the admin create, view accounts and edit account details. Admin and Police Staff can create crime reports, view reports and edit crime reports.
IV.APPLICATIONINTERFACE Mobile Interface
Fig. 7 Splash Screen
Fig. 7 shows the splash screen of the application which contains the application’s logo and name.
Fig. 8 Crime Density Map Module
Fig. 9 Crime Dashboard Module
Fig. 9 shows the dashboard displaying the crime count of each barangay in Biñan City. The barangays are listed alphabetically displaying each address and contact details.
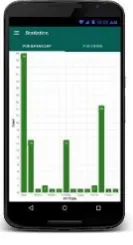
Fig. 10 Crime Statistics Module
Fig. 10 shows the crime statistics of Biñan City per barangay and per crime type generated through submitted reports.
Fig. 11 Add Crime Report Module
Fig. 11 showed the add crime report where the authorized users can submit report. The report forms are as follows: the Crime, Victim, and Suspect Information.
Fig. 12 Crime Reports Module
Fig. 13 Login Module
Fig. 13 shows the login module. The Admin or Police Staff need to login to access the other modules of the application which needs authorization before it will be accessed.
Desktop Web Interface
Fig. 14 Web Login Page
Fig. 14 shows the login page. This is the web counterpart of the application. The admin may and can only log in to access the web-based part of the application.
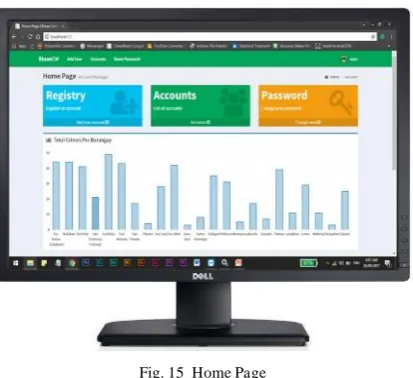
Fig. 15 Home Page
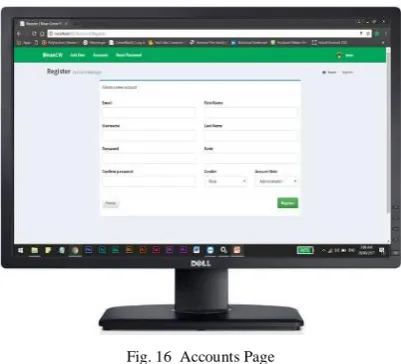
Fig. 16 Accounts Page
Fig. 16 shows the accounts page of the application. There are required input fields, such as the Name, Username, Password and Rank, in order to create or register an account.
Fig. 17 Accounts List Page
Fig. 15 shows the Account List Page. It display the details of each registered account and allows account editing and password resetting.
V. SOFTWAREEVALUATION
TABLE III
SOFTWARE EVALUATION SURVEY RESULTS
All Characteristics Mean Verbal Interpretation Functionality 4.77 WM Very Satisfactory
Reliability 4.70 WM Very Satisfactory
Usability 4.74 WM Very Satisfactory
Efficiency 4.60 WM Very Satisfactory
Portability 4.53 WM Very Satisfactory
Total Weighted Mean: 4.67 WM Very Satisfactory
VI.CONCLUSIONS
The study concluded that the application is very useful to strengthen the dissemination of information relative to crime in the City of Biñan more accessible to the community thus it will greatly contribute the improvement of their services to strategically develop preemptive measures, create action plan and produce accurate and timely reports.
VII. RECOMMENDATIONS
The researchers highly recommend to implement the application to every city in the Philippines to automate crime monitoring systems and crime information dissemination. And for further improvement of the application the following features are recommended:
Create a push notification to alert online and connected users about the latest crime incidents in the city
Add printable crime incident reports
Add the Criminal Wanted List of Biñan City
ACKNOWLEDGEMENT
The researchers would like to thanks the personality who are part of the success of the study. To Ms. Karla Mirazol P. Maranan for sharing her technical expertise, PO2 Abraham Maestro and PO2 Jereli Ignacio of PNP Biñan, SPO2 Alexander Arce of PNP Sta. Rosa, and PO3 Christian Manabat of PNP San Pedro for providing relevant information and orientation, Ms. Relisa Marasigan for checking the grammar of the manuscript, Mark Anthony Anasao, Karl Hendrix Zarate, Jhobert Artista, John Michael Losito, Kelly Leuther Matienzo, and John Michael Casunuran, Mr. Redalf Paldez and Mr. Kenny Fuog for sharing their technical knowledge, Mr. Michael Jessie Theodore A. Sese Mr. Adrian Evanculla, Dr. Renelina Mañabo, Dr. Ma. Regina M.C. Manabat, Mr. Ramon M. Almazan for their relevant insights to make this study relevant and usable.
R
EFERENCES
[1] Ahmadi, M. (2013). Crime Mapping and Spatial Analysis. Enschede, The Netherlands: International Institute For Geo-Information Science And Earth Observation
[2] Ali, K. (2016). Crime. Retrieved from SlideShare website:
www.slideshare.net/gobindnaik/crime-22677466
[3] Alles, I.A. (2014). New Technology of Today. India: Pratap University Jaipur
[4] Angeline, M.D. (2013). Association Rule Generation for Student Performance Analysis using Apriori Algorithm. Thoothukudi, Tamilnadu: Dr. G.U. Pope College of Engineering
[5] Apriori Algorithm (2017). Retrieved from Coursera Inc. website: https://www.coursera.org/learn/data-patterns/lecture/ 6qIY8/ 2-2-the-apriori-algorithm
[6] Azlea, I., Dela Cruz, Y., Roque, P., et al. (2013). Computer of Police Force in Biñan City. Sto. Niño, Biñan City, Laguna: University of Perpetual Help System - JONELTA
[7] Baay, M., et al. (2017). Mobile Applications. Retrieved from I Do Care website: https://www.idc.com/getdoc.jsp? containerId=prAP41533516
[8] Bernales, J.J, et al. (2016). Spatiotemporal Prediction of Crime Occurrence in Cebu City. Cebu City, Philippines: University of the Philippines - Cebu
[9] Brisbane Police Department (2017). Retrieved from Crime Map website: https://crimemap.info/ [10]Callait, C. (2013). On the Move: Information. Sydney, Australia: Federation Press
[11]Chapter 2: Introduction (2011). Retrieved from Shodhganga: A Reservoir of Indian Theses website: http://shodhganga.inflibnet.ac.in/bitstream/10603/23889/7/07_chapter2.pdf
[12]Cheung, D., Ng, V., et al. (2016). Efficient Mining of Association Rules in Distributed Databases.
Singapore: IEEE Transactions on Knowledge and Data Engineering
[13]Christoph, V. (2012). Crime data and its limitations. New York City, New York: Vera Institute of Justice [14]Chukwukere, C.I, et al. (2014). Crime Mapping in Nigeria Using GIS. Benin City, Nigeria: University of
Benin
[15]Crime and Policing in England, Wales and Northern Ireland (2017). Retrieved from Police.UK website: https://www.police.uk/metropolitan/00BK17N/crime/
[16]Crime in the Philippines (2013). Retrieved from World Nomads website: https://www.worldnomads.com/travel-safety/southeast-asia/philippines/crime-in-the-philippines
[17]Crime Rate in Laguna Province, Philippines. Retrieved from Numbeo website: https://www.numbeo.com/crime/in/Philippines
[19]CrimeMappingTM: Helping You a Build a Safer Community (2017). Retrieved from CrimeMappingTM website: http://www.crimemapping.com/
[20]Daping, Z. (2016). Analysis of the Immune System utilizing Association Rules Algorithm. Nanchang, China: Nanchang Hangkong University
[21]Defense, Crime and Delinquency. Journal on Philippine Statistics, Volume 59, Section 7, Pages 89-92. web0.psa.gov.ph/sites/default/files/4thQ2013_0.pdf
[22]Dhanda, M., Guglani, S. & Gupta, G. (2011). Mining Efficient Association Rules through Apriori Algorithm Using Attributes. Singapore: International Journal of Computer Science and Research.
[23]Diplo, D. (2017). Do Phones Help Police Monitor Crime?. Retrieved from WordPress website:
http://upgraid.wordpress.com/
[24]Dr. Elzeiny, A. (2013). Crime and Criminals. Retrieved from Academia.edu website:
www.academia.edu/323859/crime_and_criminals
[25]Ekat, H., et al. (2013). Governance and Management: Introduction to the field of Politics. Manchester, UK: University of Manchester
[26]Erdogan, S., et al. (2011). Spatial Analysis of Five Crime Statistics in Turkey. Retrieved from Fig website: http://www.fig.net/resources/proceedings/fig_proceedings/fig2011/papers/ts04c/ts04c_erdogan_dereli_et _al_5202.pdf
[27]Feng, B., He, X., et al. (2011). Applying Data Mining to the Geosciences Data. Shanghai, China: International Conference on Computer, Mechatronics, Control and Electronic Engineering (CMCE)
[28]Fernandez, M. (2015) Crime Prevention And The Perception Of Safety In Campus Design. Retrieved from
http://etd.lsu.edu/docs/available/etd-03242005-144257/unrestricted/Fernandez_thesis.pdf
[29]Horan, N. (2016). Effects of Crime in Today's Community. Scotland: Scottish Institute of Technology [30]Huebner, R. (2014). A Survey of Educational Data Mining Research. New Jersey, USA: Institute of
Electrical and Electronics Engineers
[31]Johnson, C.P. (2013). Crime Mapping and Analysis Using GIS. Pune, United States of America: Pune University
[32]Katantamalundu, S.D. (2014). Developing A Crime Analysis Information System for a Police Service in a
Developing Country: The Case of Zambia Police Service. Enschede, The Netherlands: International Institute for Geo-Information Science and Earth Observation
[33]Keisler, P.D. (2015). Investigative Uses of Technology: Devices, Tools, and Techniques. Washington, DC., USA: National Institute of Justice
[34]Klimberg R.K., & Taladiar, D. (2013). The Application of Apriori Algorithm in Crime Detection and Analysis. USA: Auerbach Publications
[35]Lastk, I.S. (2013). Channels used in Communication. Alberta, Canada: Red Deer College
[36]Lautn, E. (2012). Communication of Two Poles. New York, USA: Criminal Justice Press
[37]Lexis Nexis: Community Crime Map (2017). Retrieved from Lexis Nexis website: https://communitycrimemap.com/
[38]Lin, L. (2013). Implication of Apriori Algorithm in Heart Disease Detection. Shiyan, China: Yunyang Teachers’ College
[39]Lindh, J.U. (2012). Police Responsibilities in Public Awareness of Crimes. Singapore: Singapore Institute of Technology
[40]Mapping and Analysis for Public Safety (2016). Washington, D.C., United States of America: National Institute of Justice
[41]Mittaya, E. (2012). Introduction of Technology in Crime Analysis through Data Mining Association Rules. USA: Morgan Kaufmann Publishers
[42]Mohammed, J.Z. (2014). Data Mining and Analysis. Troy, New York: Rensselaer Polytechnic Institute [43]Nanda, P. (2013). The Human Being. New Dheli, India: University of Dheli.
[44]NYC Crime Map (2015). Retrieved from NYC Crime Map website: https://maps.nyc.gov/crime/
[45]Philippine National Police (2017). Retrieved from Philippine National Police official website: http://www.pnp.gov.ph/
[46]Philippine National Police: Updates. Retrieved from Inquirer.net website: http://newsinfo.inquirer.net/tag/pnp
[47]PNP CALABARZON Official Report 2013. Retrieved from Philippine National Police CALABARZON (Region 4A) official website: pro4a.pnp.gov.ph/
[48]Ramakrishnan, S. (2014). Fast Algorithms for Mining Association Rules in Large Databases. Santiago, Chile: Proceedings of the International Conference on Large Databases
[49]Rekoso, M. (2014). Police Force in the Province of Laguna: A Case Study. Sto. Tomas, Biñan City, Laguna: University of Perpetual Help System - JONELTA
[51]Saravanakumar, S. & Revathy, S. (2016). Crime Mapping Analysis: A GIS Implementation in Madurai City. Madurai City, Hosur, India: Adhiyamaan College of Engineering
[52]SDLC - V-Model (2017). Retrieved from TutorialsPoint website: https://www.tutorialspoint.com/sdlc/ sdlc_v_model.htm
[53]Simson, C. (2011). Monitoring Crime: Ways to do how. London, England: University of London
[54]Sipes, L., Jr. (2011). Top Ten Factors Contributing to Violent Crime-Updated. Retrieved from Crime in
America website:
http://www.crimeinamerica.net/2011/02/22/top-10-factors-contributing-to-violent-crime/
[55]Soyou, G. (2015). Introduction to Information Systems: New Dimensions of Crime Analysis. Seoul, South
Korea: Seoul National University
[56]Sukhadiya, L., et al. (2017). Modified Apriori Algorithm for Road Accident Analysis. India: Pratap University Jaipur
[57]The Daily Texan (2016). Retrieved from Daily Texas Online website:
http://www.dailytexanonline.com/2016/01/29/
lack-of-police-officers-delays-response-times-forces-more-overtime-shifts
[58]United Nations Office on Drugs and Crimes: Statistics 2016 (2016). Retrieved from United Nations Office
on Drugs and Crimes official website:
https://www.unodc.org/doc/wdr2016/WORLD_DRUG_REPORT_2016_web.pdf
[59]Welcome to CrimeReportsTM (2017). Retrieved from CrimeReports website: https://www.crimereports.com/home/#!/dashboard
[60]Wenjing, Z. & Donglai, M. (2014). Medical Diagnosis Data Mining Based on Improved Apriori Algorithm. College of Information Science & Technology, Baoding, China: Agricultural University of Hebei
[61]World Data Atlas: Crime Rates 2014. Retrieved from Knoema website: https://knoema.com/atlas