The Impact of External Shading Design on the Building
Energy Consumption
Hamid Eskandari 1,*, Mehdi Saedvandi 1 and Mohammadjavad Mahdavinejad 2 1 Department of Architecture, Art University of Isfahan, Isfahan, Iran
2 Faculty of Art and Architecture, Tarbiat Modares University,Tehran, Iran
* Corresponding Author: Hamid Eskandari Email: Eskandari@yu.ac.ir
Abstract
In this paper, the effect of an exterior shading element (Iwan) on energy consumption in four different climatic regions, and for different geographical directions, has been investigated numerically and experimentally. By applying different materials and techniques and creating various elements and spaces, architects make hard climatic conditions more tolerable for residents. Iwan is one of the cooling elements which is used in different forms and dimensions in the Islamic architecture. In the present research, Iwan has been introduced as a climatic element in traditional and contemporary architectures and its role in reducing the energy consumption in buildings has ben studied. In this respect, first, the thermal loads of a building without Iwan are computed by means of EnergyPlus software. Then, four different forms of Iwan are added to the abovementioned structure along the four principal geographical directions, and the effect of Iwan on the reduction of thermal loads is analyzed for four different climates. Finally, the design parameters of Iwan, in terms of depth and form, that can help reduce the thermal loads in different climatic conditions are presented. The results show that the best position for using an Iwan is the south direction and the use of Iwan in temperate & humid, hot & humid, cold & mountainous and hot & dry climates could reduce the energy consumption in buildings by 32%, 26%, 14%, and 29%, respectively.
Keywords: shadings; thermal performance; Iwan; experimental; EnergyPlus
1.Introduction
Buildings in the world require large amounts of energy for cooling and heating, while the cost of electrical energy is continuously increasing [1-5]. The amount of energy required for providing comfortable living conditions inside the buildings in a particular region depends on the weather conditions prevalent in that region [6-13].
An architectural element such as a shading device could be an important tool for reducing the energy consumption of a building, especially in hot climates. In summer, shading can protect the windows from intense solar radiation; while it allows maximum solar radiation in the wintertime. Shading devices have been used in different buildings [14-16]. There are different types of shading devices which improve the energy performance of buildings, such as external shadings [17], internal shadings [18], overhangs [19], venetian blinds [20] and canopies [21].
One of the best energy saving strategies in buildings is the use of passive solar energy in buildings [22]. Iranian traditional architecture has offered appropriate solutions for the optimal use of passive solar energy [23]. These schemes can be found in building elements like Windcatchers [24], Shovadans [25], Courtyards [26] and Domed roofs [27] as well as in spaces like cisterns [28] and ice-pits [29]; most of which have been used for cooling purposes in hot-arid regions [30]. Shading against solar rays plays a significant role in reducing the cooling loads of a building [31, 32]. The thermal performance of a building with a shading model developed for its windows was studied in [33].
external, and overhangs) on the thermal performance of buildings in four different locations in Italy were simulated by TRNSYS software in order to obtain the best shading device for each location [35, 36]. Some studies have shown that for energy-efficient buildings, the effect of external shading on thermal improvement is greater than that of internal shading [37, 38]. The effects of vertical and horizontal shading devices on the quality of daylight in buildings and the associated energy saving were examined by Hussain et al. [39]. Yu Huang et al. [40] analyzed the thermal performance and the daylight quality provided by glazing and shading designs in office building located in dominantly cool climates. They found out that, with the increase of latitude, shading designs on the south windows perform better. The relationship between the use of exterior shading devices and the availability of natural light was investigated by Kim et al. [41]. They suggested that optimal shading systems should increase daylight levels while controlling the amount of excessive sunlight. The feasibility of using external shading for different exposures and at different latitudes was studied by El-Refaie et al. [42]. They concluded that shading devices are required for saving energy and reducing the cooling load of buildings. An experimental investigation of energy distribution and energy efficiency, with regards to the effect of shading on each zone of a solar pond, was presented by Karakilcik et al. [43]. The effects of adjacent shading on the thermal performance of residential buildings in a subtropical region were investigated by Chan [44]. The results showed that the use of shading could practically reduce the cooling load of a building by up to 18.3%.
sunlight into a building during the cool seasons, while allowing the wanted solar radiation gains during the hot seasons [47].
Iwan is a type of external shading device for improving the energy performance of buildings. It has been considered as one of the main shading elements and passive cooling devices in the Middle Eastern and North African architectures. [48]. Its difference from overhangs and balconies is that the thermal effect of Iwan often covers the whole surfaces of walls and openings.
In this research, Iwan is explored as a semi-open space in architecture, and its structural characteristics and specially its various types are investigated for different climatic conditions. Unlike most shading devices for buildings, which are usually used in one direction only (vertically, horizontally, or obliquely), Iwan, as an external shading element, is an integration of vertical and horizontal shading devices. Moreover, contrary to previous studies on the thermal performance of shading devices, which focus more on solar gains through exterior openings, Iwan, in addition to providing shading for exterior openings, can also reduce the absorption of solar radiation through building walls. Although a review of the literature published on the energy performance of buildings indicates the use of several different shading mechanisms to improve the thermal efficiency of buildings, the effect of Iwan on energy efficiency has not been investigated yet.
2.Traditional shading elements (Iwan)
In traditional architecture, shading elements reduce the incident solar rays into buildings. Iwan is one of these traditional shading elements which play an important role in buildings. In a traditional house, Iwan integrates and connects the other spaces of the building. [49]. In terms of form, dimension, and installed location, Iwans have various functions. Many spaces could be located around an Iwan . In many houses remaining from the Safavid and Qajar periods, Iwans are used as the main elements in one or more views (Fig. 1).
Fig. 1. Different forms of Iwan. (a) Ali Qapu palace (Isfahan); (b) Ooomiha House (Yazd); (c) Imam Reza Shrine (Mashhad); (d) Amiriye Mansion (Bushehr)
Southern Iwans (facing the sun) are used in both the hot and the cold seasons of the year. With respect to skewed sunlight, southern Iwans reduce the penetration of solar rays into interior spaces [47, 50]. In terms of climatic conditions, Iwans are divided into four categories (Table 1). The characteristics of the four different climatic regions have been listed in Table 2.
Table 1. Comparing Iwan application at different climates
Climate Climatic explanation of Iwan Iwan figure
Cold and Mountainous
climate
Shading during summer & increasing house beauty preventing direct sunlight into rooms at summer and preventing rainfall and snow at winter.
Hot and Dry climate
Because of special climatic conditions, semi-open spaces are common in these climates and used half of the year protect spaces from sunlight and create air flow simultaneously.
Temperate and Humid climate
Hot and Humid climate
For more use of sea breezes and support natural ventilation, as temporary seasonal living space particularly in night preventing direct sunlight into space at summer.
Table 2. Classification of climates of four different regions
Site: Location Yazd - IRN Bandar Abass - IRN Tabriz - IRN Sari - IRN
Latitude {N 31° 52'} {N 27° 7'} {N 38° 2'} {N 36° 33'}
Longitude {E 54° 16'} {E 56° 13'} {E 46° 10'} {E 53° 0'}
Elevation (m)
above sea level 1237 10 1361 23
Standard Pressure at
Elevation
87321 Pa 101207 Pa 86008 Pa 101600 pa
WMO Station 408210 408750 407060 407590
Maximum Dry Bulb Temperature
(oC)
42.3 43.6 37.0 32.5
Maximum Dry
Bulb Occurs on Aug 16 May 30 Jul 14 Jul 19
Minimum Dry Bulb Temperature
(oC)
-7.0 5.7 -15.0 3.2
Minimum Dry
Bulb Occurs on Jan 3 Dec 29 Jan 25 Feb12
Maximum Dew Point Temperature
(oC)
Minimum Dew Point Temperature
(oC)
-17.0 -17.0 -25.0 -20.0
Köppen
Classification BWh BSh BSk Csa
ASHRAE
Climate Zone 2B 1A 4B 4A
ASHRAE
Description Hot-Dry Very Hot-Humid Mixed-Dry Mixed-Humid
3.Material and building details
Fig. 2. The building geometry and materials
Table 3. The basic information for building geometry
Parameter Building Model
Total building floor area [m2] 16 m2 (4m ×4m)
Window area (% floor area) 12.5% (% floor area) Window area (window to wall ratio) 16.6
Window size 2 m × 1 m
Occupancy density: zone floor area per person [m2/person] 0.06
Activity Light manual work
Metabolic rate per person(W/Person) 180
Clothing(clo) 0.75
Infiltration rate (ach) 0.6
Fresh Air (I/S-person) 10
Table 4. The thermal characteristics of wall
Table 5. The thermal characteristics of window
Conductivity {W/m-K} Front Side Solar
Reflectance at Normal Incidence Solar Transmittance at Normal Incidence Thickness {m} Properties Construction Window 0.9 0.22 0.63 0.012 U=3.122 SHGC=0.762 TSOL=0.705 TVIS=0.812 Clear .3cm, Outside
Layer
Air .6cm, Layer 2
Clear .3cm, Layer 3 Iwan
connected windows
4.Governing equations and the solution method
This study has been performed by using the EnergyPlus (v. 8) software [51], developed by the U.S. department of energy; which simulates the whole energy utilization of a building. Fig. 3 shows the energy balance between the exterior and interior of a building wall.
Thickness {m} Gross
Area [m2]
U-Factor no Film [W/m2-K] U-Factor with Film [W/m2-K] Reflectance Construction Wall 0.264 12.00 0.483 0.450 0.08 Layer 1: 2.4cm Stucco,
Outside
Layer 2: 3cm Wall Insulation 40,
Layer 3: 20cm Concrete H,
Layer 4: 1cm Gypsum, Indoor Iwan
Fig 3. Inside and outside the energy balance control volume
The energy balance equations for zone air and surface heat transfer are two essential equations that an energy program should solve. The energy balance equation for room air is written as:
== −
+
N
i
extraction other
i c
i A Q Q
q
1
, 0 (1)
where
=N
i i c
i A
q
1
, is convective heat transfer from enclosure surfaces to room air, qi,c is
convective flux from surface i, N is the number of enclosure surfaces, Ai is the area of surface
i, Qother is the heat gains from lights, people, appliances, infiltration, etc., and Qextraction is the
Figure 2. A similar energy balance is performed for each window. The surface energy balance equation can be written as:
=
+
=
+
Nk ik ic
ir
i
q
q
q
q
1 '' '' '' '' , (2)where qi'' is the conductive heat flux from surface i and qir'' is the radiative heat flux from
internal heat sources and solar radiation. The radiative heat flux is:
)
(
, '' k i r ikik
h
T
T
q
=
−
(3)Where hik.r is the coefficient of linearized radiative heat transfer between surfaces i and k,
i
Tis the temperature of interior surface i and Tk is the temperature of interior surface k.
)
(
''
,c c i room
i
h
T
T
q
=
−
(4)c
h is the convective heat transfer coefficient and Troom is the room air temperature. The
heat balance on the outside face is:
'' '' '' '' cond conv LWR
sol
q
q
q
q
+
+
=
(5)''
sol
qα is the absorbed direct/diffuse solar radiation (short wavelength) heat flux and it is
calculated using the procedures presented elsewhere for both the direct and diffuse incident solar radiation absorbed by a surface. The amount of solar radiation absorbed by a surface is influenced by location, surface tilt angle, use of shading surfaces, surface material properties, weather conditions, etc. A baffle blocks all shortwave radiation from reaching an underlying
surface. ''
LWR
q is the net long wavelength (thermal) radiation heat flux exchanged with the
surrounding air, qconv'' is the convective heat flux exchanged with the outside air and ''
cond
q is
surfaces of a building, the ground surface under the building, and the sky. The total long wave radiative heat flux is the sum of components due to radiation exchange with the ground, sky, and air.
'' '' '' '' air sky ground
LWR
q
q
q
q
=
+
+
(6)Applying the Stefan-Boltzmann Law to each component yields:
)
(
)
(
)
(
, , , '' surf air air r surf sky sky r surf ground ground rLWR
h
T
T
h
T
T
h
T
T
q
=
−
+
−
+
−
(8)Where ground surf ground surf ground ground r T T T T F h − − = ( ) 4 4 , εσ (9) sky surf sky surf sky sky r T T T T F h − − = ( ) 4 4 , β εσ (10) air surf air surf sky air r T T T T F h − − −
= (1 )( )
4 4 , β εσ (11)
The longwave view factors to ground and sky are calculated with the following expressions[46]: ) cos 1 ( 5 .
0 −
φ
= ground F (12) ) cos 1 ( 5 .
0 + φ
= sky F (13) ) cos 1 ( 5 . 0 φ
β = + (14)
) (
,ext surf air
c
conv h A T T
Q = − (15)
conv
Q is a rate of exterior convective heat transfer, hc,ext is an exterior convection coefficient,
A is a surface area , Tsurf Surface temperature and Tairis an outdoor air temperature. These
equations are solved by Finite Difference methods.
5.Result and discussions
Fig. 4. Schematic of experimental testing
Table 6. The comparison of the experimental results and simulation model
Climate Minimum Temperature (C) Maximum Temperature (C) Light Meter (Lux)
Experimental Numerical Experimental Numerical Experimental Numerical
Hot and dry
- 6.6 -7 41.5 42.3 2050 2192
- 3.1 -2.8 38 37.1 1378 1450
5.1. Simulation results
with its low and high temperatures being +18 ºC and +24 ºC, respectively. Based on this, the software program analyzes the cooling and heating loads of the building. At first, the abovementioned building is simulated without an Iwan, for the four major climates mentioned. For this purpose, the weather information of the following four regions is used: hot & dry climate (City of Yazd), hot & humid climate (City of Bandar Abbas), temperate & humid climate (City of Sari), and cold & mountainous climate (City of Tabriz).
Fig. 5. Thermal load of zones without Iwan (in 4 major directions and 4 major climates)
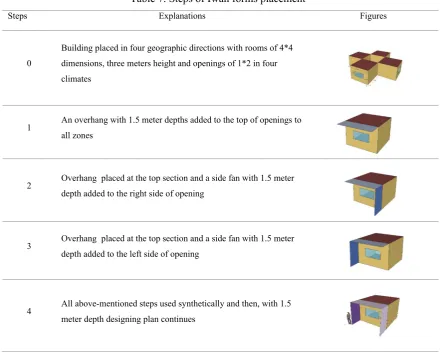
Table 7. Steps of Iwan forms placement
Steps Explanations Figures
0
Building placed in four geographic directions with rooms of 4*4 dimensions, three meters height and openings of 1*2 in four climates
1 An overhang with 1.5 meter depths added to the top of openings to all zones
2 Overhang placed at the top section and a side fan with 1.5 meter depth added to the right side of opening
3 Overhang placed at the top section and a side fan with 1.5 meter depth added to the left side of opening
4 All above-mentioned steps used synthetically and then, with 1.5 meter depth designing plan continues
above cases of Iwan have been modeled for four different climates, and the results for the cooling and heating loads of the building have been illustrated in the following diagrams (Fig. 6 and Table 8).
(b)
(d)
Fig.6. Thermal loads of Iwan’s various steps form in major climates (a) Hot and Humid (Bandar Abbas); (b) Temperate and Humid (Sari); (c) Cold and Mountainous (Tabriz); (d) Hot and Dry (Yazd )
Table 3. Thermal load analysis after Iwan insertion
Hot & dry Cold &
mountainous Hot & humid
Temperate & humid Climate S W E N S W E N S W E N S W E N Zones Direction * * * *
Max decrease rate of cooling load
* *
* *
Min decrease rate of cooling load
* *
* *
Max increase rate of heating load
* *
* *
Min increase rate of heating load
611 114
1125 470
Regarding the above diagram (Table 8, Fig. 6), we can see that after applying an Iwan, the heating loads increase and the cooling loads diminish. Therefore, it can be said that in this case an Iwan acts as a cooler for the building and, consequently, it decreases the cooling load and increases the heating load in all climatic conditions. Another point is that for all climates, the maximum reduction of cooling load occurs on the south side of the building, and that Iwan Form S4 is the best form among all Iwan forms, because the reduction of building’s thermal load is achieved by using this form. The results did not change much by using Iwan Forms S2 and S3, and the maximum change in the results occurred by using Iwan Form S1. Therefore, we can say that the key element in the design of an Iwan is its roof, because it can result in a tangible reduction of temperature. An ideal direction in which an Iwan can be used is the front that provides a maximum rate of thermal load (cooling and heating) before using an Iwan and a max rate of thermal load reduction after applying an Iwan. According to diagrams and calculations, the south side of a building is the ideal front to use an Iwan in all climates.
5.2.Studying the southern zone
Fig. 6. Thermal loads of southern zone based on the Iwan depth
Generally, we can say that the best depth for Iwans, in all climates, is 1.5 m. Table 9 shows the thermal performances of various Iwans with respect to their depth.
Table 4. General analysis of thermal performance in different depth of Iwan in buildings
Climates Iwan depth (southern)
0.5 m 1 m 1.5 m 2 m 2.5 m 3 m
Hot and dry climate
Hot and humid
climate
Temperate and
humid climate
Cold and mountainous
climate
= Excellent
= Good
= Medium
= Weak
6.Conclusion
design of Iwan is the overhang. By using overhangs, the annual thermal load of a building in hot & humid, cold & mountainous, temperate & humid, and dry & hot climates is reduced by 18, 14, 28 and 24%, respectively. A maximum reduction of thermal and cooling loads is achieved by applying an Iwan over the south side of a building. Therefore, the ideal geographical direction for using an Iwan is the south front, and the best climate is the hot & humid climate, followed by temperate & humid, hot & dry, and finally cold & mountainous climates. Experimental and numerical results show that, from the perspective of energy efficiency and the reduction of a building’s thermal load, using Iwans (especially with depths larger than 1 m) in a cold & mountainous climate is not economical. The best depth for Iwans on the south side is 1.5 m; and by using a 1.5 m deep Iwan in the south direction, a thermal load reduction of 32, 26, 29 and 14% is generally achieved in temperate & humid, hot & humid, dry & hot and cold & mountainous climates, respectively. The conclusions of this research paper are summarized as follows:
1. The best possible geographical position for using an Iwan is the south direction. 2. The most optimal Iwan depth is 1.5 m.
3. The best Iwan form is S1.
4. By using an Iwan in the south direction, the energy consumption of buildings in temperate & humid, hot & humid, dry & hot, and cold & mountainous climatic regions is reduced by 32, 26, 29 and 14%, respectively.
7.References
[1] Liddament MW. A review of ventilation and the quality of ventilation air. Indoor Air 2000; 10:193–9. [2] Mahmoud AS, Asif M, Hassanain MA, Babsail MO, Sanni-Anibire MO. Energy and Economic Evaluation of Green Roofs for Residential Buildings in Hot-Humid Climates. Buildings. 2017 Mar 29;7(2):30.
[3] Luis PL, José O, Christine P. A review on buildings energy consumption information. Energy and Buildings 2008; 40(3):394–398.
Comparison Approach. Buildings. 2017 Feb 22;7(1):16.
[5]Ayca K, Basak KK, Ioannis C, Sevil S. Review of simulation modeling for shading devices in buildings. Renewable and Sustainable Energy Reviews 2016; 53:23–49.
[6] Anand S, Gupta A, Tyagi SK. Simulation studies of refrigeration cycles: a review. Renewable and Sustainable Energy Reviews 2013; 17:260–77.
[7]Richard HB, Nasarullah CH, Abdul GS. A review of sustainable cooling technologies in buildings. Renewable and Sustainable Energy Reviews 2011; 15:3112–20.
[8] Cellura M, Ciulla G, Guarino F, Longo S. Redesign of a Rural Building in a Heritage Site in Italy: Towards the Net Zero Energy Target. Buildings. 2017 Jul 28;7(3):68.
[9] Paoletti G, Pascual Pascuas R, Pernetti R, Lollini R. Nearly Zero Energy Buildings: An Overview of the Main Construction Features across Europe. Buildings. 2017 May 31;7(2):43.
[10] Alrashed F, Asif M, Burek S. The Role of Vernacular Construction Techniques and Materials for Developing Zero-Energy Homes in Various Desert Climates. Buildings. 2017 Feb 27;7(1):17.
[11] Yu J, Yang C, Tian L, & Liao D. Evaluation on energy and thermal performance for residential envelopes in hot summer and cold winter zone of China. Applied Energy 2009; 86:2520–2529.
[12] Yao J. Energy optimization of building design for different housing units in apartment buildings. Applied Energy 2012; 94:330–337.
[13] Susorova I, Tabibzadeh M, Rahman A, Clack H, & Elnimeiri M. The effect of geometry factors on fenestration energy performance and energy savings in office buildings. Energy and Building 2013; 57:6–13. [14] Kirimtat A, Koyunbaba B, Chatxikonstantinou I, & Sariyildiz S. Review of simulation modeling for shading devices in buildings. Renewable and Sustainable Energy Reviews 2016; 53:23–49.
[15] Mateus T, Oliveira AC. Energy and economic analysis of an integrated solar absorption cooling and heating system in different building types and climates. Applied Energy 2009; 86:949–57.
[16] Baniyounes AM, Gang L, Rasul MG, Khan MMK. Analysis of solar desiccant cooling system for an institutional building in subtropical Queensland, Australia. Renewable and Sustainable Energy Reviews 2012; 16:6423–31.
[17] Tzempelikos A, Athienitis AK. The impact of shading design and control on building cooling and lighting demand. 2007; International Conference Passive and Low Energy Cooling for the Built Environment. [18] Florides GA, Kalogirou SA. Modeling of the modern houses of Cyprus and energy consumption analysis. Energy 2000; 25:915–37.
[19] Lee ES, Tavil A. Energy and visual comfort performance of electrochromic windows with overhangs. Building and Environment 2007; 42: 2439-2449.
[20] Hans A, Binder B. Experimental and numerical determination of the total solar energy ransmittance of glazing with venetian blinds hading. Building and Environment 2008; 43:197– 204.
[21] Kenneth I, Marta L, Andrew M. Shading performance of a vertical deciduous climbing plant canopy. Building and Environment 2010; 45:81–88.
[22] Ralegaonkar RV, Gupta R. Review of intelligent building construction: A passive solar architecture approach. Renewable and Sustainable Energy Reviews 2010; 14:2238-42.
[23] Khalili M, Amindeldar S. Traditional Solutions in Low Energy Buildings of Hot-Arid Regions of Iran. Sustainable Cities and Society 2014; 13:171-181.
[24] Saadatian O, Haw LC, Sopian K, Sulaiman M. Review of windcatcher technologies. Renewable and Sustainable Energy Reviews 2012; 16:1477-95.
[25] Moradi H, Eskandari H. An experimental and numerical investigation of Shovadan heating and cooling operation. Renewable Energy 2012; 48:364-8.
[27] Faghih AK, Bahadori MN. Thermal performance evaluation of domed roofs. Energy and Buildings 2011;43:1254-63.
[28] Ameri Siahoui H, Dehghani A, Razavi M, Khani M. Investigation of thermal stratification in cisterns using analytical and Artificial Neural Networks methods. Energy Conversion and Management 2011;52:505-11.
[29] Bahadori MN. Natural production, storage, and utilization of ice in deep ponds for summer air conditioning. Solar energy 1985; 34:143-9.
[30] Bahadori MN. Passive cooling systems in Iranian architecture. Scientific American 1978; 238:144-50. [31] Khoroshiltseva M, Slanzi D, Poli I. A Pareto-based multi-objective optimization algorithm to design energy-efficient shading devices. Applied Energy 2016; In Press.
[32] Tzempelikos A, Andreas KA. The impact of shading design and control on building cooling and lighting demand. Solar Energy 2007; 81:369-382.
[33] Datta G. Effect of fixed horizontal louver shading devices on thermal perfomance of building by TRNSYS simulation. Renewable Energy 2001;23:497–507.
[34] Mehrotra M. Solar control devices; balance between thermal performance and daylight; International Conference Passive and Low Energy Cooling for the Built Environment 2005; 991–96.
[35] TRNSYS, A transient simulation program, version 14.2. Solar Energy Laboratory, University Of Wisconsin, USA, 1992.
[36] Introduction to TRNSYS for Windows with IISiBat, Solar Energy Laboratory, University Of Wisconsin: USA; 1997.
[37] Kolaitis D, Malliotakis E, Kontogeorgos D, Mandilaras I, Katsourinis D & Dimitrios I. Comparative assessment of internal and external thermalinsulation systems for energy efficient retrofitting of residential buildings. Energy and Buildings 2013; 64:123–131.
[38] Aste N. Adhikari R. & Manfren M. Cost optimal analysis of heat pumptechnology adoption in residential reference buildings. Renewable Energy 2013; 60:615–624.
[39] Stamatakis A, Mandalaki M, Tsoutsos T. Multi-criteria analysis for PV integrated in shading devices for Mediterranean region. Energy and Buildings 2016; 117:128–137.
[40] Huang Yu, Niu J, Chung T. Comprehensive analysis on thermal and daylighting performance of glazing and shading designs on office building envelope in cooling-dominant climates. Applied Energy 2014; 134:215–228.
[41] Kim G., Lim HS, Lim TS, Shaefer L & Kim TJ. Comparative advantage of an exterior shading device in
thermal performance for residential buildings. Energy and buildings 2012; 46:105-111.
[42] Frontini F. & Kuhn TE. The influence of various internal blinds on thermal comfort: A new
method for calculating the mean radiant temperature in office spaces. Energy and Buildings 2012; 54:527-533.
[43] EL-Refaie MF and EL-Asfourit AS. Feasibility of external shading of fenestration on different exposures. Energy Conversion and Management 1988; 21:161-169.
[44] Chan ALS. Effect of adjacent shading on the thermal performance of residential buildings in a subtropical region. Applied Energy 2012; 92:516–522.
[45] Tzempelikos A, Bessoudo M, Athienitis AK, Zmeureanu R. Indoor thermal environmental conditions near glazed facades with shading devices – Part II: Thermal comfort simulation and impact of glazing and shading properties. Building and Environment 2010; 45:2517-2525.
[46] Bessoudo M, Tzempelikos A, Athienitis AK, Zmeureanu R. Indoor thermal environmental conditions near glazed facades with shading devices e Part I: Experiments and building thermal model. Building and Environment 2010; 45:2506-2516.
[48] Platzer WJ. Evaluation of overheating protection with sun-shading. Solar energy 2001; 69:59–74. [49] Mahmoudi M. Review the importance of iwan in traditional houses (with special attention to the bam). Fine Arts Journal 2005;22-32.
[50] Memariyan GH. Introduction to house typology in Iran: Courtyard houses.Tehran: University of Science and Technology Publications;1994.