ESTIMATION OF LONG-TERM CONCRETE STRENGTH
IN MASSIVE SHIELDING WALL SUBJECTED TO GRADIENT ELEVATED
TEMPERATURE IN BWR TYPE NUCLEAR POWER PLANT
Yoshitaka Ichihara1, Toshinobu Maenaka2, Kaoru Inaba3 and Hideo Kasami4
1 Engineer, Power Facilities, Engineering Department, Takenaka Corporation, Japan 2 Manager, Power Facilities, Engineering Department, Takenaka Corporation, Japan 3 Chief Researcher, Research & Development Institute, Takenaka Corporation, Japan
4 Technical adviser, Japan Association for Building Research Promotion, Japan and Invited professor,
Quindao Technological University, China
ABSTRACT
This paper presented a new system to estimate concrete strength in massive walls subjected to gradient elevated temperature in nuclear power plants. Equations to estimate water distribution in massive wall heated at liner side assuming moisture migration due to pressure, dispersion and evaporation were proposed. Estimation of concrete strength affected by moisture migration were made by substituting moisture content in concrete for strength determined with the correlation between weight loss and residual strength after sustained elevated temperature exposure obtained in the author’s previous experimental results.
Prediction models for concrete strength in shielding wall heated at 65˚C and 90˚C on liner side and cooled at 20˚C on open side were proposed, as well as prediction models of strength and modulus of elasticity based on the experiment using normal portland cement: NP made in 1979 for 1970s' concrete and NP and fly-ash cement: FB made in 2011 for 2010s' concrete. Simulations were made based on analyzed distribution of temperature, pressure and weight loss at 65 ˚C and 90˚C heating for 1 to 60 years. The simulation results indicated that strength was lower at liner side and open side corresponding to moisture loss and that strength was higher in central zone with increased moisture content. For concrete with NP made in 1979, concrete strength heated at 65˚C showed 10 % increase at liner side, 20 % increase at central zone and practically no change at open side after 60 years, as well as those heated at 90˚C showed practically no change at liner side and open side after 60 years. Simulation results with cement made in 2011 showed different tendency at 90˚C heating. NP showed about 8 % strength reduction at liner side. FB remained 5 % strength increase at liner side and open side. Differences in strength distribution between heating temperature of 65˚C and 90˚C, between NP made in 1979 and 2011 and the effects of cement type were evident.
1. INTRODUCTION
In Japan, term of operation of nuclear power plants is regulated by law to be less than 40 years in principle and exceptionally maximum limit is set to be 60 years with permission, as of May, 2013. Thereby, proper progress evaluation on phenomena of aged deterioration will be required.
(a) England et al.’s Simulation Results2) (b) Takeda et al.’s Experimental Results4)
Fig.1 Examples of Moisture Distributions in Past Studies
moisture migration of the concrete as shown in Fig.1(a). T. Takeda et al.4) studied change of moisture
distribution after heating 1500 mm thick middle wall heated at one side, as well as compressive strength and modulus of elasticity. Figure 1(b) shows a result of moisture distribution by T. Takeda et al.4). T.
Shiire et al.5) suggested that strength and modulus of elasticity depend on moisture content in association
with strength and indicated distribution of compressive strength and modulus of elasticity with distribution of moisture content. T. Abe6) and I. Maruyama et al.7), suggested modeling of thermal and
moisture migration accompanied by drying shrinkage at normal temperature. K. Harada8) suggested
modeling of unsteady vapor of water on fire, desorption of physical absorbed water, and thermal dehydration of chemically combined water.
There were many technical papers dealing with the properties of concrete exposed to elevated temperatures, and most of those indicated that rate of degradation was negligibly small at sealed exposure and was comparatively slight even at unsealed exposure below 100˚C. It was also said that degradation of concrete subjected to sustained elevated temperatures could be represented by those of sealed concrete. However, technical papers dealing with concrete strength in massive wall were still limited. Therefore, it was necessary to obtain further information on the degradation of concrete in massive wall heated at liner side. The authors presented a brief summary on preliminary simulations on moisture distribution and strength distributions affected by type of cement and aggregate, based on the method suggested by England and Ross and based on the author's previous experimental results9). This paper presents a part of
results of an extended research which has been investigated by the authors.
The principal purposes of this paper were to establish new systems to estimate strength degradation of concrete in massive shielding wall subjected to gradient elevated temperatures, to establish equations for estimation of moisture distribution and to determine the correlation between moisture content and strength affected by cement type and possible change in cement qualities in accordance with construction years of nuclear power plants.
2. ESTIMATION OF CHANGE IN WEIGHT LOSS DISTRIBUTION AND OTHERS
(1) Outline
The authors calculated weight loss in concrete with general Darcy’s law based on England’s study and determined aged degradation of members subjected to gradient elevated temperature with experimental results of weight loss and compressive strength9). Therefore this paper proposes the
prediction models developed from the following two points.
(2) Establishment of Estimation Method of Weight Loss
Modeling of multi phase flow by one-dimensional flow of air: a, vapor: v, water: w, in concrete is shown in following equations with generated Darcy’s law:
Ev x P K x t m w w w w w − ∂ ∂ ∂ ∂ − = ∂ ∂ η ρ (1) Ev x P K x t m a a a a a + ∂ ∂ ∂ ∂ − = ∂ ∂ η
ρ (2)
∂ ∂ + + ∂ ∂ ∂ ∂ − = ∂ ∂ x h D Ev x P K x t m v a a a v v η ρ (3)
Where, m : mass per unit volume, ρ: density, K : permeability, η:viscosity, P : potential, suffix w : liquid water, suffix a : wet air, Ev : evaporation flux of liquid water, h : humidity, Dv : coefficient of water vapor
diffusion, x : position coordinate, t : time
Equation of energy balance was as follows:
(
)
(
)
Evx T x E u x E u x t U a a w
w λ −ι
∂ ∂ ∂ ∂ − ∂ ∂ + ∂ ∂ = ∂ ∂ (4)
Where, U : inner energy per unit volume, u : flux, E : enthalpy, λ: thermal conductivity, T : temperature,
ι : latent heat of water.
Assuming following conditions, equation (1)-(4) should be solved as a set of simultaneous equations using water saturation: Sw, potential: Pa, relative humidity: h, temperature: T as variables.
① Influence of hydration or dehydration in concrete is negligibly small. ② Evaporation flux is expressed as follows.
(
e e)
Ev=κ SAT − (5)
κ: coefficient, eSAT : saturated vapor pressure, e : vapor pressure.
Reviewing past studies, in this case κ was set to be 2.5×10⁻⁷ kg/m3/Pa.
③Sw + Sa = 1Sa : Saturation of wet air. ④ Liquid water is incompressible. ⑤ Air and vapor are ideal gas is.
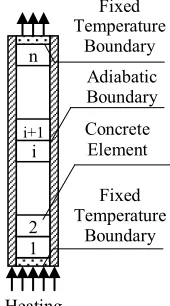
Although it is possible to solve equations (1)-(4) by numeric method implicitly, considering the strong influence of non-linearity, distribution of weight loss is calculated explicitly according to steps shown in Fig.2. Analysis model is described in Fig.3, and it was calculated with 0.01m of element breakdown
under analysis conditions shown in table 1.
In this study diffusion of vapor and thermal migration
are neglected because they have relatively small influence. Also, Evaporation from heating side
is restricted by steel liner.
Fig.2 Calculation Flow of Moisture Migration Fig. 3 Analysis Model
Heating Adiabatic Boundary Concrete Element 1 2 i n Fixed Temperature Boundary i+1 Fixed Temperature Boundary
Distribution of T, Pa, Sw, h at Time t
Calc. Thermal Flow (T) Calc. Evaporation Flow (ρv, Pa)
Calc. Water Flow (Sw, Pa)
Calc. Air Flow (ρv, Pa)
Distribution of T, Pa, Sw, ρv at t+Δt
Table 1 Analysis Conditions Analysis Case Member Length (m)10) Temperature at Heating Side
(˚C)
Temperature at Open Side
(˚C)
Absolute Permeability
(m2) 11)
Thermal Conductivity
(W/m K) 12)
Specific Heat (J/kgK) 12) A
1.8 65 20 1×10-17 1.62 879
B 90
(3) Estimation Results of Weight Loss and Others
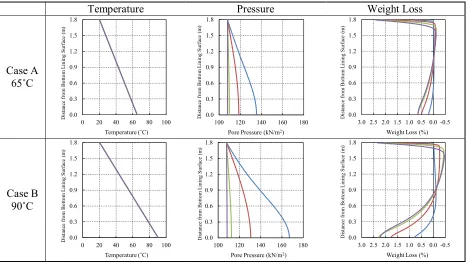
Temperature distribution and pressure distribution are calculated according to the calculation flow shown in Fig. 2. And moisture distribution, in term of weight loss due to moisture migration, is calculated according to the calculation flow with explicit method substituting the temperature distribution and pressure distribution calculated above. Estimated distributions of temperature, pressure and weight loss are shown in Fig. 4.
Conformity of calculated weight loss distribution in Fig.4 was verified in comparison with the simulation results by England et al. and experimental results by T. Takeda et al. shown in Fig.1. In fig. 1, moisture migration from heating side toward open side was found to be in good agreement with Fig.4, although Takeda’s experimental results showed moisture reduction in the zone 0.8 to 1.2m inside from heating side, which Takeda suggested effects of moisture loss consumed in delayed cement hydration.
Hence the estimated moisture distribution without effects of cement hydration in prediction models has been verified. As shown in Fig. 4 higher pressure was found for higher heating temperature, which decreases with elapse of exposure term. When heated at 65˚C, progress of weight loss was smaller than open side, indicating no change inside wall. When heated at 90˚C, weight loss progressed rapidly both liner and open side with 2.5% or more. Remarkable change was found inside wall. In the zone from wall center to open side, moisture increase, in term of weight increase, progress gradually indicating 0.5% weight increase. Figure 4 suggested that at higher heating temperature concrete was dried at heating side and open side and was wetted inside wall.
Temperature Pressure Weight Loss
Case A 65˚C 0.0 0.3 0.6 0.9 1.2 1.5 1.8
0 20 40 60 80 100
D is ta nc e fr om B ot tom L ini ng S ur fa ce ( m ) Temperature (˚C) 0.0 0.3 0.6 0.9 1.2 1.5 1.8
100 120 140 160 180
D is ta nc e fr om B ot tom L ini ng S ur fa ce ( m )
Pore Pressure (kN/m2)
0.0 0.3 0.6 0.9 1.2 1.5 1.8 -0.5 0.0 0.5 1.0 1.5 2.0 2.5 3.0 D is ta nc e fr om B ot tom L ini ng S ur fa ce ( m )
Weight Loss (%)
Case B 90˚C 0.0 0.3 0.6 0.9 1.2 1.5 1.8
0 20 40 60 80 100
D is ta nc e fr om B ot tom L ini ng S ur fa ce ( m ) Temperature (˚C) 0.0 0.3 0.6 0.9 1.2 1.5 1.8
100 120 140 160 180
D is ta nc e fr om B ot tom L ini ng S ur fa ce ( m )
Pore Pressure (kN/m2)
0.0 0.3 0.6 0.9 1.2 1.5 1.8 -0.5 0.0 0.5 1.0 1.5 2.0 2.5 3.0 D is ta nc e fr om B ot tom L ini ng S ur fa ce ( m )
Weight Loss (%)
3. ESTIMATION OF CHANGES IN STRENGTH DISTRIBUTOIN AND OTHERS (1) Outline of Estimation Method
Distribution of structural properties, such as, compressive, tensile and bond strengths and modulus of elasticity were calculated according to the steps below.
①Establishing prediction models based on the author’s previous experimental results ②Substituting estimated weight losses into prediction models
③Estimating distributions of structural properties
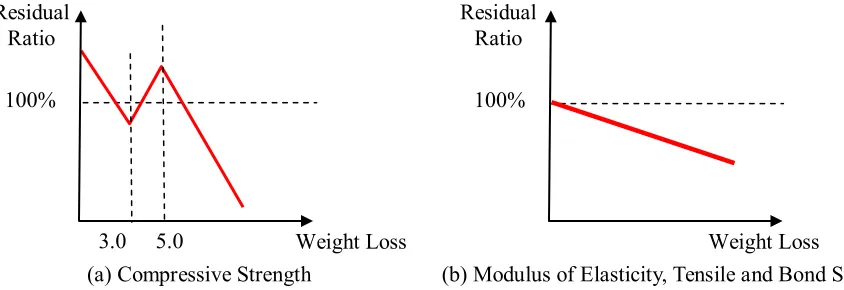
(2) Modeling of Correlation between Weight Loss and Compressive Strength and Others
In order to establish prediction models, schematic diagrams of correlation between weight loss and structural properties are shown in Fig.5 Value of residual ratio (standard of a value of structural property before heated at aged 91 days) at the area where water increases and weight loss showed under 0% was assumed by the results of specimen under a seal condition which was considered as a value at the time when weight loss was 0% in the model of compressive strength because the experimental results were still few. In this way, model of compressive strength was considered as a tendency to be the
minimum when weight loss was 3% and to be the maximum when weight loss was 5%13)
(a) Compressive Strength (b) Modulus of Elasticity, Tensile and Bond Strengths
Fig. 5 Schematic Diagrams of Correlations between Weight Loss and Compressive Strength and Others
(3)Estimated Strength Distribution Based on the Experiment in 1979
Correlations between weight loss and structural properties were determined based on the author’s previous experiments carried out in 1979 and 2011. Weight loss was defined as percentage of weight loss after exposure to the weight loss at the time of leaving off moisture curing, such as 28 day water curing on 91 day sealed curing. Residual structural properties, such as compressive, tensile and bond strengths and modulus of elasticity were expressed by the percentage of those after age of 91 days. Bond strength was measured on maximum bond to round bars.
In this section, distribution of structural properties to simulate aged nuclear power plants built in 1970s’ are estimated by substituting compressive, tensile and bond strengths and modulus of elasticity correlated with weight loss based after 10, 100 and 1000 days exposure. Correlations used for substitution are shown in Fig.6. Estimated distributions of structural properties are shown in Fig.7.
Distributions of structural properties showed lower residual ratio at heating side and open side where concrete is dried and show higher residual ratio inner zone where concrete were wetted.
When heated at 65˚C, in case A, compressive strength increased at heating side and inner zone, except open side where concrete was dried but kept residual ratio 100%, while those of modulus of elasticity, tensile and bond strengths did not show increment and 2 to 4 % reductions at heating side and 7 to 15% reduction at open side.
100% Residual
Ratio
3.0 5.0 Weight Loss
100% Residual
Ratio
When heated at 90˚C, distributions curve became steeper. Distributions of compressive strength indicate no degradation for 60years, and kept 15% increase in wetted zone inside wall. However those of modulus of elasticity showed 7 to 13% reduction at heating side and open side.
In case of tensile strength distribution shows almost same one of modulus of elasticity because that of correlation between residual ratio and weight loss was similar to modulus of elasticity.
In case of bond strength distribution shows moderately deteriorating when compared with modulus of elasticity and tensile strength because that of correlation between residual ratio and weight loss had more moderate gradient than those of gradients.
Compressive Strength Modulus of Elasticity Tensile Strength Bond Strength
Predict-ion Models 20 30 40 50 60 70 80 90 100 110 120 130
0 2 4 6 8
Re si dua l Ra tio (%)
Weight Loss (%)
20 30 40 50 60 70 80 90 100 110 120 130
0 2 4 6 8
Re si dua l Ra tio (%)
Weight Loss (%)
20 30 40 50 60 70 80 90 100 110 120 130
0 2 4 6 8
Re si dua l Ra tio (%)
Weight Loss (%)
20 30 40 50 60 70 80 90 100 110 120 130
0 2 4 6 8
Re si dua l Ra tio (%)
Weight Loss (%)
Fig.6 Prediction Models Based on Correlation between Weight Loss and Residual Ratio
Compressive Strength Modulus of Elasticity Tensile Strength Bond Strength
Case A 65˚C 0.0 0.3 0.6 0.9 1.2 1.5 1.8
80 90 100 110 120
D is ta nc e from Bot tom L ini ng S urfa ce (m )
Residual Ratio (%)
0.0 0.3 0.6 0.9 1.2 1.5 1.8
80 90 100 110 120
D is ta nc e from Bot tom L ini ng S urfa ce (m ) Residual Ratio(%) 0.0 0.3 0.6 0.9 1.2 1.5 1.8
80 90 100 110 120
D is ta nc e from Bot tom L ini ng S urfa ce (m )
Residual Ratio (%)
0.0 0.3 0.6 0.9 1.2 1.5 1.8
80 90 100 110 120
D is ta nc e from Bot tom L ini ng S urfa ce (m )
Residual Ratio (%)
Case B 90˚C 0.0 0.3 0.6 0.9 1.2 1.5 1.8
80 90 100 110 120
D is ta nc e from Bot tom L ini ng S urfa ce (m )
Residual Ratio (%)
0.0 0.3 0.6 0.9 1.2 1.5 1.8
80 90 100 110 120
D is ta nc e from Bot tom L ini ng S urfa ce (m )
Residual Ratio (%)
0.0 0.3 0.6 0.9 1.2 1.5 1.8
80 90 100 110 120
D is ta nc e from Bot tom L ini ng S urfa ce (m )
Residual Ratio (%)
0.0 0.3 0.6 0.9 1.2 1.5 1.8
80 90 100 110 120
D is ta nc e from Bot tom L ini ng S urfa ce (m )
Residual Ratio (%)
Fig.7 Estimation Results Based on Prediction Models and Estimated Weight Loss for 1 to 60 years Heating Period :1year :10year :30year :60year
(4) Estimated Strength Distribution Based on the Experiment in 2011
In this section, distribution of structural properties to simulate aged nuclear power plants built in 2010s’ were estimated by substituting compressive and modulus of elasticity correlated with weight loss based after 91days exposure. Correlations used for substitution are shown in Fig.8. Estimated distributions of structural properties are shown in Fig.9. Distributions of compressive strength and
NP Cement FB Cement
Compressive Strength Modulus of elasticity Compressive Strength Modulus of elasticity
Predict-ion Models 20 30 40 50 60 70 80 90 100 110 120 130
0 2 4 6 8
Re si dua l Ra tio (%)
Weight Loss (%)
20 30 40 50 60 70 80 90 100 110 120 130
0 2 4 6 8
Re si dua l Ra tio (%)
Weight Loss (%)
20 30 40 50 60 70 80 90 100 110 120 130
0 2 4 6 8
Re si dua l Ra tio (%)
Weight Loss (%)
20 30 40 50 60 70 80 90 100 110 120 130
0 2 4 6 8
Re si dua l Ra tio (%)
Weight Loss (%)
Fig.8 Prediction Models Based on Correlation between Weight Loss and Residual Ratio
NP Cement FB Cement
Compressive Strength Modulus of elasticity Compressive Strength Modulus of elasticity
Case A 65˚C 0.0 0.3 0.6 0.9 1.2 1.5 1.8
80 90 100 110 120
D is ta nc e from Bot tom L ini ng S urfa ce (m )
Residual Ratio (%)
0.0 0.3 0.6 0.9 1.2 1.5 1.8
80 90 100 110 120
D is ta nc e from Bot tom L ini ng S urfa ce (m )
Residual Ratio (%)
0.0 0.3 0.6 0.9 1.2 1.5 1.8
80 90 100 110 120
D is ta nc e from Bot tom L ini
ng S
urfa
ce
(m
)
Residual Ratio (%)
0.0 0.3 0.6 0.9 1.2 1.5 1.8
80 90 100 110 120
D is ta nc e from Bot tom L ini ng S urfa ce (m )
Residual Ratio (%)
Case B 90˚C 0.0 0.3 0.6 0.9 1.2 1.5 1.8
80 90 100 110 120
D is ta nc e from Bot tom L ini ng S urfa ce (m )
Residual Ratio (%)
0.0 0.3 0.6 0.9 1.2 1.5 1.8
80 90 100 110 120
D is ta nc e from Bot tom L ini ng S urfa ce (m )
Residual Ratio (%)
0.0 0.3 0.6 0.9 1.2 1.5 1.8
80 90 100 110 120
D is ta nc e from Bot tom L ini ng S urfa ce (m )
Residual Ratio (%)
0.0 0.3 0.6 0.9 1.2 1.5 1.8
80 90 100 110 120
D is ta nc e from Bot tom L ini ng S urfa ce (m )
Residual Ratio (%)
Fig.9 Estimation Results Based on Prediction Models and Estimated Weight Loss for 1 to 60 years
Experimental Results
:Prediction Model :NP-2011(Un-seal) :NP-2011(Seal) :FB-2011(Un-seal) :FB-2011(Seal)
modulus of elasticity showed lower residual ratio at heating side and open side where concrete was dried and showed higher residual ratio inner zone where concrete was wetted.
When heated at 65˚C, in case A, compressive strength increased at heating side and inner zone, except open side where concrete was dried but kept residual ratio 90%, while those of modulus of elasticity showed reduction and 10 % reduction at open side.
In case of NP when heated at 90˚C, distribution curve became steeper. Distributions of compressive strength indicated, 12% increase in wetted zone inside wall. However those of modulus of elasticity showed 7 to 13% reduction at heating side and open side
In case of FB compressive strength distribution showed greater increment at central zone than NP and no reduction at heating side and open side. Modulus of elasticity was 10% reduction at heating side and open side, with higher residual ratio than NP.
In case of heating temperature at 65˚C and 90˚C between experiment 1979 and 2011 at area where heating temperature was higher, compressive, tensile and bond strengths and modulus of elasticity tended to be smaller. Influence of heating term did not change after 30 years regardless of heating temperature. Also at open side compressive, tensile and bond strengths and modulus of elasticity tended to be similar regardless of heating temperature or term.
In case of comparing with NP made in 1979 and 2011 regardless of heating temperature, compressive strength of NP made in 2011 at heating side and one at open side tended to be smaller. As to modulus of elasticity regardless of cement manufacturing year or heating temperature, at heating and open side both of distributions tended to be similar.
In case of comparing NP and FB made in 2011 regardless of heating temperature, compressive strength of FB at heating and open side was larger than NP. As to modulus of elasticity regardless of heating temperature, FB at heating and open side tends to be larger than ones of NP.
4. DISCUSSIONS
There were still a lot of problems remaining unsolved. Followings are major subjects for future investigations.
1) In this study, porosity, permeability or hydration caused by degradation were not considered, but this was a calculation for moisture migration in porous medium and heat conduction on the assumption that absolute permeability, porosity and non-saturation characteristics did not depend on temperature. 2) As to weight loss inside of concrete, there was partially an occurrence of areas where water increased
than before heating because of moisture migration, but few studies considered these phenomena properly.
3) Moisture distribution inside walls was calculated by general Darcy’s law, but an influence of mixture conditions was not considered, therefore, examining each experimental results conditions of which were changed and accuracy of calculation were required.
4) When structural properties were evaluated with residual ratio, residual ratio of tensile and bond strengths and modulus of elasticity tended to decrease more than one of compressive strength, so further experiment of thermal influence of tensile and bond strengths and modulus of elasticity might be required.
However, the following discussions were drawn from the work presented above on the effects of sustained elevated temperatures on structural properties.
1) Weight loss of concrete subjected to gradient elevated temperature for 60 years decreased 2.4% and 2.3% in maximum respectively at heating side and open side, and increased 0.5% in maximum around 1.5m apart from heating side.
2) Calculated moisture distributions in term of weight loss indicated remarkable difference with heating temperature at liner side. When heated at 90˚C for 60 years, moisture loss at liner side reached and dried area extended from liner side toward center and from open side to 150 mm deep from open side, moisture content increased up to 0.5 %.
3) Compressive strength became lower than that before heating at local areas, but at almost all sections, it became higher than that before heating.
4) As to modulus of elasticity, an area where it got lower than standard values of age 91days ranges a half area apart from heating side, and in some areas, modulus of elasticity decreased over 10% than that before heating.
5) Strengths and modulus of elasticity of concrete subjected to gradient elevated temperature for 60 years would be sound regardless of manufacturing years or types of cement even after heating with
conditions that wall width was 1.8m, and heating temperature was not more than 90˚C, and permeability was K=1.0×10⁻¹⁷ m2, the effects of heating temperature rise were remarkable.
5. CONCLUSIONS
The following preliminary conclusions were obtained as results of present investigations concerning estimation of compressive strength in massive wall subjected to gradient elevated temperatures.
1) New equations to calculate time depending on moisture distributions in term of weight losses were proposed.
2) Moisture distributions calculated by the equations almost agreed with those presented by England and Takeda.
3) Calculated moisture distributions in wall 1800mm thick for 60 years indicated dried zone both at liner side and open side and wetted zone from wall center to open side.
4) Correlation between weight loss and residual ratio determined from the author’s previous experiments were proposed based on the result using cement made in 1979 and in 2011.
5) Distributions of compressive, tensile and bond strengths and modulus of elasticity, calculated substituting residual ratio obtained above mentioned correlation were proposed.
6) Calculated distributions of compressive, tensile and bond strengths and modulus of elasticity indicated lower value at dried zone and higher value at wetted zone.
7) Distributions of compressive strength using NP made in 1979 indicated strength increase by 10 % or more and did not indicate remarkable strength reduction when heated at 65 ˚C and 90 ˚C.
8) Compressive strengths in concrete using NP and FB made in 2011 showed different tendency from those of 1979, indicating between the two cements.
9) Distributions of compressive strength of FB did not show reduced strength zone when heated at 65˚C and 90˚C for 60 years. While NP indicated strength increase when heated at 65 ˚C, but indicated 7 to 13 % strength reduction at liner side when heated at 90 ˚C.
10) It was important to apply experimental results based on old cement, in order to estimate compressive strength in aged nuclear power plant built in old times.
REFERENCES
1) G. L. England, A. D. Ross, (1970), "Shrinkage, Moisture and Pore Pressures in Heated Concrete", ACI SP34-42, USA
2) G. L. England (1971), "Migration of Moisture and Pore Pressures in Heated Concrete", Vol. H2/4, Trans. Int. Conf. SMiRT, 3rd, Vol. H, USA.
3) D. A. Chapman, G. L. England (1977), "Effects of Moisture Migration on Shrinkage, Pore Pressures and other Concrete Properties", Vol. H. Trans. Int. Conf. SMiRT 4th, Vol. H, USA
4) T.Takeda et al. (1987), "Experimental Studies on Characteristics of Concrete Members Subjected to High Temperatures", Vol. H. Trans. of 9th Int. Conf. on St. Mech. in Reactor Technology, USA
5) T. Shiire, S. Cheong (1988), "Experimental study on strength characteristics of massive concrete structures subjected to high temperature from one side” Journal of structural and construction engineering, Transactions of AIJ , 387, 8-14, Japan, (in Japanese)
6) T. Abe (1987.), “Analysis of moisture migration and heat inside of concrete in the dry process”, Hukui national college technology study bulletin, Natural science engineering, No. 21, Japan, (in Japanese) 7) I. Maruyama, T. Noguchi, R. Sato (2006), “Prediction of temperature and moisture distribution in
high-strength mass concrete based on heat and moisture transport model”, Journal of structural and construction engineering, Transactions of AIJ, No.70, vol.600, pp.1-8, Japan, (in Japanese)
8) K. Harada, T. Terai (1995), “A model of heat and mass transfer in concrete during fire”, Journal of structural and construction engineering, Transactions of AIJ, No. 477, pp.185-190, (in Japanese)
9) N.Hikosaka, K.Moriya, T.Tayama, H.Nishi, M.Tamura, H.Kasami (2012), "Degradation of Concrete
Exposed to Sustained Temperatures Affected with Cement and Aggregate", Part 1-6," pp.1309-320, Transaction of Annual Meeting of AIJ, Sept.,, (in Japanese)
10) H. Kasami, H. Nichi, M.Tamura, Y. Ichihara, T. Maenaka (2013), to be presented at 22nd Int. Conf. SMiRT 11) AIJ (2004), “Japan architectural standard specification for reinforced concrete work in nuclear
power plants (JASS 5N)”, AIJ, Japan, (in Japanese)
12) AIJ (2004), “Recommendations for durability design and construction practice of reinforced concrete”, AIJ, Japan, (in Japanese)
13) AIJ (1985), “Symposium, thermal stress design method for nuclear concrete structure”, AIJ, Japan, (in Japanese)
COPYRIGHT TRANSFER AGREEMENT
The below text in italic is for your information and agreement prior to submittal of the paper.
The author(s) warrants that the submitted manuscript is the original work of the author(s) and has never been published in its present form.
The Lead Author, with the consent of all other authors, by submitting the manuscript for publication in SMiRT-22 transactions, hereby transfers copyright interest in the submitted manuscript to IASMiRT subject to the following.
• The Lead Author and all coauthors retain the right to revise, adapt, prepare derivative/ expanded works, present orally, or distribute the work.
• In all instances where the work is prepared as a "work made for hire" for an employer, the employer(s) of the author(s) retain(s) the right to revise, adapt, prepare derivative/expanded works, publish, reprint, reproduce, and distribute the work provided that such use is for the promotion of its business enterprise and does not imply the endorsement of IASMiRT.
• It is recognized that an author who is a U.S. Government employee and who has participated in the submitted work does not own copyright in it.