18th International Conference on Structural Mechanics in Reactor Technology (SMiRT 18) Beijing, China, August 7-12, 2005 China, SMiRT18-S05-7
EXERGY ANALYSIS OF HTGR-GT
Jianhua Cao
Institute of nuclear and new energy
technology, Tsinghua University, Beijing,
100084, China
Phone: +86-10-6279-5454,
Fax: +86-10-6277-1150
E-mail: caojh03@mails.tsinghua.edu.cn
Jie Wang
Institute of nuclear and new energy
technology, Tsinghua University, Beijing,
100084, China
Phone: +86-10-6279-4678,
Fax: +86-10-6277-1150
E-mail: wjinet@mail.tsinghua.edu.cn
Xiaoyong Yang
Institute of nuclear and new energy
technology, Tsinghua University, Beijing,
100084, China
Phone: +86-10-6277-1746,
Fax: +86-10-6277-1150
E-mail: xy-yang@mail.tsinghua.edu.cn
Suyuan Yu
Institute of nuclear and new energy
technology, Tsinghua University, Beijing,
100084, China
Phone: +86-10-6279-5454,
Fax: +86-10-6277-1150
E-mail: suyuan@mail.tsinghua.edu.cn
ABSTRACT
The High Temperature Gas-cooled Reactor (HTGR) coupled with gas turbine for high efficiency in electricity production is supposed to be one of the candidates for the future nuclear power plants. The HTGR gas
turbine cycle is theoretically based on the Brayton cycle with recuperated, intercooled and precooled sub-processes. In this paper, an exergy analysis of the Brayton Cycle on HTGR is presented. The analyses were done for four typical reactor outlet temperatures and the exergy loss distribution and exergy loss ratio of each
sub-process was quantified. The results show that more than a half of the exergy loss takes place in the reactor, while the low pressure compressor (LPC), the high pressure compressor (HPC) and the intercooler denoted by
compress system together, play a much small role in the contribution of exergy losses. With the rise of the reactor outlet temperature, both the exergy loss and exergy loss ratio of the reactor can be greatly cut down, so is the total exergy loss of the cycle; while the exergy loss ratios of the recuperator and precooler have a small rise.
The total exergy efficiency of the cycle is quite high (50% more or less).
Keywords: exergy analysis; high temperature gas-cooled reactor; brayton cycle; exergy loss
1. INTRODUCTION
The Modular High Temperature Gas-cooled Reactor (MHTGR) with inherent safety and good potential of economical characteristics is considered to be one of the candidates for the future nuclear power plant [1]. Very
hopeful types for the Generation IV nuclear power system. The combination of HTGR and the power conversion
unit utilizing gas turbine generator system (HTGR-GT) for high efficiency in electricity production is one of the main focuses in HTGR technology, and further more, it has a simple structure. And the projects of PBMR, GT-MHR and GTHTR300 are all designed to utilize gas turbine generator coupling with HTGR [2]. The 10MW
High Temperature Gas-cooled Test Reactor (HTR-10) was built, in the Institute of Nuclear and new Energy Technology (INET), Tsinghua University, which reached its first criticality in 2000 and begun its full power
operation in 2003[2]. During the 2nd International Topical Meeting on High Temperature Reactor Technology, the safety related experiments were successfully carried out openly to verify its inherent safety features. Now the subsequent project, HTR-10GT is launched to develop further technology on HTGR. In this project, the
feasibility of HTGR gas turbine technology will be demonstrated by a gas turbine generator system coupled with HTR-10 reactor.
In this paper, exergy analysis is used to estimate the exergy loss distribution of the closed direct cycle.
2. BACKGROUND
The second law of thermodynamics states that all irreversible processes generate entropy, or reduce the
input exergy, while increase the output anergy of the process. Exergy analysis (sometimes referred to as availability analysis), which based on the first and second law of thermodynamics, can offer an objective and
quantitative criterion to evaluate these nuclear-to-electricity processes of HTGR-GT [3~10]. The criterion is used for the simultaneous assessment of the internal and external exergy losses and the performance yield of every process. Integrated processes can be optimized with regard to thermodynamic efficiencies through exergy
analysis.
Exergy optimization of multi-operation processes can be difficult because of the interdependent relations
between the efficiencies of individual operations. This is relevant because a thermodynamic improvement in one unit may have negative repercussions in others units. In addition, a local improvement could result into an overall degradation of the process thermodynamic performance [11].
The High Temperature Gas-cooled Reactor (HTGR) and the gas turbine (GT) generator can be practically combined in various schemes, such as closed direct cycle, closed indirect cycle and open indirect cycle. And the
closed direct cycle is supposed to be the most hopeful one as the development in limitation of temperature of materials.
Fig. 1 is the schematic diagram of HTGR gas turbine closed direct cycle. High temperature and high pressure
helium from the reactor core flows into the turbine directly to rotate the turbine by gas expansion. The turbine drives the generator to supply electric power and compressors to increase the helium gas pressure. The turbine
exhaust gas becomes low pressure and low temperature helium after flowing through the recuperator and precooler, and then is compressed by two-stage compressors system with intercooler. This high pressure and low temperature helium is heated in recuperator by the exhaust gas of the turbine with high temperature [12]. Finally
Core
Generator
Turbine
Inter-cooler
Pre-cooler Recuperator HPC
LPC 1
2a
2b 2
3
4
5
6
Figure 1. Closed direct cycle
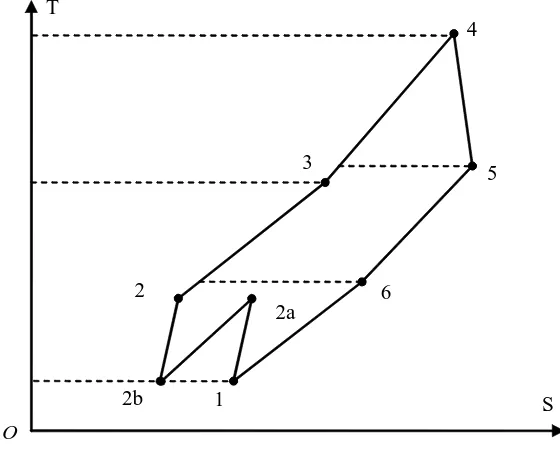
The thermodynamic analysis of HTGR gas turbine cycle is theoretically based on the real
Brayton cycle with recuperator, intercooler and precooler. Its T-S diagram is illustrated in Fig.
2.
2
2a T
S
O
1 2b
3
4
5
6
Figure 2. T-S diagram of Brayton Cycle
3. CALCULATIONS
As shown in Fig. 2, the Brayton cycle has eight sub-processes, and it’s supposed that, the expansion and compression sub-processes are working processes without heat transfer and the other sub-processes are
efficiency is defined as exergy content of what the processes produce purposely (denoted by Ex1) divided by the
exergy content of all input working fluid, heat and work (denoted by Ex2). So the exergy loss of each
sub-process is shown as follow:
1
xli x i x i
E
=
E
−
E
2,i=1,2,
(1)
And exergy loss efficiency can be calculated by Eq. 2.
100%
xlii
Core
E
Q
ε
=
×
(2)
Exergy loss ratio is defined as exergy loss of a sub-process divided by the total exergy loss of the cycle.
100%
xlii
xli
E
d
E
=
×
∑
(2)
In the reactor core, the nuclear power is supposed to be entirely converted to heat, and there is no heat loss during heat transfer. The exergy content produced by the turbine is its internal power. Heat is assumed to be
entirely transferred from helium of the low pressure side to that of the high pressure side of the recuperator driven by temperature difference. As is described in Fig. 1, the heat is rejected to the environment directly in both precooler and intercooler, and only the consumed exergy contents need to be calculated. During the
compressing processes, the helium is compressed to increase its exergy by the compressors. So the power of the compressor is the input exergy content, while the rise of the exergy of the helium is the produced exergy
content.
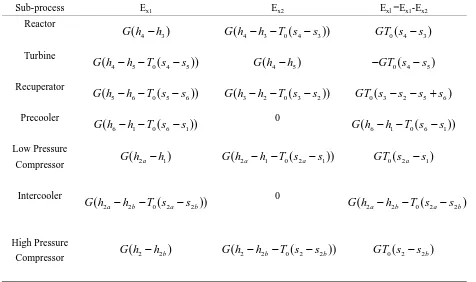
Then Ex1, Ex2 and E xl of each sub-process are calculated as shown in table 1.
Table 1 E
x1and E
x2of each sub-process
Sub-process Ex1 Ex2 Exl =Ex1-Ex2
Reactor
4 3
(
)
G h
−
h
G h
(
4− −
h
3T s
0(
4−
s
3))
GT s
0(
4−
s
3)
Turbine
4 5 0 4 5
(
(
G h
− −
h
T s
−
s
))
G h
(
4−
h
5)
−
GT s
0(
4−
s
5)
Recuperator
5 6 0 5 6
(
(
G h
− −
h
T s
−
s
))
G h
(
3− −
h
2T s
0(
3−
s
2))
GT s
0(
3− − +
s
2s
5s
6)
Precooler
6 1 0 6 1
(
(
G h
− −
h
T s
−
s
))
0G h
(
6− −
h
1T s
0(
6−
s
1))
))
Low Pressure
Compressor
G h
(
2a−
h
1)
G h
(
2a− −
h
1T s
0(
2a−
s
1GT s
0(
2a−
s
1)
Intercooler
2 2 0 2 2
(
a b(
a bG h
−
h
−
T s
−
s
))
0G h
(
2a−
h
2b−
T s
0(
2a−
s
2b)
))
High Pressure
4. RESULTS
According to present status of engineering technology, working conditions of the Brayton Cycle, as a conservative estimation, is given in Table 2.
Table 2 Working conditions of the Brayton Cycle on HTGR
Parameter Signification Value
0
T
(K) Environmental temperature 2980
P
(MPa) Environment pressure 0.11
T
(K) Precooler outlet temperature 3082
P
(MPa) High Pressure Compressor outlet pressure 73
T
(K) Reactor inlet temperature 823α
(%) recuperation effectiveness 95ϕ
Isentropic index of helium 0.401[13]t
η
(%) Isentropic efficiency of turbine 90c
η
(%) Isentropic efficiency of compressor 89ξ
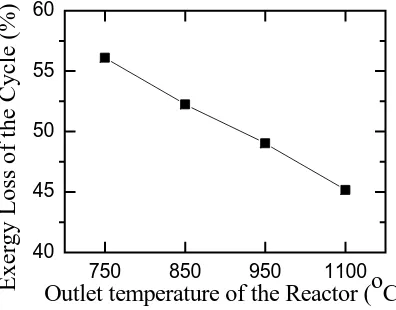
(%) Pressure loss coefficient of the cycle 5The total exergy losses of the brayton cycle varying with the outlet temperature of the reactor are shown in Fig. 3.
750 850 950 1100 40
45 50 55 60
Ex
er
g
y
Lo
ss o
f th
e Cy
cle (
%
)
Outlet temperature of the Reactor (
o
C)
The exergy loss distribution is shown for each sub-process of the cycle, see Fig. 4, given in percent ratio. The paper calculated in four typical conditions mainly different in reactor outlet temperatures.
Reac. Turb. Recu. Prec. LPC Inte. HPC
0
10
20
30
Exe
rgy L
o
ss
ε
i(%)
Sub-Processes
t
4=750
oC
850
oC
950
oC
1100
oC
Figure 4. The exergy loss distribution of the Brayton Cycle
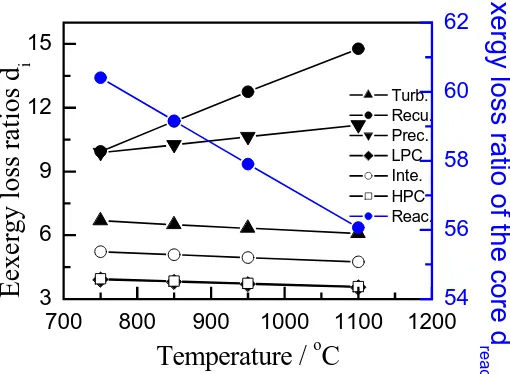
Exergy loss ratios of each sub-process were calculated to find the relationship between the core outlet temperature and relative contribution of exergy loss within the cycle.
700 800 900 1000 1100 1200
3 6 9 12 15 Turb. Recu. Prec. LPC Inte. HPC Reac.
Temperature /
oC
E
e
xe
rgy l
o
ss
ra
ti
o
s d
i 54 56 58 60 62E
x
ergy
los
s
rat
io of
t
h
e c
o
re d
reacFigure 5. Exergy loss ratios of each sup-process
5. DISCUSSION
the reactor, due to the conversion of nuclear energy into heat and the heat transfer between the core and the
coolant by temperature difference. Moreover, the increase in the reactor outlet temperature could not only make a decrease in both exergy loss and exergy loss ratio of the core, but also result into an overall degradation of the
total exergy loss of the cycle, from 56.55% at 750 to 45.16% at 1100 , as shown in Fig. 3. The exergy loss of the reactor sub-process makes the biggest contribution to the reduction of the total exergy loss.
Because of the irreversible expansion of the helium, the exergy loss in the turbine must be taken into account,
though it is less than that in the recuperator and precooler.
With the high recuperation efficiency of 95%, the recuperator, however, contributes the second biggest exergy loss for the cycle, see in Fig 4. It’s caused by the difference of temperature of the two sides in the recuperator.
Without the consideration of the pressure drop of the recuperator, the recuperation efficiency is not high enough concerning to its exergy efficiency. And the exergy loss of this sub-process slightly increases with the rise of the
reactor outlet temperature, while its exergy loss ratio makes the biggest increase.
Although both the precooler and intercooler reject heat to the environment directly without any recovery, the exergy loss of the former is much bigger, mainly due to that the inlet temperature (T6) of precooler is a little
higher than that (T2a) of the intercooler. And what’s more, the exergy loss ratio of the precooler is the other one
which increases with the rise of the reactor outlet temperature except the recuperator.
It is approximately equal between the LPC and HPC in the contribution of exergy loss, both due to irreversible compression. They play such an unimportant role in the contribution the exergy loss of the cycle that even the total exergy loss of the whole intercooled two-compressors set is approximately equal to, if not less than, that in
the sub-process of the recuperator. And the exergy loss ratios of the LPC, HPC and intercooler have an almost the same trend of decreasing with the rise of the reactor outlet temperature.
6. CONCLUSIONS
The exergy analysis on closed Brayton Cycle coupled with HTGR has been presented for four typical reactor outlet temperatures. The results show that, exergy analysis is a useful method to evaluate the thermodynamic
efficiencies and especially good at finding out the weak sub-processes of the system compared with the traditional energy analysis only based on the first law of thermodynamics. It’s indicated that the exergy loss
efficiency of the cycle can be greatly reduced with a higher reactor outlet temperature; the biggest exergy loss takes place in the conversion process of nuclear energy to heat in the reactor. Except the reactor, the recuperator and the precooler play much more important roles in exergy losses than other sub-processes; there is little
potential for reduction of the exergy losses in LPC, intercooler or HPC; the recuperator and precooler are the only two sub-processes that increase, while that of the reactor makes the biggest decrease, with the rise of the
reactor outlet temperature; whatever, the exergy efficiency of the Brayton Cycle on HTGR is quite high (50% more or less).
ACKNOWLEDGEMENT This research was supported by Chinese Nature Science Fund (90410001).
REFERENCES
[1] Z. Y. Zhang, Z. X. Wu, et al. Design of Chinese Modular High-temperature Gas-cooled Reactor HTR-PM.
Proceedings of the 2nd International Topical Meeting on High Temperature Reactor Technology. Beijing, China, 2004
Gas-cooled Reactor. Nuclear Engineering and Design, 2005
[3] M. Sorin, J. Paris. Integrated exergy load distribution method and pinch analysis. Computers and Chemical Engineering, 1999, 23: 497-507
[4] Donghua Yang. exergy analysis and energy level anslysis. Beijing: Science Press, 1986
[5] Zornitza Kirova-Yordanova. Exergy analysis of industrial ammonia synthesis. Energy, 2004, 29: 2373-2384
[6] Dunbar, W. R. et al. Exergy analysis of an operation boiling-water-reactor nuclear power station. Energy Convers, Mgmt, Mar. 1995, 36 (3): 149-159
[7] H. Kreetz, K. Lovegrove. Exergy analysis of an ammonia synthesis reactor in a solar thermodynamical
power system. Solar Energy, 2002, 73(3): 187-194
[8] Minjun Peng. thermodynamic analysis of nuclear power plants. Harbin: Harbin Engineering University
Press, 2003
[9] A.Zvolinschi, S. Kjelstrup, O. Bolland and H. J. van der Kooi. Exergy analysis for the Assessment of the Sustainability of Combined Cycle Power Plants with CO2 Capture. 14’’World Hydrogen Energy
Conference, June, 2002, Montreal, Quebec, Canada
[10] K. J. Ptasinski, C. Hamelinck, P. J. A. M. Kerkhof. Exergy analysis of methanol from the sewage sludge
process. Energy Convers, Mgmt, 2001
[11] Yu Chen. Study on the Recuperator for HTGR Gas Turbine Direct Cycle. Beijing: Institute of nuclear and new energy technology, Tsinghua University, 2004
[12] Zhiyong Huang, Jie Wang, Jinlin Li. Study on the thermodynamic cycle of HTR-10GT. Proceedings of the 2nd International Topical Meeting on High Temperature Reactor Technology, Beijing, China, 2004