Copyright to IJIRCCE DOI: 10.15680/IJIRCCE.2016. 0411215 19870
Scalable Sentiment Classification for Bigdata
Analysis Using Logistic Regression Classifier
Anjuman Prabhat
1, Vikas Khullar
2M. Tech Student, Department of CSE, CT Institute of Engineering Management & Technology, Jalandhar, India1
Assistant Professor, Department of CSE, CT Institute of Engineering Management & Technology, Jalandhar, India2
ABSTRACT: Machine learning technologies are very much popular in text classification study. It can easily learn from training dataset which help companies in decision making with high efficiency. But there are algorithms which do not scale up with increasing volume of data. In this paper, we focused on the scalability of Logistics Regression in large datasets. We have implemented logistics regression on mahout which keeps track of the huge datasets while training process. The performance of logistics regression is enhanced with the increasing amount of data. The accuracy of the classifier reaches 80% when size of dataset increases.
KEYWORDS: Bigdata, Sentiment Classification, Logistics Regression, Term Frequency-Inverse Document Frequency.
I. INTRODUCTION
In this era internet accommodate an enormous amount of lexicon data. The textual data is fast developing frequently since it is easier to produce and report it. Twitter which is one of the most popular micro- blogging websites allows people to express their emotions, opinions and attitudes towards a product. Apart from these online sites allows users to interact, present and mutate the content. This facilitates users to explicit peculiar and personal sentiment about topics related to different domains. Twitter contents are short texts which provide real time data that express ideas and sentiments of different circumstances. Therefore tweets are good source of streaming data for sentiment classification.
Sentiment analysis is the operation of determining whether the sentiment conveyed in a subject or topic is expressed in a positive or negative way. Sentiment analysis is also known as Subjectivity detection or opinion mining. To find linguistic and statistical patterns in the text sentiment analysis uses machine learning methods and natural language processing [15][16]. In recent year’s machine learning technologies and natural language processing is gaining popularity due to its numerous applications and usages. A lot of business organizations use machine learning algorithms to summarize feedback so that they can bring a change in their product. During election campaigns machine learning methods plays a key role in making a decision in different circumstances [17].
Supervised machine learning algorithms generally involves following steps to obtain better accuracy and performance. The steps included are:
(i) Collect a training dataset
(ii) Labeling the dataset
(iii)Feature extraction and selection
(iv)Training on classifier using training dataset
(v) Testing using test dataset
Copyright to IJIRCCE DOI: 10.15680/IJIRCCE.2016. 0411215 19871 system known as Hadoop Distributed File System (HDFS) and a distributed processing system known as Hadoop Mapreduce[9][10]. The primary objective of HDFS is to store data efficiently even in the existence of a breakdown or failure including Namenode failures. Hadoop Mapreduce is a software framework which helps users to build distributed applications so as to process vast amount of data on a cluster of machines in a parallel manner [11][12][13]. We have also used Apache Mahout in our paper. Mahout which is an Apache project is a scalable machine learning library. It allows users to execute machine learning algorithms on Hadoop.
II. RELATED STUDY
A lot of work has been done on sentiment analysis using bag-of-words and rule based method. But very few research works is done on sentiment analysis using machine learning methods. A vast amount of valuable information about different products is available in web. This information can be used by vendors, companies etc to refine in areas they lack and make necessary changes according to it. But the major challenge is that data in web so extensive that to classify these data is a tough job.
Copyright to IJIRCCE DOI: 10.15680/IJIRCCE.2016. 0411215 19872
III. YSTEM DESCRIPTION
A. EXPERIMENTAL SETUP
Hadoop Version Hadoop 2.7.1
Bench Program Naïve Bayes & Logistics Regression
File System Hadoop File System
Operating system Linux Mint 17.2
Processor Intel®Core(TM)i3 CPU
Clustered Node Single Node
RAM 4 GB
System Type 64- bit operating system
Mahout Mahout 0.9
Table 1. Configuration of single Node Machine
B. DATASET
In this research work, we have used real time twitter review. The tweets have been collected from Twitter streaming API using specific keywords which provides low latency access to the user.
IV. METHODOLOGY
To process twitter dataset we have used Hadoop environment using Eclipse IDE. To train dataset logistics regression is used which can easily scale up with increasing amount of data. Logistics regression prepares a model based on given input and based on the model predicts the outcome of test dataset.
A. GENERAL WORKFLOW
(i) Pre-processing: In this step the twitter text are converted into a common format. After preprocessing each review become one line in the dataset with document ID and sentiment prefixed either positive or negative. During preprocessing we deleted unwanted information like numbers, symbols, punctuation and meaningless words. (ii) Constructing Input Datasets: Here input dataset is constructed for all tests trails for the convenience of ten-fold
cross validation. The input dataset is sent to correct location in Hadoop distributed file system for all cases.
(iii) Classification of sentiment using Hadoop: This is the prime step in entire process. Once the training and test
data is available in HDFS, the algorithm starts to build a model for training job. After training process the model is combined with test data to form an intermediate table. At last the organizer calculates the probabilities of each review in two classes subsequently and makes a decision about the sentiment of each review.
(iv) Collection of results: After classification process the results are stored in HDFS.
Training
Dataset
Datset
Training
Task
Model
Test
Dataset
Integrating
Task
Transitional
Table
Segregate
Task
Negative
Positive
Copyright to IJIRCCE DOI: 10.15680/IJIRCCE.2016. 0411215 19873
V. RESULTS AND DISCUSSIONS
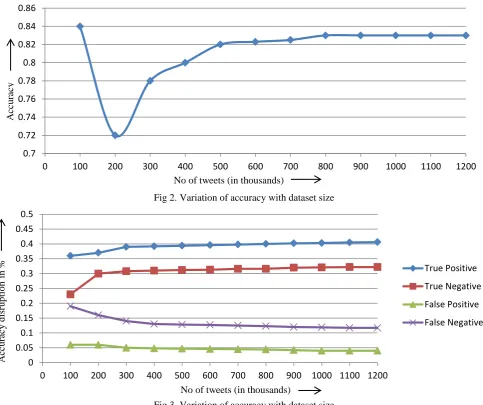
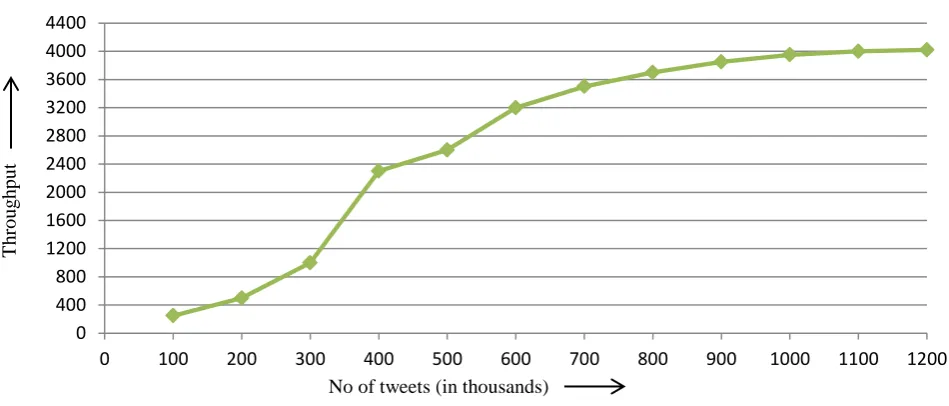
In this set of experiment we discuss the results obtained by using logistics Regression on the basis of parameter like accuarcy, throughput , accuracy disruption and processing time.The performance of the classifier is evaluated on the basis of parameter like accuracy, throughput and computation time. Fig. 2 shows the accuracy of logistics regression classifier on different sizes of datasets. As the dataset size increases the values of accuracy becomes stable. But when the size of dataset is small the accuracy is unstable because the training data is large enough for the training model to learn knowledge about each class. As the size of dataset increases above 500K, the value of accuracy approaches 81% and finally climbs unto 85%. This proved that the average accuracy of logistics regression classifier becomes stable when the size of dataset increases. In fig. 3 we plot the classification accuracy into true positive, true negative followed by false positive and false negative. The experimental result showed that the values of true positive and true negative increases while the value of false positive and false negative decreases with the increase in size of data. Fig. 4 shows throughput of the classifier with the increase in size of dataset.
Fig 2. Variation of accuracy with dataset size
Fig 3. Variation of accuracy with dataset size 0.7
0.72 0.74 0.76 0.78 0.8 0.82 0.84 0.86
0 100 200 300 400 500 600 700 800 900 1000 1100 1200
0 0.05 0.1 0.15 0.2 0.25 0.3 0.35 0.4 0.45 0.5
0 100 200 300 400 500 600 700 800 900 1000 1100 1200
True Positive
True Negative
False Positive
False Negative
A
cc
u
rac
y
A
cc
u
rac
y
d
is
ru
p
tio
n
in
%
No of tweets (in thousands)
Copyright to IJIRCCE DOI: 10.15680/IJIRCCE.2016. 0411215 19874 Fig 4. Variation of throughput with dataset size
Table 1 shows the processing time of logistics regression classifier with the increasing size of dataset. At initial stage when the size of dataset is small enough then Hadoop does not benefit from its parallelization concept because the input data is small than the size of one block in Hadoop distributed file system. Once the size of dataset increases the benefit of Hadoop starts to appear in that the processing time for same amount of data is severely reduced compare to small size of data.
VI. CONCLUSION
In this paper we have implemented logistics regression for sentiment mining on large datasets on Hadoop ecosystem. The experimental results show that logistics regression can easily scale up when the size of dataset increases.
REFERENCES
1. Tripathy, A. Agrawal, S.K Rath, “Classification of sentiment reviews using n-gram machine learning approach”
Journal of Expert Systems With Applications(Springer), Vol. 57, pp. 117-126, 2016.
2. P. Barnaghi, J. breslin, P. Ghaffari, “Opinion Mining and Sentiment polarity on Twitter and Correlation Between
Events and Sentiment”, Journal of second International Conference on Big data Computing Services and Applications(IEEE), pp.52-57, 2016.
3. S. Kulcu, E.Dogdu, “A Scalable Approach for Sentiment Analysis of Turkish Tweets and Linking Tweets To
News”, Journal of Tenth International Conference on Semantic Computing (IEEE), pp.471-476, 2016.
4. M. Bhuvan, V. Rao, S. Jain, R. Guddeti, “Semantic Sentiment Analysis Using Context Specific Grammar”,
International Conference on Computing Communication and Automation (IEEE), pp.28-35, 2015.
5. M. Qasem, R. Thulasiram, P. Thulasiram, “Twitter Sentiment Classification Using Machine Learning Techniques
for Stock Markets”, Journal of International Conference on Advances in Computing, Communications and Informatics (IEEE), pp.834-840, 2015.
6. G. Gautam, D. Yadav, “Sentiment Analysis of Twitter Data Using Machine Learning Approaches and semantic
analysis”, Seventh International Conference on contemporary computing (IEEE), pp. 437-442, 2014.
7. B.liu, E.Blash, Y.chen, G.chen, D.shen, “Scalable Sentiment Classification for Big Data Analysis Using Naïve
Bayes Classifier”, Journal of International Conference on Big Data (IEEE), Oct. 2013.
8. A. Go, R. Bhayani, L. Huang, “Twitter Sentiment Classification using Distant Supervision”, Journal of Cloud
Computing pp.82-90, 2012.
0 400 800 1200 1600 2000 2400 2800 3200 3600 4000 4400
0 100 200 300 400 500 600 700 800 900 1000 1100 1200
No of tweets (in thousands)
T
h
ro
u
g
h
p
u
Copyright to IJIRCCE DOI: 10.15680/IJIRCCE.2016. 0411215 19875
9. J. Dean and S. Ghemawat, “Mapreduce: simplified data processing on large clusters”, In 6th symposium on
operating system design and implementation, Vol- 6, pp.137-149, 2004.
10. S. Goraya, V. Khullar, “Map-Reduce Synchronized and Comparative Queue Capacity Scheduler in Hadoop for
Extensive Data”, Journal of Computer Engineering (IOSR-JCE), Volume 17, Issue 6, Ver. 5, pp. 64-75, Nov-Dec 2015.
11. S. Goraya, V. Khullar, “Enhancing Dynamic Capacity Scheduler for Data Intensive Jobs”, International Journal of
Computer Applications, Volume 121 – No.12, pp. 21-24, July 2015.
12. Q. Zhou, C. Zhang, “Sentiment Classification of Chinese Reviews in Different Domain: A Comparative Study”,
Springer, pp.13-23, 2014.
13. J. Dean and S. Ghemawat, “Mapreduce: Simplified Data Processing On Large Clusters”, Journal of
Communications of the ACM, vol. 51, no. 1, pp. 107–113, 2008.
14. S. Aravindan, A. Ekbal, “Feature Extraction and Opinion Mining in Online Product Reviews”, Journal of
Computer Society (IEEE), pp.94-99, 2014.
15. B. Liu, “Sentiment Analysis and Opinion Mining,” , A Review Article on Synthesis Lectures on Human Language
Technologies, Vol. 5, No-1, pp. 1-167, April- 2012.
16. R. Feldman, “Techniques and Applications for Sentiment Analysis”, Journal of Communications of the ACM, Vol.
56, No-4, pp. 82-89, 2013.
17. T. Hastie, R. Tibshirani, J. Friedman, “The Elements of Statistical Learning (Second Edition Springer), 2009.
18. E. Blasch, Y. Chen, G. Chen, D. Shen, and R. Kohler, “Information fusion in of cloud-enabled environment”,
Journal of High Performance Semantic Cloud Auditing (Springer), 2014.
19. B. Liu, Y. Chen, E. Blasch, K. Pham, D. Shen, and G. Chen, “A holistic cloud-enabled robotics system for
real-time video tracking application,” International Workshop on Enhanced Cloud Fusion, Sept. 2013.
20. J. Li, M. Sun, “Experimental study on sentiment Classification of Chinese Review Using Machine Learning
Techniques”, Journal of computer society (IEEE), pp.393-400, 2007.
21. J. Smailovic, M. Gracana, N. Lavrac, M. Znidarsic, “Stream-Based Active learning for Sentiment Analysis in the
financial domain” Journal of Information Sciences (Elsevier), pp.181-203, 2014.
22. D. Lewis, “Naıve (Bayes) at forty: The independence assumption in information retrieval”, Journal of Machine
Learning, pp. 4–15, 1998.
23. A. Balahur, M. Turchi, “Comparative experiment Using Supervised Learning and machine Translation for
Multilingual Sentiment Analysis”, Journal of Computer speech and Language (Elsevier), pp.56-75, 2014.
24. P. Domingos and M. Pazzani, “On the optimality of the simple Bayesian classifier under zero-one loss, ”Machine
learning, Journal of Transactions on Pattern Analysis and Machine Intelligence(IEEE), vol. 29, No. 2-3, pp.103– 130, 1997.
25. B. Pang, L. Lee, S. Vaithyanathan, “Thumbs up?: Sentiment Classification Using Machine Learning Techniques.”