ISSN(Online): 2320-9801
ISSN (Print): 2320-9798
I
nternational
J
ournal of
I
nnovative
R
esearch in
C
omputer
and
C
ommunication
E
ngineering
(An ISO 3297: 2007 Certified Organization)
Vol. 4, Issue 10, October 2016
Link Efficient Multi-hop Protocol in WBANs
Preeti Gupta1, Dr. Raghav Yadav2
M.Tech Scholar, Dept. of CSIT, SHIATS, Allahabad, U.P, India1
Associate Professor, Dept. of CSIT, SHIATS, Allahabad, U.P, India2
ABSTRACT: In this work, a reliable, power efficient and high throughput routing protocol for Wireless Body Area Networks (WBANs) is proposed. We use multi-hop topology to achieve minimum energy consumption and longer network lifetime. A cost function to select parent node or forwarder is introduced. Proposed cost function selects a parent node which has high residual energy and minimum distance to sink. Residual energy parameter balances the energy consumption among the sensor nodes while distance parameter ensures successful packet delivery to sink. Simulation results show that proposed protocol maximizes the network stability period and nodes stay alive for longer period. Longer stability period contributes high packet delivery to sink which is major interest for continuous patient monitoring.
KEYWORDS: Wireless body Area Network, Cost Function, Residual Energy.
I. INTRODUCTION
Wireless Sensor Networks (WSNs) are used to monitor certain parameters in many applications like environment monitoring, habitant monitoring, [1] battle field, agriculture field monitoring and smart homes. These wireless sensors are dispersed in sensing area to monitor field. WBAN is new emerging sub-field of WSN. A key application of WBAN is health monitoring. Wireless sensors are placed on the human body or implanted in the body to monitor vital signs like blood pressure, body temperature, heart rate, glucose level etc. Use of WBAN technology to monitor health parameters significantly reduces the expenditures of patient in hospital. With the help of WBAN technology, patients are monitored at home for longer period. Sensors continuously sense data and forward to medical server.
Inroads into coordinated, intelligent computing are enabling sensor networks that monitor environments, systems, and complex interactions in a range of applications. Body area sensor networks (BASNs), for example, promise novel uses in healthcare, fitness, and entertainment. Each BASN consists of multiple interconnected nodes on, near, or within a human body, which together provide sensing, processing, and communication capabilities. BASNs have tremendous potential to transform how people interact with and benefit from information technology, but their practical adoption must overcome formidable technical and social challenges, as the “Requirements for Widespread Adoption” sidebar describes.
These challenges have far-reaching implications but offer many immediate opportunities for system design and implementation. Although BASNs share many of these challenges and opportunities with general wireless sensor networks (WSNs)—and can therefore build off the body of knowledge associated with them—many BASN-specific research and design questions have emerged that require new lines of inquiry. For example, to achieve social acceptance, BASN nodes must be extremely non invasive, and a BASN must have fewer and smaller nodes relative to a conventional WSN. Smaller nodes imply smaller batteries, creating strict tradeoffs between the energy consumed by processing, storage, and communication resources and the fidelity, throughput, and latency required by applications. Packaging and placement are also essential design considerations, since BASN nodes can be neither prominent nor uncomfortable.
II. MOTIVATION
Wireless Body Area Sensors are used to monitor human health with limited energy resources. Different energy efficient routing schemes are used to forward data from body sensors to medical server. It is important that sensed data
ISSN(Online): 2320-9801
ISSN (Print): 2320-9798
I
nternational
J
ournal of
I
nnovative
R
esearch in
C
omputer
and
C
ommunication
E
ngineering
(An ISO 3297: 2007 Certified Organization)
Vol. 4, Issue 10, October 2016
of patient reliably received to medical specialist for further analysis. In [17] author presented a opportunistic protocol. Proposed scheme facilitate mobility at cost of low throughput and additional hardware cost of relay node. They deploy sink at wrist. Whenever sink node goes away from transmission range of nodes, it uses a relay node which collect data from sensor nodes. In opportunistic protocol, whenever patient moves his hands, the wireless link of sink with sensor nodes disconnects. Link failure consumes more power of sensor nodes and relay node also more packets will drop, which causes important and critical data to loss.
To minimize energy consumption and to increase the throughput, we propose a new scheme. Our contribution includes: • Our proposed scheme achieves a longer stability period. Nodes stay alive for longer period and consume minimum
energy.
• Large stability period and minimum energy consumption of nodes, contribute to high throughput.
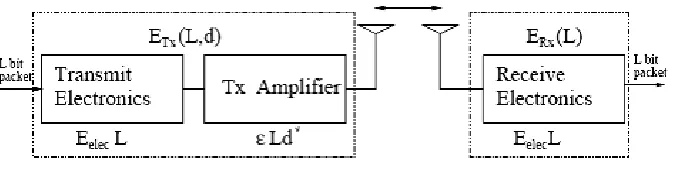
III. THE RADIO MODEL
Many radio models are proposed in literature. We use first order radio model proposed in [18]. This radio model considered, the separation between transmitter and receiver and d2, the loss of energy due to transmission channel. First order radio model equations are given as.
where ET x is the energy consumed in transmission, ERx is the energy consumed by receiver, ET x−elec and ERx−elec are
the energies required to run the electronic circuit of transmitter and receiver, respectively. Eamp is the energy required for amplifier circuit, while k is the packet size.
Figure 1. The radio Model
In WBAN, the communication medium is human body which contributes attenuation to radio signal. Therefore, we add path loss coefficient parameter n in radio model. Equation 2 of transmitter can be rewritten as.
ISSN(Online): 2320-9801
ISSN (Print): 2320-9798
I
nternational
J
ournal of
I
nnovative
R
esearch in
C
omputer
and
C
ommunication
E
ngineering
(An ISO 3297: 2007 Certified Organization)
Vol. 4, Issue 10, October 2016
IV. LEM: PROTOCOL DETAIL
In this section, we present a novel routing protocol for WBANs. The limited numbers of nodes in WBANs give opportunity to relax constraints in routing protocols. Keeping routing constrains in mind, we improve the network stability period and throughput of the network. Next subsections give detail of the system model and detail of LEM protocol.
A. SYSTEM MODEL
In this scheme, we deploy eight sensor nodes on human body. All sensor nodes have equal power and computation capabilities. Sink node is placed at waist. Node 1 is ECG sensor and node 2 is Glucose sensor node. These two nodes transmit data direct to sink. Fig 1 shows the placement of nodes and sink on the human body.
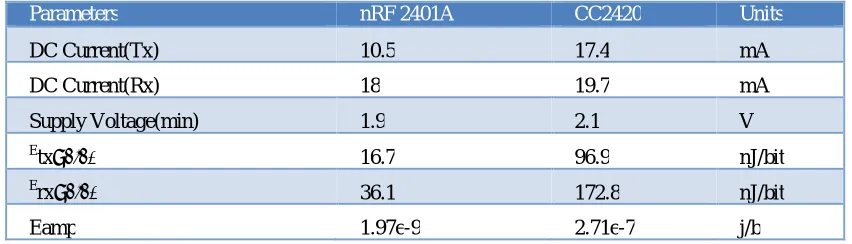
Parameters nRF 2401A CC2420 Units
DC Current(Tx) 10.5 17.4 mA
DC Current(Rx) 18 19.7 mA
Supply Voltage(min) 1.9 2.1 V
E
tx−elec 16.7 96.9 nJ/bit
E
rx−elec 36.1 172.8 nJ/bit
Eamp 1.97e-9 2.71e-7 j/b
TABLE I: Radio Parameters
B. INITIAL PHASE
In this phase, sink broadcast a short information packet which contains the location of the sink on the body. After receiving this control packet, each sensor node stores the location of sink. Each sensor node broadcasts an information packet which contains node ID, location of node on body and its energy status. In this way, all sensor nodes are updated with the location of neighbours and sink.
C. SELECTION OF NEXT HOP
In order to save energy and to enhance network throughput, we proposed a multi hop scheme for WBAN. In this section, we present selection criteria for a node to become parent node or forwarder. To balance energy consumption among sensor nodes and to trim down energy consumption of network, LEM protocol elects new forwarder in each round. Sink node knows the ID, distance and residual energy status of the nodes. Sink computes the cost function of all nodes and transmit this cost function to all nodes.
On the basis of this cost function, each node decides whether to become forwarder node or not. If i is number of nodes than cost function of i nodes is computed as follows:
ISSN(Online): 2320-9801
ISSN (Print): 2320-9798
I
nternational
J
ournal of
I
nnovative
R
esearch in
C
omputer
and
C
ommunication
E
ngineering
(An ISO 3297: 2007 Certified Organization)
Vol. 4, Issue 10, October 2016
D. SCHEDULING
In this phase, forwarder node assigns a Time Division Multiple Access (TDMA) based time slots to its children nodes. All the children nodes transmit their sensed data to forwarder node in its own scheduled time slot. When a node has no data to send, it switches to idle mode. Nodes wake up only at its transmission time. Scheduling of sensor nodes minimize the energy dissipation of individual sensor node.
V. PERFORMANCE METRICS
We evaluated key performance metrics for proposed proto-col. Definition of performance metrics is given in following subsections.
1) Network lifetime: It represents the total network operation time till the last node die.
2) Stability period: Stability period is the time span of network operation till the first node die. The time period after the death of first node is termed as unstable period.
3) Throughput: Throughput is the total number of packets successfully received at sink.
4) Residual Energy: In order to investigate the energy consumption of nodes per round, we consider residual energy parameter to analyze energy consumption of network.
5) Path Loss: Path loss is the difference between the transmitted power of transmitting node and received power at receiving node. It is measured in decibels(dB).
VI. SIMULATION RESULTS AND ANALYSIS
To evaluate proposed protocol, we have conducted an extensive set of experiments using MATLAB R2009a. We studied the performance of the proposed protocol by comparisons with the existing protocol M-ATTEMPT.
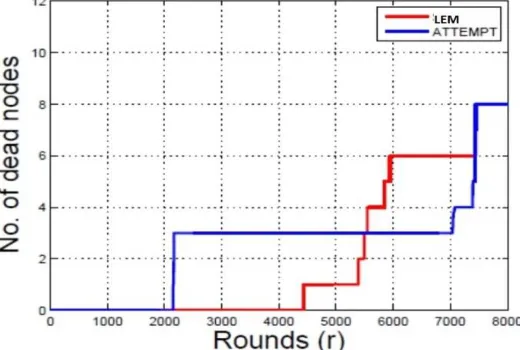
A. NETWORK LIFE TIME
Fig 2 shows the average network lifetime of proposed scheme. The proposed new cost function to elect forwarder node play an important role to balance the energy consumption among the sensor nodes. New forwarder in each round is selected based on computed cost function. Fig 2 clearly depicts that the proposed protocol has longer stability period. This is expected, due to the appropriate selection of new forwarder in each round. Hence, each node consumes almost equal energy in each round and all the nodes die almost at the same time. In M-ATTEMPT, as temperature of forwarder nodes increases, nodes select alternate longer path which consumes more energy. Hence, these nodes die early. Our proposed protocol achieves 31% more stability period and 0.4% longer network lifetime.
ISSN(Online): 2320-9801
ISSN (Print): 2320-9798
I
nternational
J
ournal of
I
nnovative
R
esearch in
C
omputer
and
C
ommunication
E
ngineering
(An ISO 3297: 2007 Certified Organization)
Vol. 4, Issue 10, October 2016
B. THROUGHPUT
Throughput is the successful packet received at the sink. As WBAN has critical and important data of patient, so it requires a protocol which has minimum packet drop and maximum successful data received at sink. LEM protocol achieves high throughput than M-ATTEMPT, as shown in fig 3. Number of packets send to sink depends on the number of alive nodes. More alive nodes send more packets to sink which increases the throughput of network. The stability period of M-ATTEMPT is shorter than LEM protocol which means number of packets sent to sink decreased. Hence, throughput of M-ATTEMPT decreased. On the hand, LEM protocol achieves high throughput due to longer stability period.
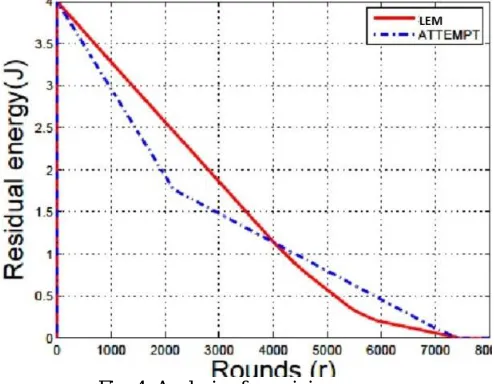
C. RESIDUAL ENERGY
The average energy of network consumed in each round is presented in fig 4. The proposed model use multi hop topology, in which each farthest node transmits its data to sink through a forwarder node. Forwarder node is elected using aforementioned cost function. Selection of appropriate forwarder in each round contributes to save energy. To
Fig. 3: Analysis of Throughput
transfer packets to sink, our multi hop topology use different forwarder node in each round, this restricts over loading of particular node. Simulation results show that LEM protocol consumes minimum energy till 70% of simulation time. It means, in stability period, more nodes have enough energy and they transmit more data packet to sink. It also improves the throughput of the network. On the other hand, in M-ATTEMPT, some nodes exhaust early due to heavy traffic load.
ISSN(Online): 2320-9801
ISSN (Print): 2320-9798
I
nternational
J
ournal of
I
nnovative
R
esearch in
C
omputer
and
C
ommunication
E
ngineering
(An ISO 3297: 2007 Certified Organization)
Vol. 4, Issue 10, October 2016
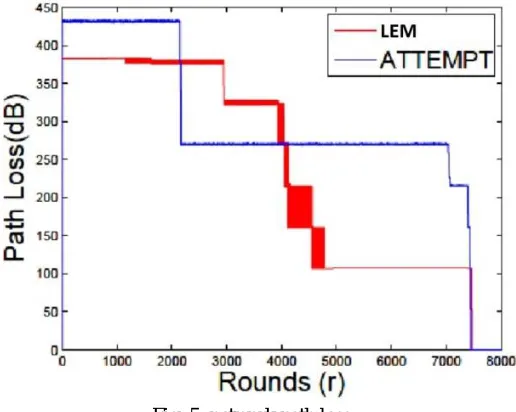
D. PATH LOSS
Fig 5 presents the path loss of different sensors. Path loss is a function of frequency and distance. Path loss shown in figure 5 is function of distance. It is calculated from its distance to sink with constant frequency 2.4GHz. We use path loss coefficient 3.38 and 4.1 for standard deviation σ. Proposed multi hop topology reduces the path loss as shown in figure 5. It is due to the fact that multi hop transmission reduces the distance, which leads to minimum path loss. Fig 5 represents the results of both topologies. Initially LEM protocol performs well. However, after 2000 rounds, path loss of M-ATTEMPT dramatically decreased because some nodes of M-ATTEMPT topology die. Minimum number of alive nodes has minimum cumulative path loss. As our proposed protocol has longer stability period and more alive nodes has more cumulative path loss.
Fig. 5: network path loss
E. PATH LOSS MODEL
Path loss represents the signal attenuation and is measured in decibels (dB). Signal power is also degraded by Additive White Gaussian Noise (AWGN) [19]. Path loss is the difference between the transmitted power and received power whereas antenna gain may or may not be considered. Path loss occurs due to the increasing surface area of propagating wave front. Transmitting antenna radiates power outward and any object between transmitter and receiver causes destruction of radiated signal. In WBAN, different human postures, movement of body, hands and cloths, affects the transmitted signal. Path loss is related to the distance and frequency and expressed as .
The relation of frequency with path loss is expressed as
Where k is frequency dependent factor and it is related to the geometry of the body. The relation of distance with path loss is given as
ISSN(Online): 2320-9801
ISSN (Print): 2320-9798
I
nternational
J
ournal of
I
nnovative
R
esearch in
C
omputer
and
C
ommunication
E
ngineering
(An ISO 3297: 2007 Certified Organization)
Vol. 4, Issue 10, October 2016
gaussian random variable and σ is standard deviation [21]. PLo is received power at reference distance do and it is expressed as:
Where f is frequency, c speed of light and d is distance between transmitter and receiver. The value of reference distance do is 10cm. In reality it is difficult to predict strength of signal between transmitter and receiver boundary. To
solve this issue, we use a deviation variable Xσ.
VII. CONCLUSION
In this paper, we propose a mechanism to route data in WBANs. The proposed scheme use a cost function to select appropriate route to sink. Cost function is calculated based on the residual energy of nodes and their distance from sink. Nodes with less value of cost function are elected as parent node. Other nodes become the children of that parent node and forward their data to parent node. Two nodes for ECG and Glucose monitoring forward their data direct to sink as they are placed near sink, also these two nodes can not be elected as parent node because both sensor node has critical and important medical data. It is not required that these two node deplete their energy in forwarding data of other nodes.
Our simulation results shows that proposed routing scheme enhance the network stability time and packet delivered sink. Path loss is also investigated in this protocol and in future work, we will implement Expected Transmission Count (ETX) link metrics.
REFERENCES
[1] Mainwaring, Alan, et al. “Wireless sensor networks for habitat monitoring.” Proceedings of the 1st ACM international workshop on Wireless sensor networks and applications.ACM, 2002.
[2] N. Javaid, U. Qasim, Z. A. Khan, M. A. Khan, K. Latif and A. Javaid,“On Energy Efficiency and Delay Minimization in Reactive Protocols in Wireless Multi-hop Network”, 2nd IEEE Saudi International Electronics ,Communications and Photonics Conference (SIECPC 13), 2013, Riyadh ,Saudi Arabia.
[3] B. Manzoor, N. Javaid, O. Rehman, M. Akbar, Q. Nadeem, A. Iqbal, M.Ishfaq, “Q-LEACH: A New Routing Protocol for WSNs”, International Workshop on Body Area Sensor Networks (BASNet-2013) in conjunction with 4th International Conference on Ambient Systems, Networks and Technologies (ANT 2013), 2013, Halifax, Nova Scotia, Canada, Procedia Computer Science, Volume 19, 2013, Pages 926-931, ISSN1877-0509 [4] N. Javaid, R. D. Khan, M. Ilahi, L. Ali, Z. A. Khan, U. Qasim, ”WirelessProactive Routing Protocols under Mobility and Scalability Constraints”, J. Basic. Appl. Sci. Res., 3(1)1187-12001, 2013
[5] N. Javaid, Z. Abbas, M. S. Farid, Z. A. Khan and N. Alrajeh,“M-ATTEMPT: A New Energy-Efficient Routing Protocolfor Wireless Body Area Sensor Networks”, The 4th International Conference on Ambient Systems, Networks and Technologies(ANT 2013), 2013, Halifax, Nova Scotia, Canada, Procedia ComputerScience, Volume 19, 2013, Pages 224-231, ISSN 1877-0509,http://dx.doi.org/10.1016/j.procs.2013.06.033. Procedia Computer Science.
[6] Latre, Benoit, et al. “A low-delay protocol for multihop wireless body area networks.” Mobile and Ubiquitous Systems: Networking and Services,
2007. MobiQuitous 2007. Fourth Annual International Conferenceon.IEEE, 2007.