University of Windsor University of Windsor
Scholarship at UWindsor
Scholarship at UWindsor
Electronic Theses and Dissertations Theses, Dissertations, and Major Papers
7-11-2015
Investigation of methods and validation techniques for plastic
Investigation of methods and validation techniques for plastic
injection mold weight reduction
injection mold weight reduction
Bita Mohjernia
University of Windsor
Follow this and additional works at: https://scholar.uwindsor.ca/etd
Recommended Citation Recommended Citation
Mohjernia, Bita, "Investigation of methods and validation techniques for plastic injection mold weight reduction" (2015). Electronic Theses and Dissertations. 5308.
https://scholar.uwindsor.ca/etd/5308
This online database contains the full-text of PhD dissertations and Masters’ theses of University of Windsor students from 1954 forward. These documents are made available for personal study and research purposes only, in accordance with the Canadian Copyright Act and the Creative Commons license—CC BY-NC-ND (Attribution, Non-Commercial, No Derivative Works). Under this license, works must always be attributed to the copyright holder (original author), cannot be used for any commercial purposes, and may not be altered. Any other use would require the permission of the copyright holder. Students may inquire about withdrawing their dissertation and/or thesis from this database. For additional inquiries, please contact the repository administrator via email
Investigation of methods and validation techniques for plastic injection mold weight
reduction
By
Bita Mohajernia
A Thesis
Submitted to the Faculty of Graduate Studies
Through the Department of Mechanical, Automotive & Materials Engineering
in Partial Fulfillment of the Requirements for
the Degree of Master of Science
at the University of Windsor
Windsor, Ontario, Canada
2015
Investigation of methods and validation techniques for plastic injection mold weight
reduction
by
Bita Mohajernia
APPROVED BY:
__________________________________________
Dr. Ahmed Azab, Reader
Industrial & Manufacturing Systems Engineering
______________________________________________
Dr. Nader Zamani, Reader
Mechanical, Automotive & Materials Engineering
______________________________________________
Dr. Jill Urbanic, Advisor
Mechanical, Automotive & Materials Engineering
___________________________________________
Dr. Peter Frise, Co-advisor
Mechanical, Automotive & Materials Engineering
iii
DECLARATION OF ORIGINALITY
I hereby certify that I am the sole author of this thesis and that no part of this
thesis has been published or submitted for publication.
I certify that, to the best of my knowledge, my thesis does not infringe upon
anyone’s copyright nor violate any proprietary rights and that any ideas, techniques,
quotations, or any other material from the work of other people included in my thesis,
published or otherwise, are fully acknowledged in accordance with the standard
referencing practices. Furthermore, to the extent that I have included copyrighted
material that surpasses the bounds of fair dealing within the meaning of the Canada
Copyright Act, I certify that I have obtained a written permission from the copyright
owner(s) to include such material(s) in my thesis and have included copies of such
copyright clearances to my appendix.
I declare that this is a true copy of my thesis, including any final revisions, as
approved by my proposal committee and the Graduate Studies office, and that this
iv
ABSTRACT
Mold making techniques have focused on meeting the customers’ functional and process
requirements; however, today, molds are increasing in size and sophistication. Presently,
mold weight saving techniques focus on pockets to reduce the mass of the mold and
supporting components (platen plate), but the overall size is still large. Reducing the
overall size of the mold is desirable. It is proposed to use Finite Element Analysis
simulation tools to model the forces, and pressures to determine where material can be
removed. The potential results of this project will reduce manufacturing costs. In this
study, a light weight structure is defined by optimal distribution of material to carry
external loads. Topology optimization methods are utilizedto improve structural stiffness
while decreasing the weight and overall envelope of the mold (OptiStruct software).
Results show 8% of weight reduction and the maximum displacement difference of less
than 0.005 , between original and optimized structure and Von Mises stress in the
v
ACKNOWLEDGEMENTS
I would like to express my deepest appreciation to all those who provided me the
possibility to complete this thesis. I am thankful to my supervisor, Dr. Jill Urbanic, whose
advice and knowledge added to my graduate experience. Her insight has inspired me, and
I would appreciate her support. I would also want to express my gratitude to my
co-advisor Dr. Frise for his support. I would like to appreciate my committee members, Dr. Ahmad Azab and Dr. Nader Zamani for their valuable suggestions. Furthermore, a
special thanks goes to Omega Tools personnel for their patience, kindness and their
valuable experience which guided me in this thesis. I am especially grateful to my
vi
TABLE OF CONTENTS
DECLARATION OF ORIGINALITY ... iii
ABSTRACT ... iv
LIST OF TABLES ... ix
LIST OF FIGURES ...x
LIST OF APPENDICES ... xiii
LIST OF ABBREVIATIONS ... xiv
CHAPTER 1- Introduction ... 1
1.1 Plastic injection mold ... 1
1.2 Plastic injection machine ... 4
1.3 Cycle sequence in injection molding ... 4
1.4 Process of designing an injection mold ... 6
1.5 Manufacturing guidelines standard for extremely high volume mold ... 7
1.5.1 Mold base ... 7
1.5.2 Cavity and core ... 7
1.5.3 Cooling ... 7
1.5.4 Ejection ... 8
1.6 Mold failures ... 8
1.7 Mold maintenance ... 8
Problem Description ... 10
Objective ... 11
CHAPTER 2- Literature review ...13
2.1 Plastic injection mold design ... 13
2.2 Plastic injection process optimization ... 13
2.3 Plastic injection mold weight reduction ... 13
2.4 Structural optimization ... 13
2.5 Thermal analysis and design of plastic injection molds ... 14
2.6 Table of literature review ... 15
vii
3.1 FEA analysis ... 18
3.2 Structural optimization ... 18
3.3 Topology optimization: ... 20
3.4 Software Selection ... 23
3.5 SIMP method in Optistruct ... 23
3.6 A trial case for 2D Topology optimization problem ... 24
CHAPTER 4- Model decription, analysis setup, structural optimization and validation ..37
4.1 Mold geometry ... 37
4.2 Geometry cleanup: ... 40
4.2.1 Removing unnecessary details: ... 40
4.2.2 Refining topology to achieve a quality mesh... 41
4.3 Meshing ... 42
4.3.1 2D meshing ... 42
4.3.2 3D meshing: ... 43
4.4 Element quality check ... 43
4.5 Assigning material and properties ... 44
4.6 Defining design space and non-design space ... 44
4.7 Analysis setup ... 45
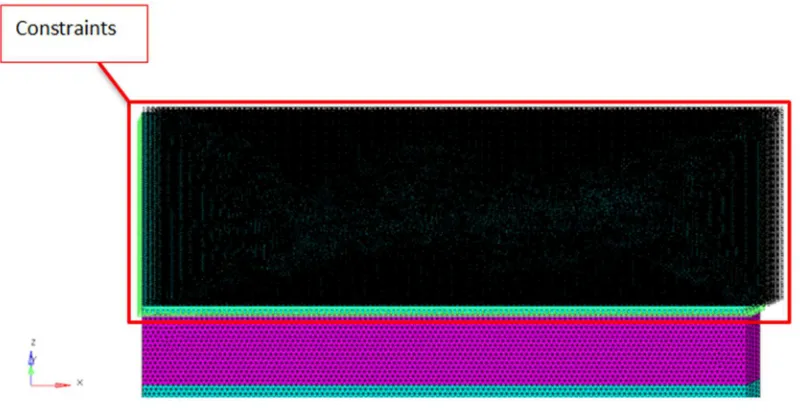
4.7.1 Constraints ... 45
4.7.2 Loads ... 46
4.7.3 Defining optimization criteria ... 50
4.8 Results of static analysis of primary model... 52
4.9 Results of topology optimization ... 54
4.10 Results interpretation and redesign of the die ... 58
4.11 Mold with smaller overall size ... 60
4.12 Validating results by installing mold deflection sensors ... 61
CHAPTER 5- A coupled heat transfer/structural analysis ...68
5.1 Cavity Temperature ... 68
5.2 Coupled thermal/ structure analysis result ... 71
CHAPTER 6- Summary, conclusion and future works ...74
6.1 Summary and conclusion ... 74
viii
REFERENCES ...77
APPENDICES ...80
ix
LIST OF TABLES
Table 1.1 Standard material used for mold manufacturing and their costs………... 3
Table 1.2 Steps of project……….. 12
Table 2.1 Summary of literature review……… 17
Table 3.1 Original and optimized c-clip weight comparison……… 28
Table 3.2 Displacement changes based on load and time for original C-clip………... 32
Table 3.3 Displacement changes based on load and time for optimized C-clip………. 33
Table 3.4 Numerical values of theoretical and experimental displacement for original and optimized c-clip and the calculated error………... 34
Table 3.5 Original and optimized c-clip weight comparison based on theory………. 36
Table 3.6 Original and optimized c-clip weight comparison based on theory……… 36
Table 4.1 Material properties of P20 steel tool………. 40
Table 4.2 Demonstration of element quality………. 44
Table 4.3 Inputs of FE model in Optistruct………... 52
Table 4.4 Results of static analysis of primary model………... 52
Table 4.5 Results of static analysis of optimized interpreted model……… 59
Table 4.6 Results of static analysis of proposed model……… 61
Table 5.1 Sensor’s application and depth of tip to mold surface table……….. 69
x
LIST OF FIGURES
Fig 1.1 Injection molding machine, mold block, platen plates, injection and ejection
systems[1]………. 3
Fig 1.2 Sequence of injection molding, First stage, Injection [2]………... 5
Fig 1.3 Sequence of injection molding, second stage Solidification [2]…………... 5
Fig 1.4 Sequence of injection molding Ejection [2]………. 6
Fig 1.5 Front view of a cavity block illustrating the size and complexity of a standard application (all dimensions are in inches)………... 10
Fig 1.6 Top view of the cavity block (all dimensions are in inches)……… 11
Fig 3.1 Three categories of structural optimization a) Sizing optimization of a truss structure, b) Shape optimization and c) Topology optimization. The initial problems are shown at the left and the optimized solutions are shown at the right [3]……… 20
Fig 3.2 Topology optimization problem set up (yellow triangles are constraints and applied loads are demonstrated with blue arrows)……… 25
Fig 3.3 Displacement contour for the original c-clip along Z axis each color corresponds to a range of displacement (m), varying between 1.0 E-5 m and 2.6 E-4 m……… 26
Fig 3.4 Element density contour plot……… 26
Fig 3.5 Optimized model of c-clip after performing topology optimization……… 27
Fig 3.6 Displacement contour for the optimized geometry, each color corresponds to a range of displacement (m) varying between -1.6 E-5 m and 3.8 E-4 m………... 27
Fig 3.7 Von Mises stresses (Pa) contour for the optimized geometry……….. 28
Fig 3.8 C-clip in tensile test machine (Instron)……… 29
Fig 3.9 Optimized model with iso value of 0.15……….. 31
Fig 3.10 Load-displacement diagram, original c-clip………... 32
Fig 3.11 Load-displacement diagram, optimized c-clip………... 33
Fig 3.12 Displacement- Iso value diagram for theory and experiment tests……… 35
Fig 3.13 Optimized geometry based on theoretical result……… 35
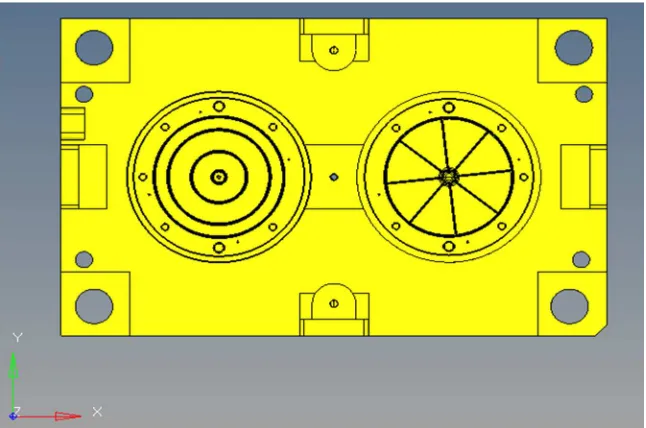
Fig 4.1 Mold block consisting core, yellow part, and cavity, blue part, from industrial partner……….. 37
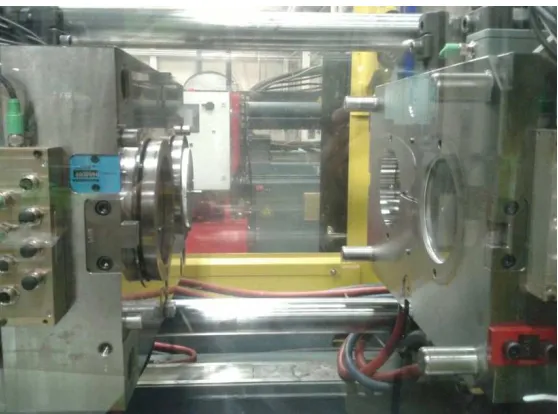
Fig 4.2 Mold block mounted in injection molding machine………. 38
Fig 4.3 Front view of cavity block……… 38
xi
Fig 4.5 Front view of core block……….. 39
Fig 4.6 Side view of core block……….... 39
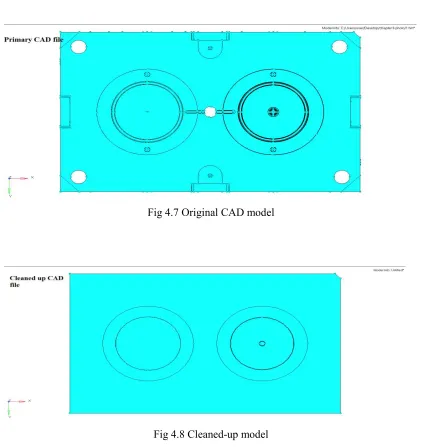
Fig 4.7 Original CAD model……… 41
Fig 4.8 Cleaned-up model ……… 41
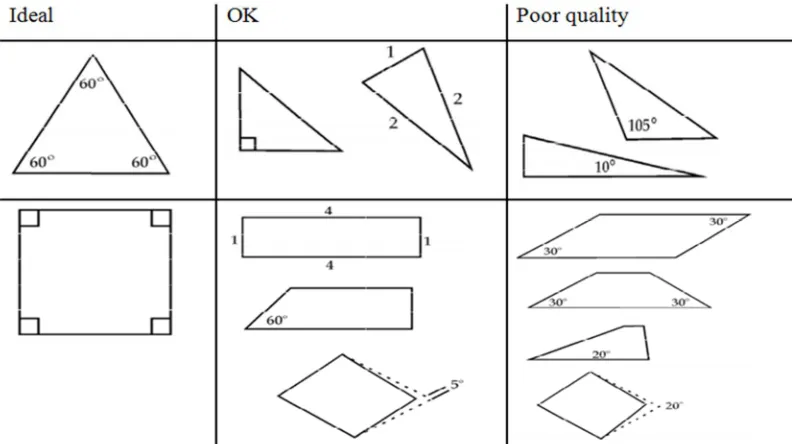
Fig 4.9 Topology refinement examples [4]………. 42
Fig 4.10 Triangular and quadrilateral elements……… 42
Fig 4.11 3D elements, tetra, penta and hexa………. 43
Fig 4.12 Meshed cavity and tetrahedral elements in meshed cavity……… 43
Fig 4.13 Model configuration consisting design space (purple mesh) and non-design space (blue mesh)………... 45
Fig 4.14 Constrained cavity block……… 46
Fig 4.15 Button style cavity pressure sensor [5]……… 47
Fig 4.16 Button style cavity pressure sensor dimensions [5]………. 47
Fig 4.17 Pressure sensors located behind the ejector pin [5]………... 48
Fig 4.18 Cavity pressure sensors are installed in the core block………. 48
Fig 4.19 Pressure-time diagram, Cavity pressure is plotted for both sensors in each cavity………. 49
Fig 4.20 Loaded model, red arrows show the applied pressure to the mold……… 50
Fig 4.21 Displacement contour plot for primary model………. 53
Fig 4.22 Topology optimized mold, top block is the cavity block and bottom block is the core block………... 54
Fig 4.23 Results of topology optimized mold, only the design space has been demonstrated, top view………. 54
Fig 4.24 Element density plot for topology optimization results, top view and bottom view………... 56
Fig 4.25 IGES file extracted from topology results using Ossmooth……… 57
Fig 4.26 Optimized interpreted geometry………. 58
Fig 4.27 Displacement contour plot for optimized interpreted model………... 59
Fig 4.28 Stress contour plot for optimized interpreted model……….. 60
Fig 4.29 Displacement contour plot for proposed model……… 61
Fig 4.30 Deflection sensors placement on cavity half………... 62
Fig 4.31 Mold deflection sensor installed in cavity block on parting line [6]………. 63
Fig 4.32 Deflection-time diagram, original model……….. 64
xii
Fig 4.34 The mold is clamped and peak pressure of cavities are demonstrated with green
and blue lines) has happened t=3.112 S………... 65
Fig 4.35 The mold is clamped and peak pressure of cavities are demonstrated with green
and blue lines) has happened t=3.3 S……… 65
Fig 4.36 Deflection (mils)-time(s) diagram for = 2 = 4 , original structure……… 66
Fig 4.37 Deflection (mils)-time(s) digram for = 2 = 4 , Optimized structure……. 67
Fig 5.1 Cavity temperature sensors [7]………. 68
Fig 5.2 Cavity temperature sensor and depth of tip to the cavity surface [7]………. 69
Fig 5.3 Cavity temperature sensors and module, installed in cavity block……… 69
Fig 5.4 Temperature-time diagram, Cavity temperature is plotted for both sensors in each
cavity………. 70
Fig 5.5 deflection contour due to coupled thermal structure analysis of original
model……… 71
Fig 5.6 deflection contour due to coupled thermal structure analysis of optimized
interpreted model……….. 72
Fig 5.7 deflection contour due to coupled thermal structure analysis of smaller
model……… 72
Fig 6.1 Compliance curve vs iteration numbers for optimization with VOF of 0.5…………. 74
xiii
LIST OF APPENDICES
Appendix A: Deflection contour for original model, optimized interpreted model and
smaller model……… 80
Appendix B: Deflection contour for coupled structure/thermal analysis results……... 83
Appendix C: Mesh quality check……….. 86
xiv
LIST OF ABBREVIATIONS
FEA Finite Element Analysis
IGES Initial Graphics Exchange Specification
SIMP Solid Isotropic Material with Penalization
CM Corrective Maintenance
PM Preventive Maintenance
MMS Minimum Member Size
1
CHAPTER 1 INTRODUCTION
Preface:
The Windsor area is known for its mold making capabilities. The companies
design and build prototype and production tooling, and are involved with design for
manufacturing activities related to improving the process costs without impacting process
design. They may be involved in production activities as well. The industrial sponsor for
this research is a mold manufacturing company that, offers a wide range of solutions for
complex tooling challenges in the plastic injection molding industry. They have 30 year’s
experience and capabilities in all aspects of the tooling industry, from new builds to
engineering modifications and trouble shooting of the tooling issues.
Background, plastic injection molding
The plastic injection molding process is one of the key processes in producing
plastic parts of almost any complexity. Injection molding is the most common method of
producing plastic parts. The process involves injecting molten plastic at a high pressure
into a mold, shaped into the form of a part. The increasing size and complexity of these
plastic parts requires larger, heavier and costlier molds which are designed traditionally
and based on trial and error methods. However, this enlarging of the mold size cannot be
performed indefinitely, since it introduces cost, time, and performance related issues. The
plastic injection mold design starts with refining the design of the component for the
injection molding process. Once the component is designed, the mold elements are
designed, and the plastic injection molding criteria is established.
In the design process of an injection mold, it is desirable to optimize the design
for the mold structure (as well as the part being molded) in predetermined circumstances
for given sets of loads and boundary conditions.
1.1Plastic injection mold
The mold tool, which is usually made from hardened steel (high volume
production) , provides the shape of the plastic parts. Using a designed and
well-made (surface finish / polish) mold tool is vital in ensuring the quality of the plastic part
2
desired shape. The mold assembly consists of platens, cavity block and core block,
usually made of tool steel (P20), which are described in detail in this chapter. The main
function of mold is to shape the liquefied plastic inside the mold cavity and eject the
solidified molded part. The stationary component of the mold is named the cavity block
and the moving part of the mold is named the core block. The core block is connected to
the cavity block with the use of tie bars. In addition to the cavity and core blocks, there
are other components in the mold, each of which serves a function during the molding
cycle.
A mold should have distribution channels through which the molten plastic flows
from the nozzle of the injection barrel into the cavity. The distribution channel consists of
the following:
• Sprue: Sprue is a passage through which the plastic is introduced into a mold. • Runner: Runner is a system that feeds material into the cavity.
• Gate: Gate in mold constricts the flow of plastic into the cavity.
The mold needs an ejection system to eject the molded part out the cavity at the
end of the molding cycle. Ejector pins are built into the moving half of the mold. They
are used to push the solidified component out of the cavity. The cavity is divided between
the two mold halves in such a way that the natural shrinkage of the molding causes the
part to stick to the moving half. When the mold opens, the ejector pins push the part out
of the cavity. A cooling system is also required for the mold. Water is circulated to
remove heat from the hot plastic. Air should be removed from the mold cavity using a
vacuum when the plastic enters the cavity. Much of the air passes through the small
ejector pin. In addition, narrow air vents are often machined into the parting line of the
mold. These channels allow air to escape to the outside. These components are illustrated
3
Fig 1.1 Injection molding machine, mold block, platen plates, injection and ejection systems[1]
Plastic injection molds are usually made of steel tool. The following table
demonstrates the type of material for manufacturing different parts of the mold.
Steel type Usage Price per pound
P20 Core and cavity blocks, the components used to de-mold any undercuts such as lifters and slides
1.5 $
1020, 4140 back plates, ejector plates 1$
TM180 For area that is difficult to cool with P20 steel, TM180 is used, TM180 is a beryllium free copper/ nickel alloy with excellent thermal conductivity properties
18$
4
1.2Plastic injection machine
An injection molding machine consists of two principal components: the plastic
injection unit and the clamping unit.
• The plastic injection unit:
The injection unit consists of a barrel that is fed from one end by a hopper containing
a plastic pellets. There is a reciprocating screw inside the barrel. The screw turns
inside the barrel. It mixes and heats the plastic simultaneously. The screw moves
forward to inject molten plastic into the mold. A nonreturnable valve mounted near
the tip of the screw prevents the melt from flowing backward. Generally, the
functions of the injection unit are to melt and homogenize the plastic, and then inject
it into the mold cavity.
• The mold clamping unit:
The clamping unit of injection machine holds the two halves of the mold in proper
alignment with each other, keeps the mold closed during injection, and opens and
closes the mold at the appropriate times. The clamping unit consists of two platens (a
fixed platen and movable platen), and a mechanism for moving the moveable platen.
The mechanism is basically a power press that acts by means of a hydraulic piston
[8].
1.3Cycle sequence in injection molding
Injection: Before the injection process starts, the core and cavity blocks should
be closed securely. The clamping unit of the machine produces the required clamping
force for the two halves. Plastic, usually in form of pellets, is fed into the hopper. The
hopper is a funnel shape device, which is located on the top of barrel, and it is the
entrance of resin into the barrel. As the resin enters the injection barrel, it is driven
forward by rotation of screw, which is powered by the hydraulic motor. The resin melt as
the turning screw drags it to the nozzle end. This is referred to as drag flow, which causes
the polymer molecules to slide over each other creating the frictional heat, which melts
the material. The injection system (heaters and barrel with single screw extruder) heats
5
Fig 1.2 Sequence of injection molding, First stage, Injection [2]
Solidification: The molten plastic inside the cavity starts to cool. Shrinkage
happens during cooling; therefore, the packing of the material in the injection stage
allows additional material to flow into the mold and reduce the amount of visible
shrinkage.
Fig 1.3 Sequence of injection molding, second stage Solidification [2]
Ejection: When the molded part solidified to an extent that it could retains its
shape without external support, the clamping unit of the machine opens the core and the
6
Fig 1.4 Sequence of injection molding, Ejection [2]
1.4Process of designing an injection mold
The design of an injection mold is a complicated task. A mold designer first
gathers all the required information related to the part design. The designer decides on the
type of injection machine and mold according to the customer’s requirement and arranges
all the steps of the design from the primary design to the detailed design. The mold
designer has to design the cavity of the mold, which accurately shapes the part, and the
runner system and position and orientation of different parts of the injection mold and
make sure that the entire mold assembly works appropriately. Designers apply
engineering techniques and trial and error methods to come up with their desired mold
layout. There are three steps for the general design flow:
Step 1
Collect comprehensive information around part’s geometry and its layout. Perform
design modifications to ensure about the manufacturability of the final design.
Step2
Develop of core and cavity: Determine the parting lines of the core and cavity according
to their manufacturability considerations. Check the core and cavity designs carefully for
interferences.
Step3
Design the gating, ejection system, venting system, cooling lines and finally determine
7
1.5 Manufacturing guidelines standard for extremely high volume mold
(Extremely high volume production injection molds built for lifetime cycles
exceeding one million)
• Mold should run in a full automatic cycle.
• Primary mold layout should be approved by the tooling engineer before constructing the mold.
• Final mold design must be updated with all modifications prior to mold approval. • All screws, bolts, leader pins/bushings, ejector pins, ejector blades, etc. should be
standard stock items wherever possible.
1.5.1 Mold base
• All mold base plates should be fabricated from stainless steel material.
• Straight parting line interlocks should be on both sides of the vertical and horizontal axes.
1.5.2 Cavity and core
• All molding surfaces should be made of hardened tool steel and heat treated to a minimum of 48 Rockwell “C” hardness.
• Venting is required because of entrapment of air in the mold cavity. When venting is improperly designed, “gas burn” happens. Gas burn is small spot on plastic
part. [9]. Example design guidelines are:
a. Last to fill areas must always have appropriate venting.
b. Deep pockets must be vented wherever possible.
1.5.3 Cooling
• Water lines should be distributed in both the core and cavity blocks.
• The water inlet and outlet locations should be located so they do not interfere with the molding machine tie bars and mold clamp slots.
8
1.5.4 Ejection
• The ejector plates should run on guided bushings. • Bushings shall be self-lubricated.
• The ejector plate travel must be sufficient for full part ejection and consistent automatic molding cycle operation.
• The ejector pins and sleeves shall be industry standard sizes wherever possible. All exceptions must be noted and approved by the design engineer.
• All ejector plates should have return springs where the mold design and mold operation allows.
1.6 Mold failures
Mold failure can occur due to deformation, cracking, wear, erosion, etching and
pitting. In order to reduce the likelihood of above mentioned failures, the following
criteria should be met:
• Mold design should be compatible with the mold material selected for that and with the required planned procedure.
• Perform the appropriate heat treatment procedure for the steel used in the mold structure.
• Use high hard P20 steel where the plastic material is very abrasive.
• Control of all finishing operations. Surface finishing is a broad range of industrial processes that alter the surface of a manufactured item to achieve a certain
property. Finishing processes may be employed to: improve appearance, adhesion
or wettability, corrosion resistance, wear resistance, hardness, and other surface
flaws, and control the surface friction.
• Controlling mold operation specifically over loading.
1.7Mold maintenance
Maintenance can be defined as the necessary activities that are performed to keep
the equipment in specific working conditions. Mold maintenance is performed with the
objective of maximizing the equipment availability in its working condition to achieve
9
conform to safety and environmental regulations [10]. Mold maintenance can be
classified in to two categories:
1. Scheduled or preventive maintenance (PM).
2. Corrective maintenance (CM).
PM is conducted to decrease the failure probability of a certain system, which
involves adjusting operation parameters and repairing or replacing a component of the
system before the system breaks down. Preventive replacement describes the action done
during a PM.
CM is the action to be taken on the system immediately up on its failure to restore
it back to its desire functioning condition. The frequency of conducting CM is not
deterministic. The system is subjected to many factors during its operation. Fatigue cycle
properties of components and operating parameters are just some examples of factors that
makes CM forecasting complex. Failure replacement describes the action done during a
CM.
While performing preventive maintenance, it is important to identify the
components, which should be considered for replacement even if they still appear to be in
perfect condition or components which can be allowed to run until the next PM.
There are four basic maintenance policies
1. Failure base maintenance (FBM).
FBM is a corrective maintenance which is prescribed only on occurrence of
failure.
2. Use based maintenance (UBM).
UBM assumes that failure behavior is known following a trend of increasing
failure rate since the previous maintenance.
3. Condition based maintenance (CBM).
CBM assumes that there exists a system parameter that can be used to predict
the failure behavior. It is activated when the value of a given system
10
4. Opportunity based maintenance (OBM) Failure of one component gives the
chance to carry out preventive maintenance on other components which have
not failed yet.
Problem Description
In today’s mold industry, in spite of the many simulation options available, initial
stock block sizes are dimensioned based on a trial and error method. Only a small
percentage of mold manufacturers employ simulation software to validate their mold
designs, and typically this focuses on material flow and cooling challenges. Most of this
market is not benefiting from the advantages offered by simulation options targeting the
basic mold design. Although trends have increased within companies to familiarize
themselves with these types of software, the high cost of simulation software tools, and
inaccessibility to experienced and qualified work force to utilize them has been always an
issue. In the following pictures, the current trial and error method for dimensioning the
block sizes has been displayed.
Fig 1.5 Front view of a cavity block illustrating the size and complexity of a standard application
11
Fig 1.6 Top view of the cavity block (all dimensions are in inches)
Objective
The main purpose of this research is to redesign and manufacture a mold that has
been structurally optimized for specific load cases while reducing its weight, based on
topology optimization results. The Optistruct software is employed in this research.
Maximizing the stiffness of the structure, with constraints on the volume fraction while
reducing the weight and overall size of the structure is the primary objective of this
research. Key to this goal is validating this optimization process with experimental data
to correlate the simulation and experimental results. The methodology of topology
optimization is used to reach to the optimized structure. Following the steps below (Table
12
Table 1.2 Steps of project
Each step is elaborated in the following chapters. In chapter 2, a literature review,
which summarizes the research focus for mold design and methodology of topology
optimization are presented. The simulation strategies and a 2D topology optimization
problem are presented in chapter 3. The model description, analysis set up and topology
optimization are discussed in chapter 4. A coupled heat thermal/structure analysis is
carried out, and presented in chapter 5. How the theory comes to practice (validation),
summary, conclusions, and future work are represented in the last chapter 6.
Validation of results of optimization by installing appropriate sensors on optimized model
Manufacturing the re-designed mold
Performing coupled structure/ thermal analysis and analyzing the results
Redesigning the mold based on result of optimization consulting our indistrial partner using solid works or NX design software
Interpretation of results of optimization
Optimizing the model using methodology of Topology optimization with Opti struct solver
Defining manufacturing constraints
Defining load steps in Optistruct based on numerical values achieved by sensors in physical experiments
Using pressure and temperature sensors to monitor pressure and temperature, in order to determine the loading condition for the model
Utilizing Hypermesh for problem setup, geometry clean up and meshing the geometry
13
CHAPTER 2
LITERATURE REVIEW
This chapter focuses on literature review of related work to plastic injection
molding, mold design and optimization, mold weight reduction, structural optimization
and coupled heat structure analysis of structures.
2.1 Plastic injection mold design
Michaeli et al, W in 2004, presented an approach in details to mechanical design
of injection mold with the aid of FEA. They performed calculation of mold filling and
mold deformation by linking injection molding simulation to FEA package [11].
Alaneme in 2009 investigated the failure analysis of the mold, which showed that the
short service life of the die component is due to incorrect heat treatment which did not
remove the cold worked structures [12]. Dong-Gyu Ahn in 2010, investigate into
manufacturing a high energy efficiency mold using a rapid manufacturing process hybrid
RM process combining direct metal rapid tooling[13].
2.2 Plastic injection process optimization
In 2004, Chen, W et al, combined numerical simulation software, genetic
algorithms and multilayer neural networks to optimize process parameters considering
parameters such as mold temperature melt temperature, injection time and injection
pressure[14]. Zongbao Chen and Lih-Sheng Turng in 2005 searched in regards to quality
control of injection molding. They organized prior studies into four categories process
setup, machine control, process control and quality control [15].
2.3 Plastic injection mold weight reduction
There is no published research directly related to mold weight reduction
strategies.
2.4 Structural optimization
The foundation of structural optimization dates back to 1904, when Michell found
a formula for structures with minimum weight given stress constraints on design domain
14
minimization of weight subject to stress and displacement constraints [17]. In 2007,
Achtziger and Stolpe used a branch-and-bound method to find the globally optimal
solution to truss topology optimization problems [18]. Karakaya and Soykasap 2011,
used a genetic algorithm to optimize composite plates which is an example of 1D
topology optimization problem[19]. The disadvantage of genetic algorithms for topology
optimization is that they become prohibitively expensive for large systems [20]. Kemin
Zhou in 2011, presented a method to minimize structural volume under stress constraints
subject to multiple load cases for trusses.
Denghong Xiao in 2012, used Topology optimization methodology
to generate robust electric bicycle main frame which was an example of 3D topology
optimization problem with volume fraction constraint but the industrial application and
validation of the achieved results has not been assessed.
2.5 Thermal analysis and design of plastic injection molds
S.H. Tang et al in 2006 present the design of a plastic injection mold and
performing thermal analysis for the mold. Their main objective in thermal analysis of the
mold was analyzing the effect of residual stress on product dimension. The thermal
analysis of plastic injection mold has provided an understanding of the effect of thermal
residual stress on deformed shape of the specimen [21].
15 2.6 Table of literature review
Authors Topolog y optimiza tion Mold mass/wei ght reductio n FEA analysi s Minimu m complian ce plastic injection molding Mold design Volume fraction Threshol d value Coupled heat/structur e analysis Comments Michaeli, W (2004)
Presents an approach in details to mechanical design of injection mold with the aid of FEA and performing calculation of mold filling and mold deformation by linking injection molding simulation to FEA package
Dong-Gyu
(2010)
Investigation into manufacturing high energy efficiency mold using rapid manufacturing process
Ling, Z
(2010)
A method is proposed for multi objective optimization design of mold platen with help of FEA and neighborhood cross section genetic algorithm (NCGA) to improve structure performance of mold platen
Villarreal
(2011)
This paper presents a research aimed at creating a virtual plastic injection molding (VPIM) environment, which is designed and implemented based on techniques such as virtual Reality(VR), multidiscipline simulation, and scientific visualization.
Abul B
(2010)
Cooling channel of mold with copper tube inside has been examined and FEA thermal analysis has been performed with ANSYS simulation software. Mold Flow has been used to get process parameters for analysis
Yongqing
Fu (2013)
In this paper, an optimization approach for black-and-white and hinge-removal topology designs is studied.
Asger Nyman (2014)
Present a method for automatic generation of 3D models based
16 Authors Topolog y optimiza tion Mold mass/wei ght reductio n FEA analysi s Minimu m complian ce plastic injection molding Mold design Volume fraction Threshol d value Coupled heat/structur e analysis Comments Hyun-Jun Kim1 (2010)
A topology optimization program, which is based on the C
language is developed in this study Gilles
Marck (2013)
The design of efficient structure for heat and mass transfer problems involves the implementation of topology optimization
SUN RuJie
(2013)
The procedure of airfoil optimization is carried out. On the basis of the combination of design of experiment (DOE), response surface method (RSM) and genetic algorithm (GA) Erik
Holmberg (2014)
Present topology optimization problem with fatigue constraints.
Thomas A. Reist (2010)
Application of topology optimization to prosthetic design, and details the structural optimization of a new prosthetic knee joint
Denghong
Xiao (2012)
Topology optimization technology is applied to generate robust electric bicycle main frame Krishnan
Suresh (2012)
Introduce an efficient algorithm and implementation for
large-scale 3-D topology optimization. Chien-Jong
Shih (2010)
A practical integrated topology design optimization of minimizing compliance with the empirical
Von Mises stress constraint is presented in this paper. X. Huang
(2010)
This paper shows the possibility of solving any topology optimization problems with multiple constraints using the BESO method
Kemin Zhou (2011)
Present a method to minimize structural volume under stress constraints subject to multiple load caseses.
Dongmei Li
(2010)
17 Authors Topolog y optimiza tion Mold mass/wei ght reductio n FEA analysi s Minimu m complian ce plastic injection molding Mold design Volume fraction Threshol d value Coupled heat/structur e analysis Comments Alaneme (2009)
Failure analysis of mold, showed that the short service life of die component is due to incorrect heat treatment which did not remove the cold worked structure
Dong-Gyu Ahn and Hyun-Woo (2010)
Investigate into manufacturing high energy efficiency mold
using rapid manufacturing process Ling, Z
(2010)
They proposed a method for multi objective optimization design of mold platen with help of FEA
S.H. Tang
(2006)
Present the design of a plastic injection mold and performing thermal analysis for the mold.
18
CHAPTER 3
METHODOLOGY
3.1FEA analysis
Finite element analysis (FEA) is a technique that is used to obtain numerical
solution for engineering problems with complex nature that are difficult or sometimes
impossible to be solved analytically. It is important to note that FEA is a simulation tool
and is not reality. In general, the reality of problem dynamics is described by geometric
model whereas the simulation is conducted on the mathematical model. A mathematical
model is an idealized model in which the geometry, material properties, loads and
boundary conditions are simplified. For instance, distribution of load over a small area
may be considered as concentrated force applied on a point which in reality is not
possible or a support might be considered fixed although there is not any totally rigid
support. FEA is basically applied to a mathematical model. FEA analysis has four basic
steps. The first step is discretizing the CAD model into discrete elements (a mesh). The
model is discretized by dividing into a mesh of finite elements and numbering the nodes
that would define these elements. The second step involves determining matrices that
describe the behavior of each element. The third step is combining these matrices in to a
large matrix equation and solving this equation to determine the values of field quantities
at the nodes. When the equations are solved in some cases, for instance mechanical
problems, stresses are of interest in addition to the displacement. These are calculated
after solution of the global equation system. The last step engages the checking of the
results. The results should be examined to insure they are consistent with the physics of
the problem. This step is performed by post-processing functions of FEA software which
show the results graphically [22].
3.2Structural optimization
A structure in mechanics science is an assemblage of material that is supposed to
sustain a load. Structural optimization refers to designing and fabricating that structure to
carry loads in the best way possible. In this methodology, the model is modified
19
such as mass, stiffness, etc can be considered for optimization of the structure. In order to
achieve the pre-determined objective some constraints and limitations are needed to be
defined. In a structural optimization problem, the following functions and variables are
defined:
1. Objective function (f), is a function that should be maximized or minimized
2. Design variabls (x), is a controllable parameter defined by the designer. They
can be anything that affect the performance of structure such as thickness, etc.
Moreover, they are usually bounded by maximum and minimum values.
3. Response, for any given values of the design variables there is a response
from the structure. Responses are used to evaluate the performance of the
structure. Examples of responses are displacement, volume fraction and
compliance.
4. Constraint is a condition which must be satisfied. Design variables and
responses should be constrained with minimum and maximum values to make
sure that the performance of the structures is in the allowed interval. Typical
constraints are maximum allowable mass and displacement or minimum
allowable stiffness.
In general, structural optimization problem determines the optimal value of design
variables x in a way that maximizes or minimizes the objective function, f, and satisfies
the defined constraints. There are three types of structural optimization problem based on
Christensen and Klarbring [23]. The kind of optimization that is performed depends on
properties of design variable.
Size optimization:
Size optimization is the simplest type of optimization. In this type of optimization
the shape of the structure is known and the objective is optimizing the structure by
adjusting sizes of the components. Size of structural elements such as, thickness of
structure or cross section area of beams, are design variable in this kind of optimization.
In this optimization there is a predefined structure and the size of its member should be
optimized [23].
20
In shape optimization, design variables are considered as parameters which
control the shape of the structure for instance diameter of holes radius of fillets. No new
boundaries and no new holes can be added in this type of optimization.
Topology optimization:
It is a technique that optimizes material of the structure in a specific domain. In
topology optimization, the structure is free to have any shape in the given design domain
[3]. The shape of the structure is not known. This subject will be discussed with more
details in section 3.3.
Fig 3.1 Three categories of structural optimization a) Sizing optimization of a truss structure, b)
Shape optimization and c) Topology optimization. The initial problems are shown at the left and
the optimized solutions are shown at the right [3]
3.3Topology optimization:
Topology optimization is a mathematical technique that optimizes the material
layout in a given design domain. The goal is to find the best layout for the structure that
is subjected to the load and defined constraints. Topology optimization carries out the
structural optimization by indicating where the material can be removed. The only
known values in this kind of problems are the loads and the condition of supports. There
are two main approaches for the solving topological optimization problem: the
homogenization method and density method. Most of topology optimization software
21
employed to perform topology optimization in this thesis. Interested readers are referred
to references [19]and[24] for more details in regards to other solution approaches for the
topological optimization problem.
In the density method a density field of ρ x ∈ [0,1] is defined in the design
domain. The topological optimization problem is changed to a problem of an optimal
distribution of material density. In spite of the mathematical convenience of the density
method it has some weaknesses. Existence of intermediate density values in the structure
is one of the most important inconveniences of this technique. For the continuous
structure these intermediate density values which result in intermediate stiffness values
are meaningless in a design. Element densities should be either zero or one. So to have a
manufacturable design it is desired to have only solid (element density equal to one) or
avoid (element density equal to zero) in the structure. The majority of density based
methods use the SIMP (Solid Isotropic Material with Penalization) method scheme that
favors the configuration of zero or one in the structure. This method scales up the design
variable (relative density of elements) in regions with high strain energy and scales down
the design variable in regions with low strain energy and iteratively creates a new
distribution of stiffness in the structure. The SIMP uses the following scheme [25]:
= (3.1)
Here K is the penalized stiffness and K is the original stiffness matrix of an element. ρ
shows the element density and p the penalization factor (usually p = 3) . This method
makes material with intermediate stiffness values too expensive, since its volume
depends linearly in ρ [26]. The penalization factor is always greater than one and it is
usually measured between two and four. This factor is controlled by Optistruct by
default. This value is increased iteratively in order to get a more discrete solution. The
basic formulation of the topology optimization of minimizing compliance and
constrained volume removal is described as follows [27]:
22
Here is the compliance of structure, ! is displacement vector and is the force vector.
The strain energy of a structure is defined as
= 12 ! (3.3)
Accordingly, under the same loading condition minimizing is equivalent to
minimizing the formation ! or maximizing the stiffness. As a result minimizing
compliance means minimizing strain energy in a structure.
"#$%& '(%: *'+ = . ! ! = ,/-.-.. 0
.1
= , 2. -.-./ 3 0
.1
-#$%& : 4 = , 2.(. ≤ 4
3− 4∗ 8 0
.1
4" =∑ 20.1 4 .(.
3 ≤
43− 4∗ 43 ! =
/. = 2. 3
0 < 2;.< ≤ 2. ≤ 2;=> < 1
(3.4)
In above formula K is the stiffness matrix, N is the number of elements in the
structure, uA displacement vector of the node, K3 is the original stiffness and kA is the
stiffness of optimized element. V is the volume of optimized structure, V3 is the original
volume of the structure, V∗ volume of removed material, VOF is the volume fraction
(optimized volume divided by the original volume, vA the element volume after
performing optimization, xGAH and xGIJ are the lower and upper bound of element
density respectively. xA is the design variable of each element between zero and one. p is
the penalization factor that decreases the intermediate density elements. p is usually equal
to 3 for 3D elements. However, in some more complex structures the penalization
scheme is not always evident and there still exist some intermediate density elements.
23
density elements. This interpretation can results in a non-optimal structure. Consequently
it is necessary to perform FEA analysis on the interpreted geometry as well to see if the
expected result is achieved or not. In this project, the methodology of topology
optimization was used to maximize the stiffness of a linear elastic structure guided by a
constraint on the volume fraction. That leads to optimizing the material layout and weight
reduction of mold.
3.4Software Selection
An important step to solve the optimization problem is to choose the proper
optimization solver. The Hyperworks package contains Hypermesh, a preprocessor that is
used for meshing the CAD geometry setting boundary conditions, material properties and
generally problem set up for optimization, static analysis and other analysis. It also
contains an FEA solver called Optistruct that is used to perform structural optimization.
Optistruct is very capable, and different types of FEA analysis can be performed utilizing
it, such as static analysis and thermal analysis. Optistruct runs the optimization and
modifies the model to achieve the objective given. Optimization with Optistruct can be
performed on 2D and 3D models. Hyperviw is a post processor in Hyperworks package
which is used to evaluate the results. Abaqus is another powerful finite element software
which is capable of doing even computationally heavy finite element analysis problems
but the standard Abaqus package does not contain a structural optimization solver. There
are some packages which can be used along with Abaqus to perform the structural
optimization but we didn’t have access to them. Therefore, Optistruct was selected for
doing the structural optimization.
3.5SIMP method in Optistruct
In Optistruct usually, the penalization factor P is set to P = 2 for shell elements
and P = 3 for solid elements. When manufacturing constraints are applied the value of P
is increased to 3 or 4 [28]. The procedure of topology optimization in Optistruct for
minimizing the compliance problem for a specified volume fraction is as follows:
1. At first a homogeneous distribution of density is applied to elements
within the design space
24
• Alternatively the densities are updated based on the previous iteration. Element densities are scaled up for elements with high
strain energy and densities are scaled down for elements with low
strain energy.
3. For the applied density distribution, FEA analysis is performed and nodal
displacements are achieved
4. The compliance and the corresponding sensitivity of the design variables
are calculated and the compliance modification with respect to the
objective function is tested.
5. If the obtained decrease in the compliance is less than the convergence
criterion, iteration is stopped. Otherwise the iteration is repeated.
The solution in Optistruct consists of all the elements of design space. Hhowever,
densities are scaled varying in the range of 0 and 1. The user should determine the
threshold density to print out the structure (a random value is assigned to threshold
density set by user) [29].
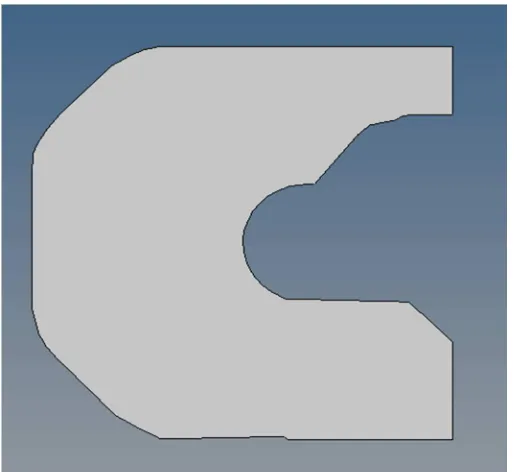
3.6A trial case for 2D Topology optimization problem
In this example, topology optimization is performed on a model to create new
topology for the structure and to remove the unnecessary material from the primary
structure. A C-clip is tested in this study. The resulting structure is lighter and satisfies all
design constraints. This study is performed theoretically and experimentally and analysis
is performed for the original models and optimized ones.
3.6.1 Optimization with Optistruct (software level)
The main parameters are defined as following:
a. Objective function:Minimizing the volume fraction
b. Constraints: Displacement at nodes where loads are applied must not exceed 4 × 10 M in the Z direction
c. Design variables:Density of each element in design space
The C-clip is demonstrated in figure 3.2. It is a squared shape piece with an opening in
25
Hypermesh software was utilized to set up the optimization problem and the Optistruct
solver was used to solve the problem.
The first step was to determine the design domain, optimized domain, and non-design
domain, the area that remains unchanged. The design domain and non-design domain are
displayed in figure 3.2. The geometry was then meshed. In the next step, a particular type
of material should be assigned to the model. Then, loads and constraints were applied on
the model. A load equal to 50 N was applied to 60 points that is equal to 3000 N.
Constraints were applied on both top part and bottom part of the C-clip. The meshed
model loads and constraint are demonstrated in figure 3.2.
Basic FEA was performed and the displacement contour for original model and
optimized model is demonstrated figure 3.3 and figure 3.5, respectively. The result of
optimization is also shown in figure 3.4.
1. Original C-clip
The following figure shows problem set up for this problem. Non-design spaces
are designed to fit the jaws of the tensile test machine.
Fig 3.2 Topology optimization problem set up (yellow triangles are constraints and applied loads
are demonstrated with blue arrows)
Displacement contour for original C-clip
A basic FEA was performed on the model. For the applied loads and constraints, the
26
Fig 3.3 Displacement (m) contour for the original c-clip along Z axis each color corresponds to a
range of displacement (m), varying between 1.0 E-5 m and 2.6 E-4 m
2. Optimized C-clip
The element density contour plot is displayed in figure 3.4. Optimization was
carried out and optimized geometry was achieved based on element density contour plot.
Blue domains are elements with a density equal to zero and red domains are elements
with density equal to one. The remaining elements are intermediate density elements with
a density between zero and one. The user have to decide about these elements.
27
Fig 3.5 Optimized model of c-clip after performing topology optimization
Displacement and Von Mmises stresses contour for optimized C-clip
The displacement contour for the optimized geometry in figure 3.6 shows that the
optimization has satisfied the constraint and material was removed in a way that the
displacement of the optimized model for predetermined load case didn’t exceed 4 × 10 M m . Von Mises stress contour is displayed in figure 3.7.
Fig 3.6 Displacement (m) contour for the optimized geometry, each color corresponds to a range
28
Fig 3.7 Von Mises stresses (Pa) contour for the optimized geometry
Results:
In this example, the load case of 3000 N was applied to the structure and it was
predetermined that the displacement of 4 × 10 Mm is critical. Hence, this value was
defined as a constraint for displacement at points where load was applied. It was desired
to analyze reduction in the volume fraction of the structure while the displacement of new
structure had constrained to 4E − 4m. The optimization results showed 28% weight
reduction for the optimized structure.
Original c-clip Optimized c-clip weight reduction
Weight 0.125 kg 0.090 kg 28%
29 3.6.2 Experimental tests
In order to validate the results of optimization, physical specimens of primary
CAD model and optimized model were built from cold rolled steel sheet with average
elastic module of 2 × 10 N mR Q. Specimens were tested with a tensile test machine.
The specimens were cut with EDM machine and were subjected to controlled tension.
The Instron tensile test machine was utilized to perform the tensile test.
Fig 3.8 C-clip in tensile test machine (Instron)
The test was conducted for the original model and three variation of the optimized
model with three different ISO values (normalized element density values between zero
and one) of 0.15, 0.3 and 0.6. The manufactured specimen with ISO value of 0.15 shows
satisfactory results and less error in comparison with other specimens (The design
determined for the iso 0.15 configuration is shown in Figure 3.8). The iso surface
presentation is a normalized value between zero and one and it is used to display the
concept design of topology optimization results with respect to different element density
values. For instance, zero density elements refer to elements without any structural
30
density of one refer to elements which bear load in the structure and have to be
maintained within the structure. There are also some elements with intermediate density
values which the analyst should decide about the existence or removal of them, using an
appropriate user-determined iso value. Elements with density above the specified iso
value are treated as elements with density of one and would maintain in the structure and
elements with density below that iso value are accounted for as elements with a density
of zero and are removed from the structure. For instance by specifying the density
threshold of 0.3, on the one hand elements with the density of 0.1 or 0.2 or even 0.29 are
considered as zero density elements and are removed from the structure however, these
elements do have some structural relevance. On the other hand elements with density
above the iso value are considered full density elements.
Conventionally, the user specifies the iso values based on engineering judgment.
However, there might be a gap between what the theory suggests and what really works
in practice. Therefore, in many cases, the iso values picked based on engineering
judgment satisfies the constraint in theory, but it might not necessarily lead to a structure
that fulfills the predetermined constraint in practice.
Each test was repeated twice; therefore; eight tests were conducted in total. The load was
applied with the rate of 0.5 mm per minute to obtain a smooth loading condition. The
specimens were fastened into the jaws of Instron machine as demonstrated in figure 3.7.
The non-design spaces of specimens (purple areas) were fixed tightly in top and bottom
jaws to provide the exact condition of model simulation in Optistruct. The physical test
31
Fig 3.9 Optimized model with iso value of 0.15
Test results for original C-clip and optimized C-clip
1. Original C-clip
The load-displacement table and diagram for original model are given as
following:
Cross head (mm) Load (N) Time (s)
0.001 17.30 0.23
0.002 24.80 0.34
0.002 32.74 0.44
0.003 41.31 0.54
. . .
. . .
. . .
0.317 2994.76 38.23
0.318 3004.48 38.33
0.319 3009.27 38.43
0.320 3018.95 38.52
. . .
32
3.00 5443.32 360.34
3.00 5442.67 360.44
Table 3.2 Displacement changes based on load and time for original C-clip
Fig 3.10 Load-displacement diagram, original c-clip
2. Optimized C-clip
The load-displacement table and diagram are as follow
Cross head (mm) Load (N) Time (s)
0.00 4.73 0.14
0.001 12.54 0.23
0.002 19.47 0.34
0.003 26.93 0.43
. . .
. . .
. . .
33
0.45 2999.17 54.93
0.45 3002.55 55.04
0.45 3007.73 55.13
. . .
. . .
1.64 3342.58 198.13
1.65 3340.88 198.24
Table 3.3 Displacement changes based on load and time for optimized C-clip
Fig 3.11 Load-displacement diagram, optimized c-clip
Results and discussion:
Table 3.4 compares the theoretical results and experimental results for the load case = 3000 S.
Displacement
(m)
Error
34
Experiment 3.1 × 10 M
Optimized c-clip Theory 3.8 × 10 M 18%
Experiment 4.5 × 10 M
Table 3.4 Numerical values of theoretical and experimental displacement for original and
optimized c-clip and the calculated error
Discrepancies between theoretical result and experimental result might arise due to
different factors such as: difference between mathematical model and physical model
(loads are simplified and boundary conditions are idealized), inaccurate material
assumption compared to the real material, an inaccurate load application to the specimen
which leads to a combined state of tension and bending in the test specimen, error
between cross head travel vs extensometer measurement and etc. The key output is that
the results are consistent, so a calibrated model can be leveraged.
3.6.3 Geometry extraction for 2D topology optimization problem, based on
experiment
It was realized that in experiment test, for the specimen with iso value=0.15, the
maximum displacement (4.5× 10 M) has exceeded the test limit (displacement at nodes
where loads were applied should not exceed 4× 10 M m). However, we are looking for a
geometry that can satisfy the constraint in physical testing so we have to find a way to
extract that reliable geometry.
The theoretical and experimental displacements based on iso values were plotted
in a diagram and the appropriate iso value based on experiment was extracted by
extrapolating. The geometry based on new iso value is demonstrated in next figure.
Based on the following diagram, it can be concluded that for any iso value less than 0.096
35
Fig 3.12 Displacement- iso value diagram for theory and experiment tests
3.6.4 Comparison between resultant geometry from theory and experiment
The optimized geometry from result of theory is depicted in figure 3.12 and
updated geometry with new is value is shown in figure 3.13. Weight comparison between
original and optimized c-clip for both theory and experiment are presented in tables 3.5
and 3.6 respectively.
Optimization based on theory

![Fig 4.9 Topology refinement examples [4]](https://thumb-us.123doks.com/thumbv2/123dok_us/1399249.1172628/57.612.153.512.67.345/fig-topology-refinement-examples.webp)
![Fig 4.15 Button style cavity pressure sensor [5]](https://thumb-us.123doks.com/thumbv2/123dok_us/1399249.1172628/62.612.121.529.380.618/fig-button-style-cavity-pressure-sensor.webp)
![Fig 4.17 Pressure sensors located behind the ejector pin [5]](https://thumb-us.123doks.com/thumbv2/123dok_us/1399249.1172628/63.612.169.478.403.653/fig-pressure-sensors-located-ejector-pin.webp)